| Param | Original file | Final file |
|---|---|---|
| Filename | modeM0/AS1A10_048T08_9000004020_27812cztM0_level2.evt | modeM0/AS1A10_048T08_9000004020_27812cztM0_level2_quad_clean.evt |
| Size (bytes) | 662,636,160 | 76,495,680 |
| Size | 631.9 MB | 73.0 MB |
| Events in quadrant A | 3,506,229 | 471,505 |
| Events in quadrant B | 7,608,701 | 430,778 |
| Events in quadrant C | 3,791,052 | 455,279 |
| Events in quadrant D | 4,656,094 | 438,622 |
| Mode M0 | |||
|---|---|---|---|
| Quadrant | BADHDUFLAG | Total packets | Discarded packets |
| A | 0 | 15348 | 0 |
| B | 0 | 27610 | 0 |
| C | 0 | 15804 | 0 |
| D | 0 | 18963 | 0 |
| Mode M9 | |||
|---|---|---|---|
| Quadrant | BADHDUFLAG | Total packets | Discarded packets |
| A | 0 | 4 | 0 |
| B | 0 | 4 | 0 |
| C | 0 | 4 | 0 |
| D | 0 | 4 | 0 |
| Quadrant | Total seconds | Saturated seconds | Saturation percentage |
|---|---|---|---|
| A | 7466 | 82 | 1.098312% |
| B | 7466 | 1387 | 18.577552% |
| C | 7466 | 123 | 1.647469% |
| D | 7466 | 222 | 2.973480% |
Noise dominated data is calculated using 1-second bins in cleaned event files. If a bin has >2000 counts, and if more than 50% of those come from <1% of pixels, then it is considered to be noise-dominated and hence unusable.
| Quadrant | # 1 sec bins | Bins with >0 counts | Bins with >2000 counts | High rate bins dominated by noise | Noise dominated (total time) | Noise dominated (detector-on time) | Marked lightcurve |
|---|---|---|---|---|---|---|---|
| A | 7846 | 7466 | 0 | 0 | 0.00% | 0.00% | 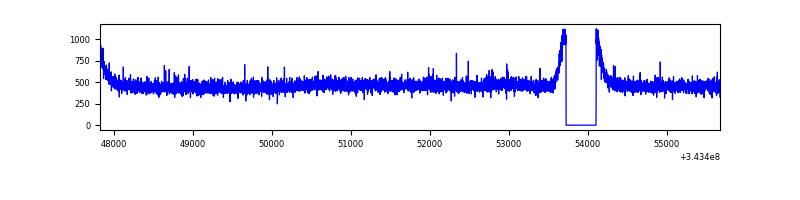 |
| B | 7846 | 7466 | 988 | 988 | 12.59% | 13.23% | 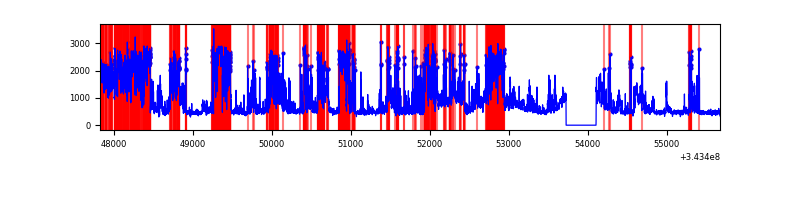 |
| C | 7846 | 7466 | 0 | 0 | 0.00% | 0.00% | 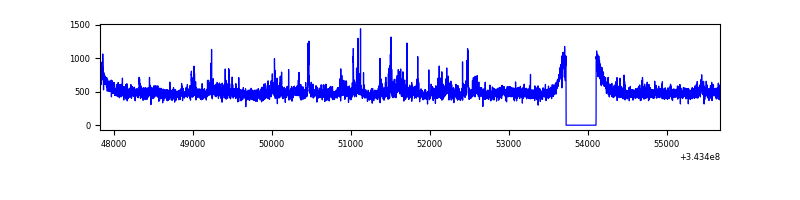 |
| D | 7846 | 7466 | 176 | 176 | 2.24% | 2.36% |  |
Top three noisy pixels from each quadrant. If the there are fewer than three noisy pixels in the level2.evt file, extra rows are filled as -1
| Pixel properties | Quadrant properties | ||||||
|---|---|---|---|---|---|---|---|
| Quadrant | DetID | PixID | Counts | Sigma | Mean | Median | Sigma |
| A | 13 | 254 | 13054 | 66.13 | 908 | 888 | 184.0 |
| A | 3 | 137 | 8911 | 43.61 | 908 | 888 | 184.0 |
| A | 0 | 226 | 7552 | 36.22 | 908 | 888 | 184.0 |
| B | 10 | 245 | 4190396 | 25444.44 | 848 | 825 | 164.7 |
| B | 0 | 190 | 22687 | 132.77 | 848 | 825 | 164.7 |
| B | 12 | 111 | 20567 | 119.9 | 848 | 825 | 164.7 |
| C | 3 | 233 | 244418 | 1170.4 | 873 | 876 | 208.1 |
| C | 14 | 238 | 137293 | 655.58 | 873 | 876 | 208.1 |
| C | 13 | 61 | 6153 | 25.36 | 873 | 876 | 208.1 |
| D | 1 | 52 | 1179426 | 5508.5 | 873 | 846 | 214.0 |
| D | 12 | 233 | 69904 | 322.76 | 873 | 846 | 214.0 |
| D | 2 | 250 | 48859 | 224.4 | 873 | 846 | 214.0 |
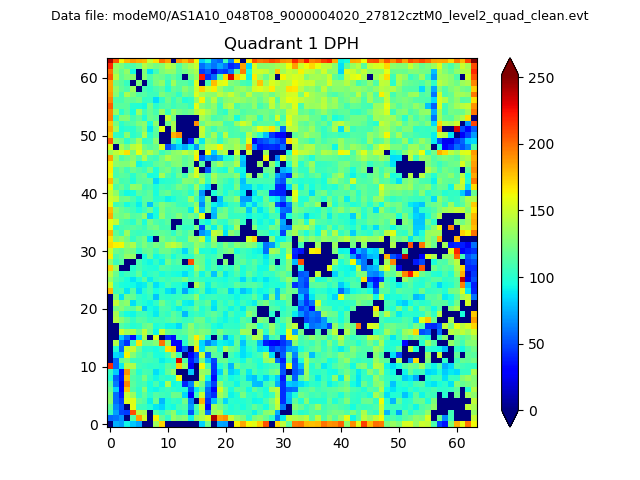
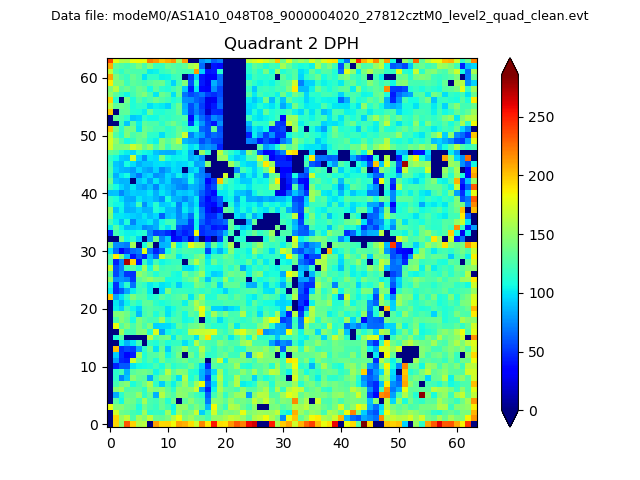
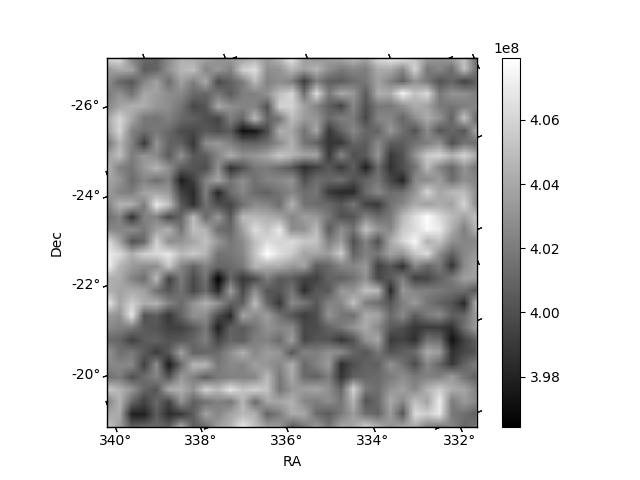
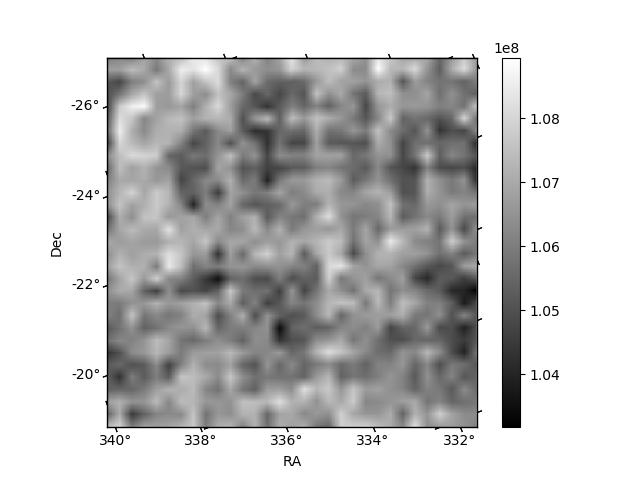
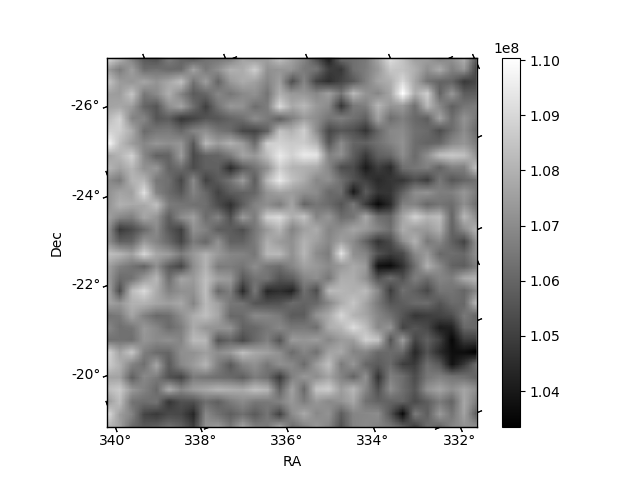
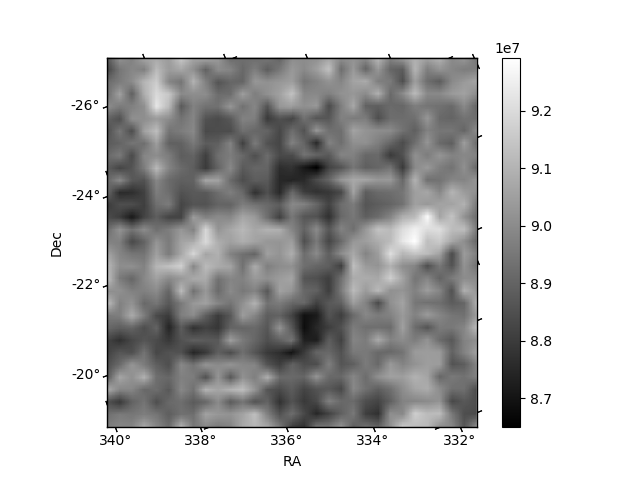
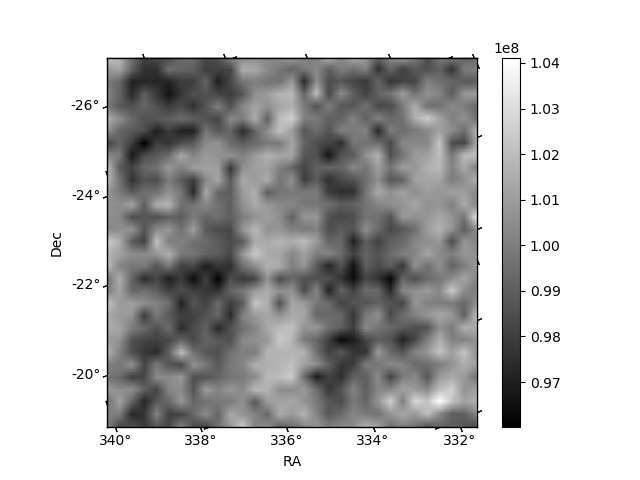
Histogram calculated using DETX and DETY for each event in the final _common_clean file
| Quadrant A | 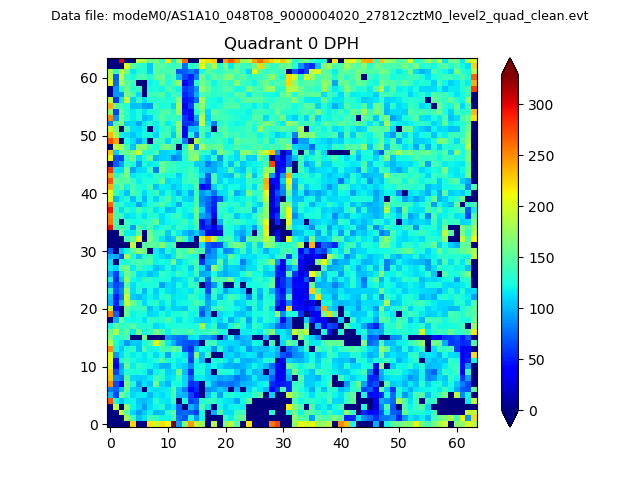 |
 |
Quadrant B |
|---|---|---|---|
| Quadrant D | 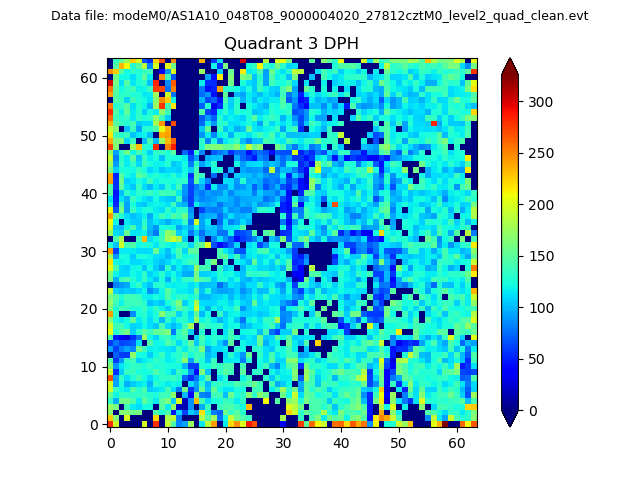 |
 |
Quadrant C |
| Plot type | Count rate plots | Images |
|---|---|---|
| Comparison with Poisson distribution Blue bars denote a histogram of data divided into 1 sec bins. Red curve is a Poisson curve with rate = median count rate of data. |
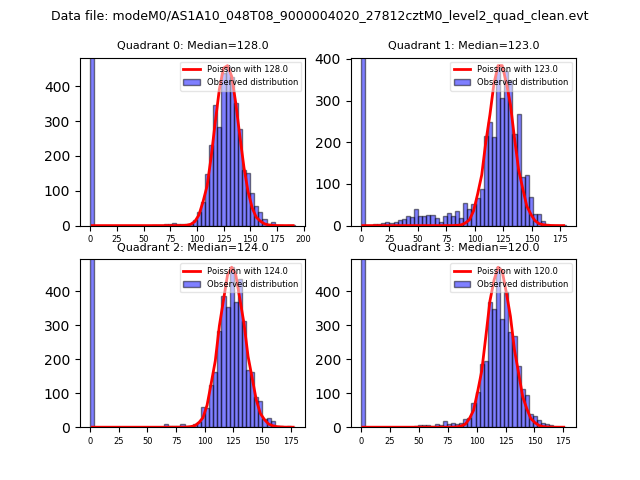 |
 |
| Quadrant-wise count rates Data is divided into 100 sec bins |
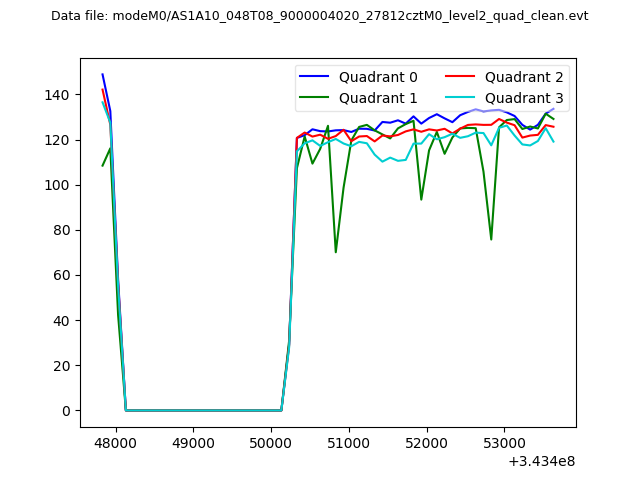 |
|
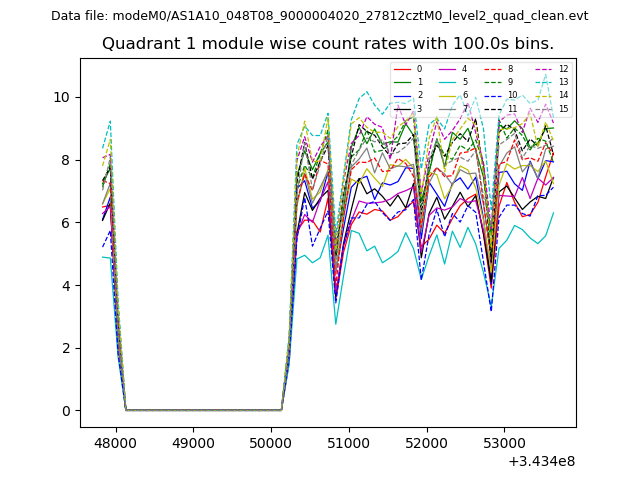
| Module-wise count rates for Quadrant A Data is divided into 100 sec bins |
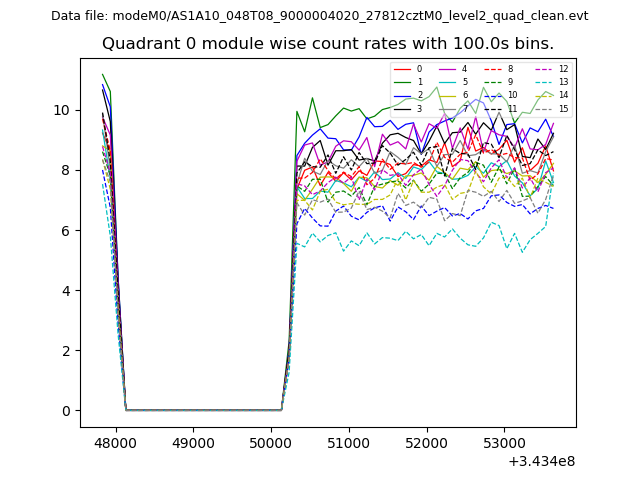 |
 |
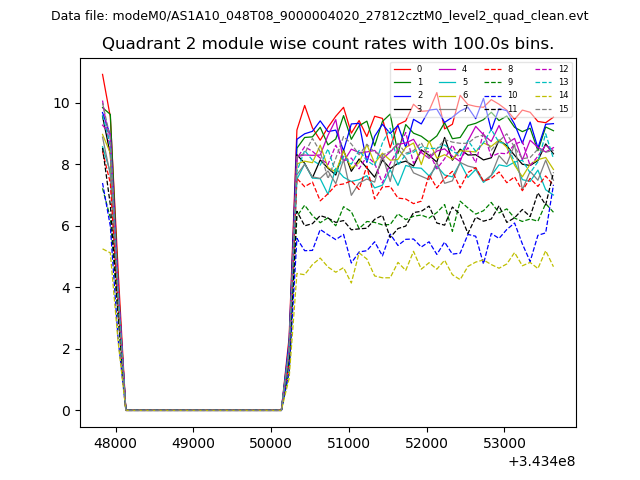
| Module-wise count rates for Quadrant B Data is divided into 100 sec bins |
 |
 |
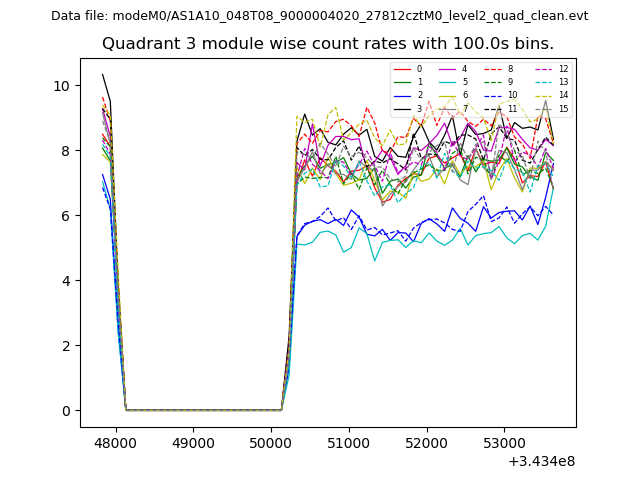
| Module-wise count rates for Quadrant C Data is divided into 100 sec bins |
 |
 |
| Module-wise count rates for Quadrant D Data is divided into 100 sec bins |
 |
 |
| Parameter | Plot |
|---|---|
| CZT HV Monitor | 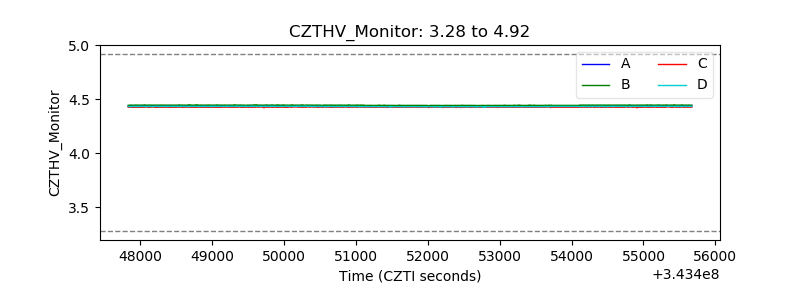 |
| D_VDD |  |
| Temperature 1 | 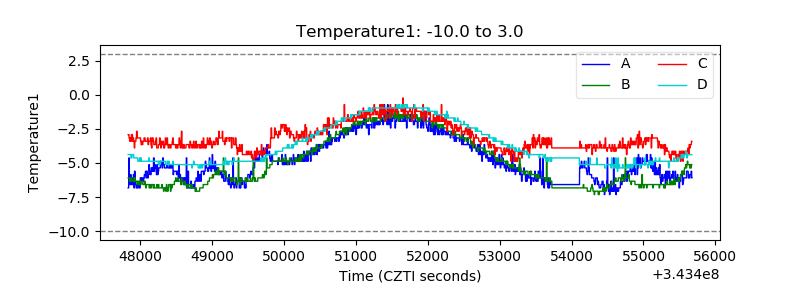 |
| Veto HV Monitor |  |
| Veto LLD | 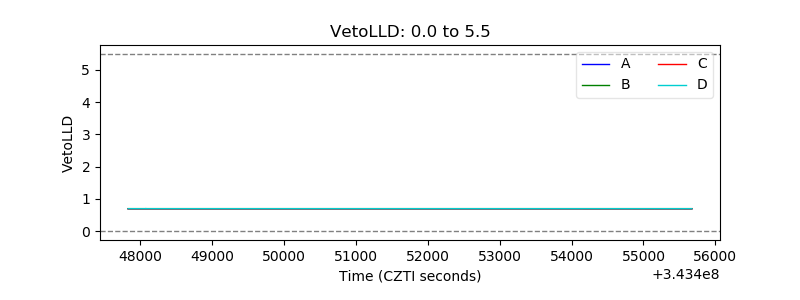 |
| Alpha Counter | 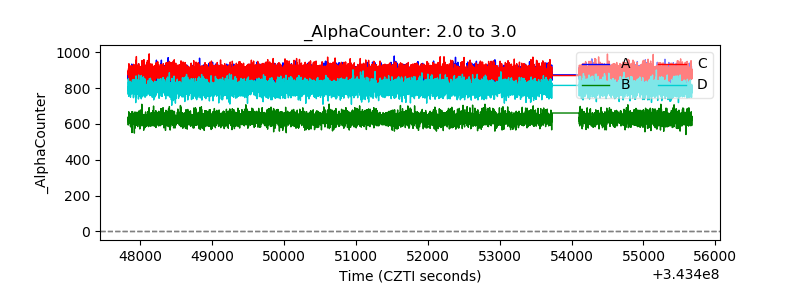 |
| _CPM_Rate | 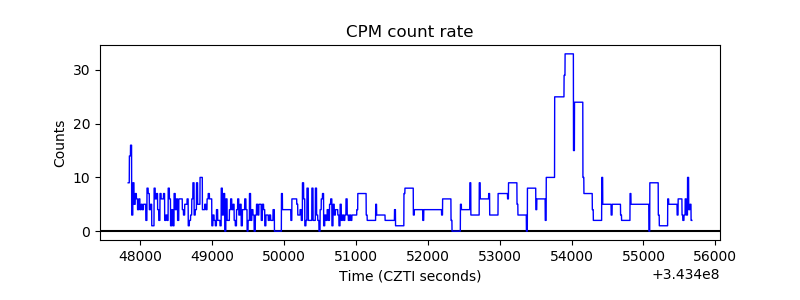 |
| CZT Counter | 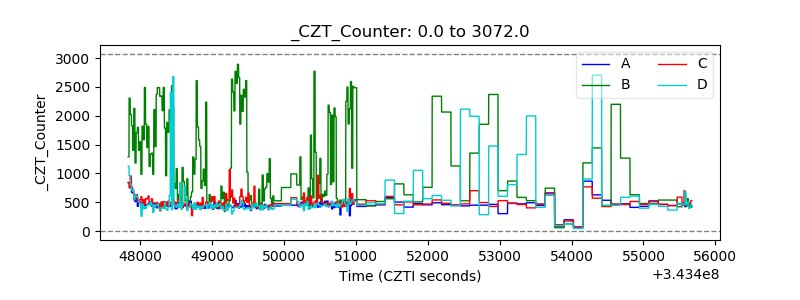 |
| +2.5 Volts monitor |  |
| +5 Volts monitor |  |
| _ROLL_ROT | 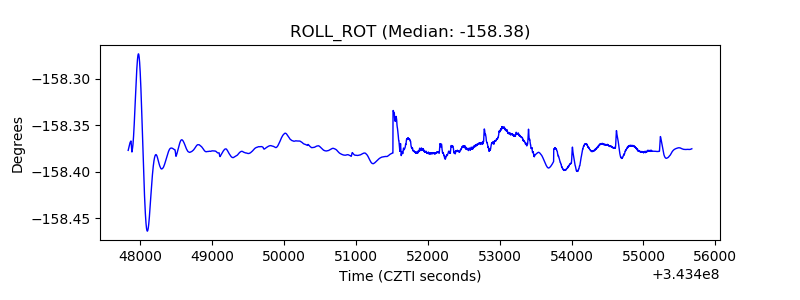 |
| _Roll_DEC | 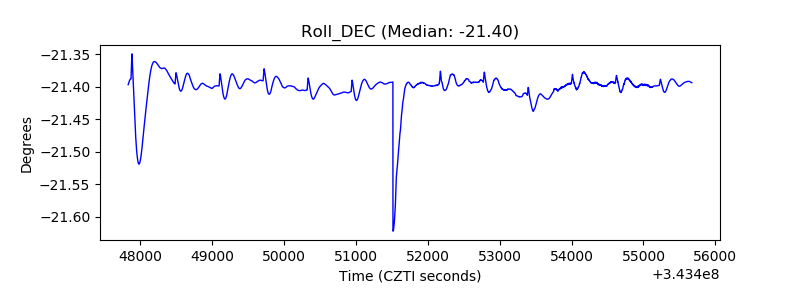 |
| _Roll_RA |  |
| Veto Counter | 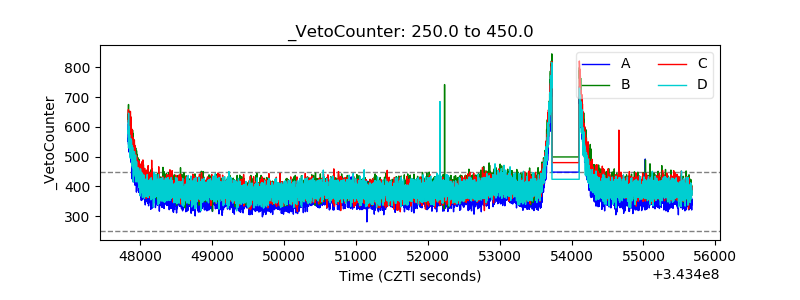 |