| Param | Original file | Final file |
|---|---|---|
| Filename | modeM0/AS1A10_048T08_9000004020_27814cztM0_level2.evt | modeM0/AS1A10_048T08_9000004020_27814cztM0_level2_quad_clean.evt |
| Size (bytes) | 851,071,680 | 148,343,040 |
| Size | 811.6 MB | 141.5 MB |
| Events in quadrant A | 5,266,196 | 949,303 |
| Events in quadrant B | 6,279,732 | 951,713 |
| Events in quadrant C | 6,353,385 | 913,789 |
| Events in quadrant D | 7,111,100 | 895,864 |
| Mode M0 | |||
|---|---|---|---|
| Quadrant | BADHDUFLAG | Total packets | Discarded packets |
| A | 0 | 23112 | 0 |
| B | 0 | 25868 | 0 |
| C | 0 | 26020 | 0 |
| D | 0 | 28845 | 0 |
| Mode M9 | |||
|---|---|---|---|
| Quadrant | BADHDUFLAG | Total packets | Discarded packets |
| A | 0 | 9 | 0 |
| B | 0 | 9 | 0 |
| C | 0 | 9 | 0 |
| D | 0 | 9 | 0 |
| Quadrant | Total seconds | Saturated seconds | Saturation percentage |
|---|---|---|---|
| A | 11294 | 133 | 1.177616% |
| B | 11294 | 238 | 2.107314% |
| C | 11294 | 221 | 1.956791% |
| D | 11294 | 371 | 3.284930% |
Noise dominated data is calculated using 1-second bins in cleaned event files. If a bin has >2000 counts, and if more than 50% of those come from <1% of pixels, then it is considered to be noise-dominated and hence unusable.
| Quadrant | # 1 sec bins | Bins with >0 counts | Bins with >2000 counts | High rate bins dominated by noise | Noise dominated (total time) | Noise dominated (detector-on time) | Marked lightcurve |
|---|---|---|---|---|---|---|---|
| A | 12234 | 11294 | 0 | 0 | 0.00% | 0.00% | 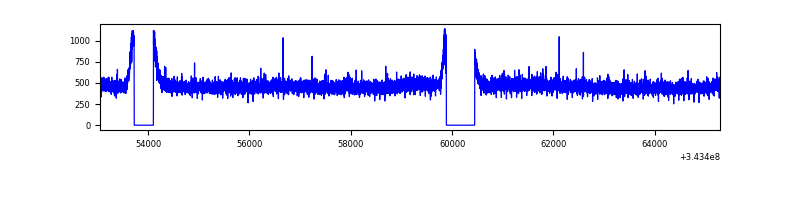 |
| B | 12234 | 11294 | 44 | 44 | 0.36% | 0.39% | 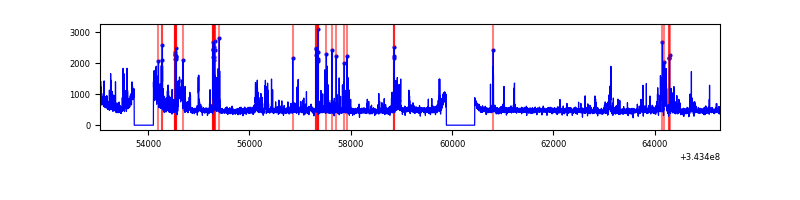 |
| C | 12234 | 11294 | 13 | 13 | 0.11% | 0.12% | 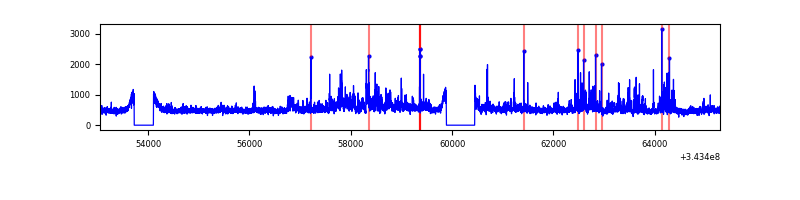 |
| D | 12234 | 11294 | 256 | 256 | 2.09% | 2.27% | 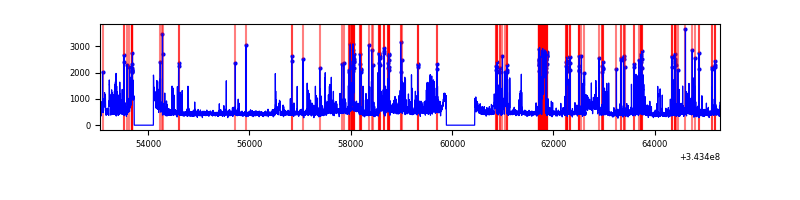 |
Top three noisy pixels from each quadrant. If the there are fewer than three noisy pixels in the level2.evt file, extra rows are filled as -1
| Pixel properties | Quadrant properties | ||||||
|---|---|---|---|---|---|---|---|
| Quadrant | DetID | PixID | Counts | Sigma | Mean | Median | Sigma |
| A | 13 | 254 | 18685 | 63.02 | 1365 | 1336 | 275.3 |
| A | 3 | 137 | 13399 | 43.82 | 1365 | 1336 | 275.3 |
| A | 0 | 226 | 11579 | 37.21 | 1365 | 1336 | 275.3 |
| B | 10 | 245 | 764529 | 2925.11 | 1349 | 1315 | 260.9 |
| B | 10 | 246 | 92339 | 348.86 | 1349 | 1315 | 260.9 |
| B | 0 | 190 | 47593 | 177.37 | 1349 | 1315 | 260.9 |
| C | 3 | 233 | 1050392 | 3409.42 | 1299 | 1305 | 307.7 |
| C | 14 | 238 | 205510 | 663.64 | 1299 | 1305 | 307.7 |
| C | 15 | 208 | 28956 | 89.86 | 1299 | 1305 | 307.7 |
| D | 1 | 52 | 1810960 | 5762.33 | 1307 | 1273 | 314.1 |
| D | 2 | 250 | 144187 | 455.06 | 1307 | 1273 | 314.1 |
| D | 12 | 233 | 72054 | 225.38 | 1307 | 1273 | 314.1 |
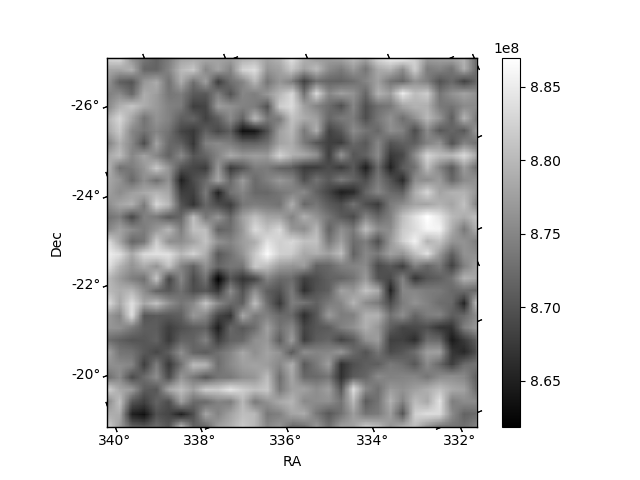
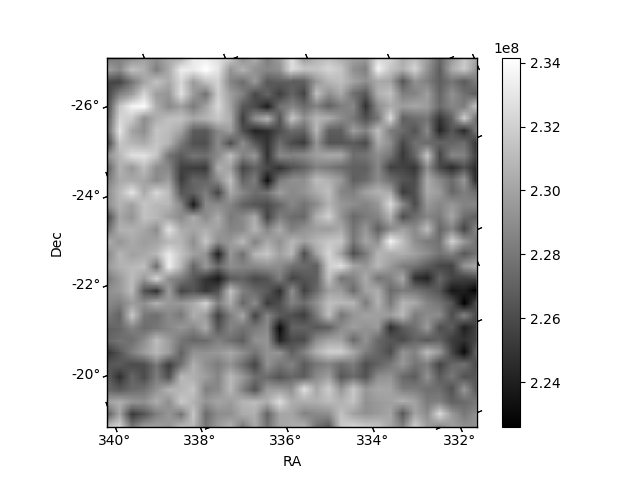
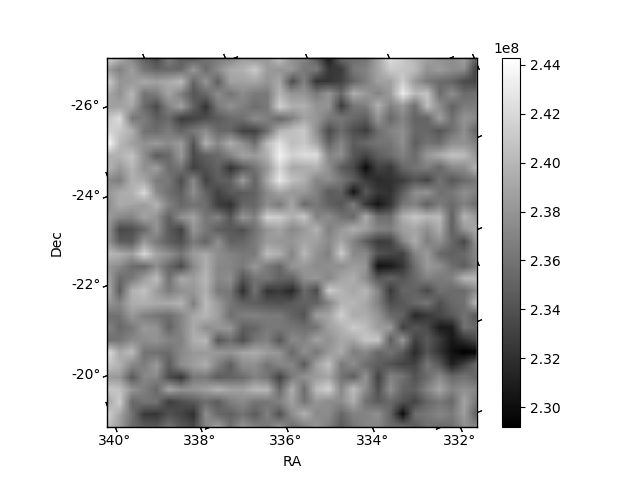
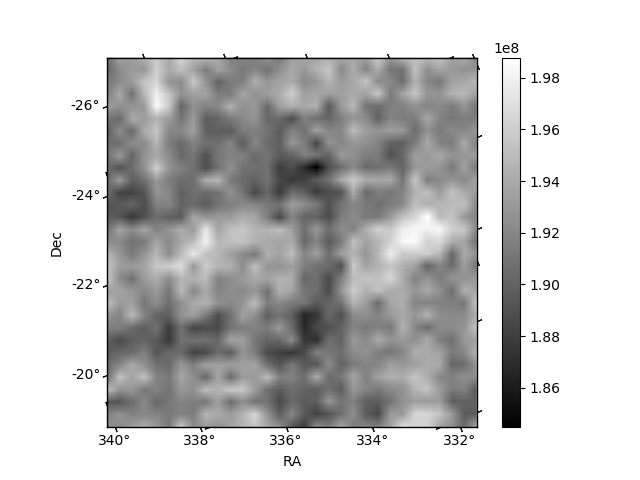
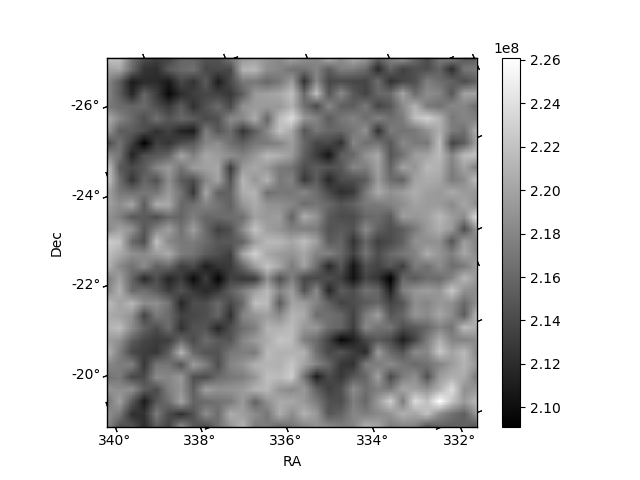
Histogram calculated using DETX and DETY for each event in the final _common_clean file
| Quadrant A | 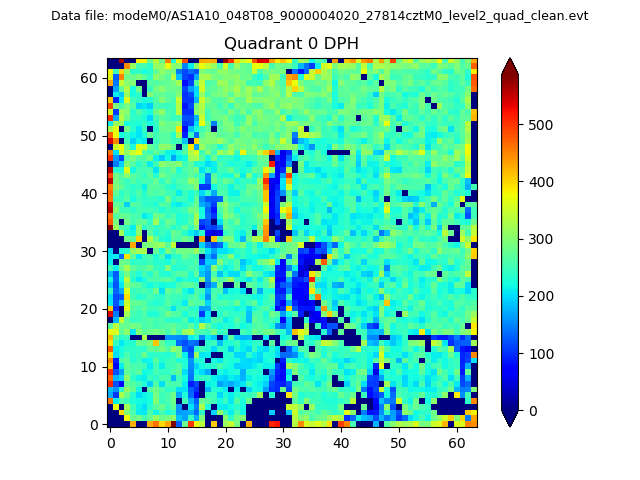 |
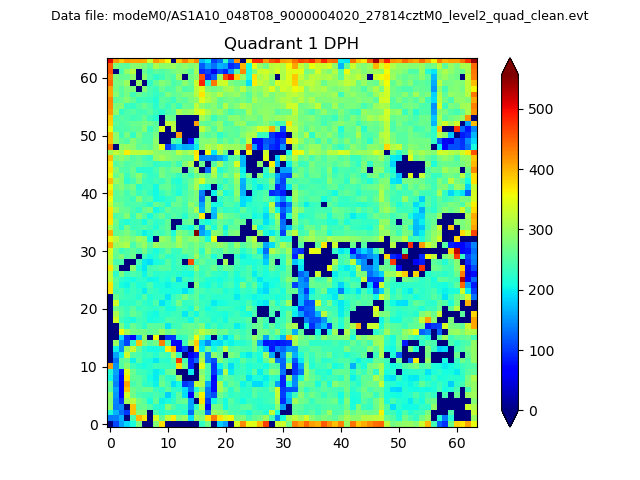 |
Quadrant B |
|---|---|---|---|
| Quadrant D | 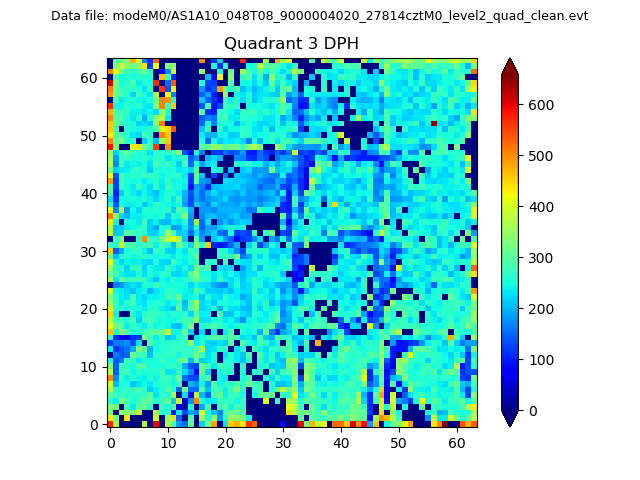 |
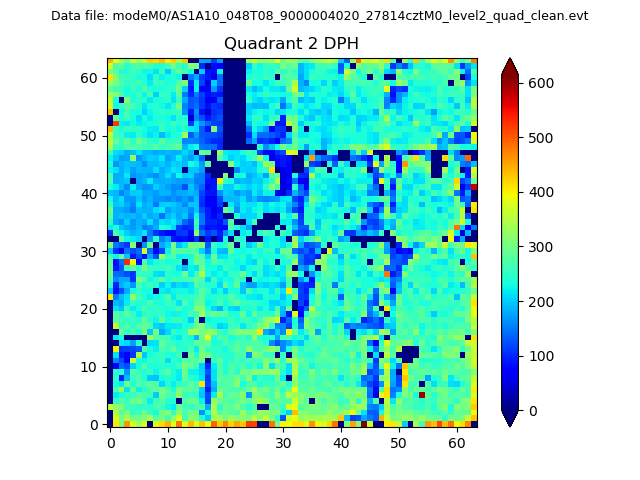 |
Quadrant C |
| Plot type | Count rate plots | Images |
|---|---|---|
| Comparison with Poisson distribution Blue bars denote a histogram of data divided into 1 sec bins. Red curve is a Poisson curve with rate = median count rate of data. |
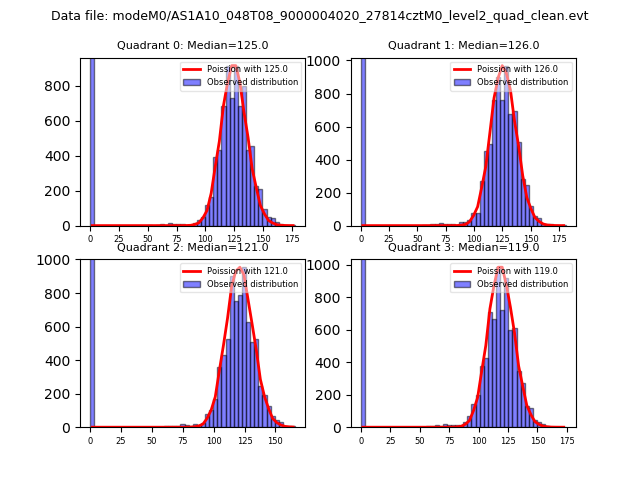 |
 |
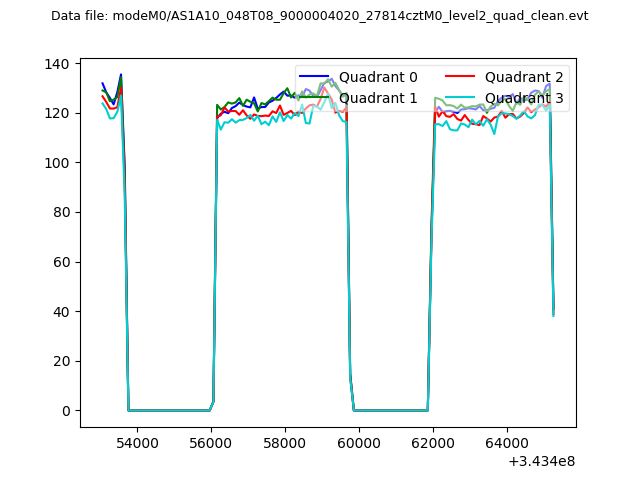
| Quadrant-wise count rates Data is divided into 100 sec bins |
 |
|
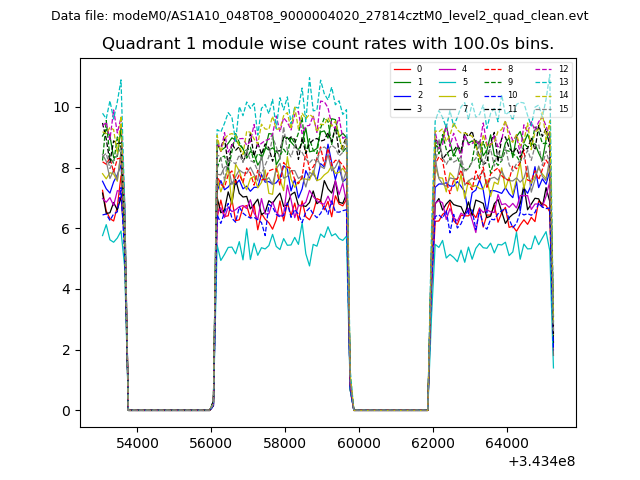
| Module-wise count rates for Quadrant A Data is divided into 100 sec bins |
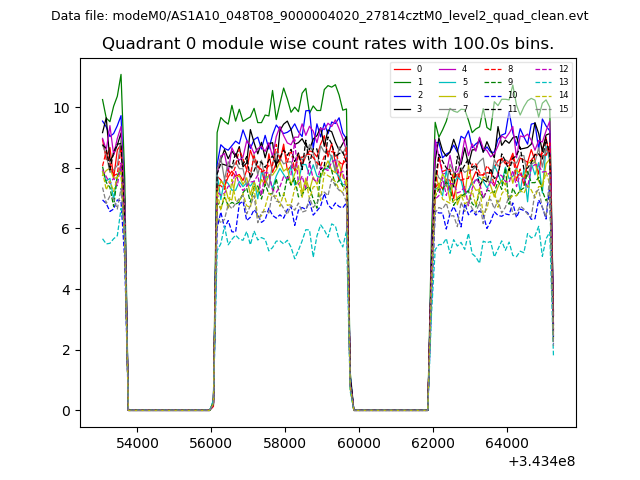 |
 |
| Module-wise count rates for Quadrant B Data is divided into 100 sec bins |
 |
 |
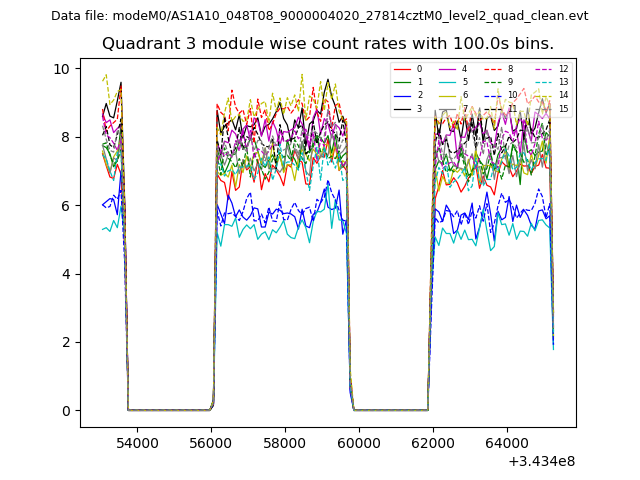
| Module-wise count rates for Quadrant C Data is divided into 100 sec bins |
 |
 |
| Module-wise count rates for Quadrant D Data is divided into 100 sec bins |
 |
 |
| Parameter | Plot |
|---|---|
| CZT HV Monitor | 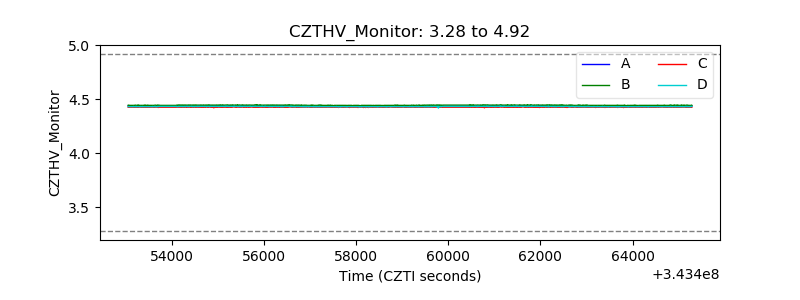 |
| D_VDD |  |
| Temperature 1 | 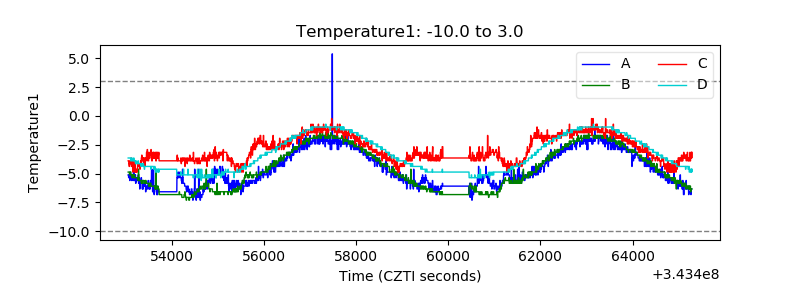 |
| Veto HV Monitor | 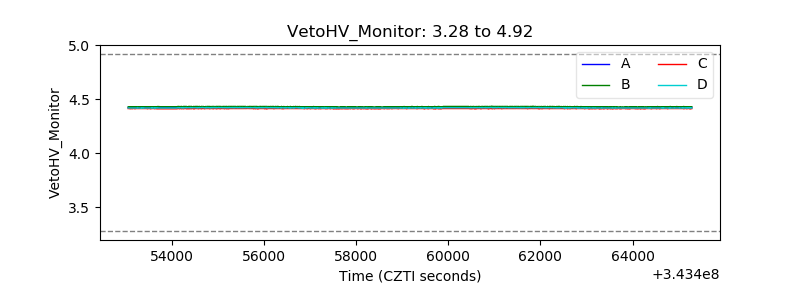 |
| Veto LLD | 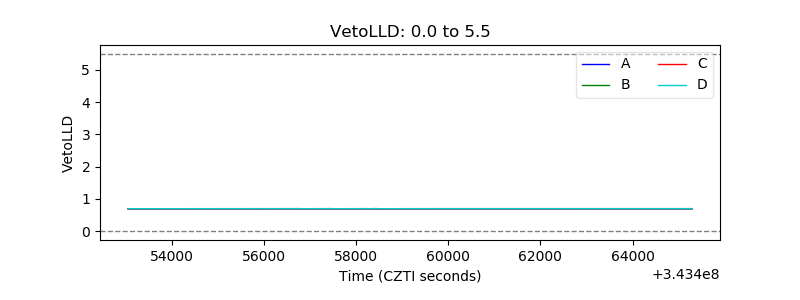 |
| Alpha Counter | 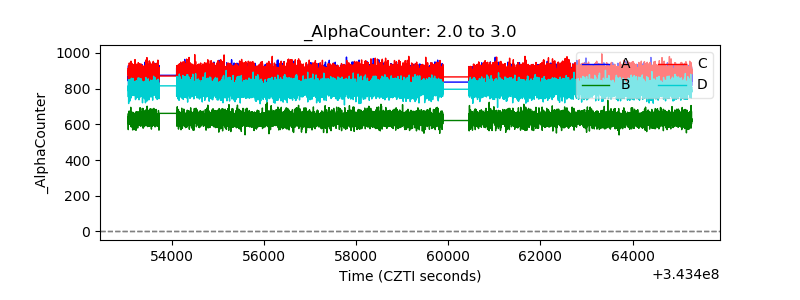 |
| _CPM_Rate | 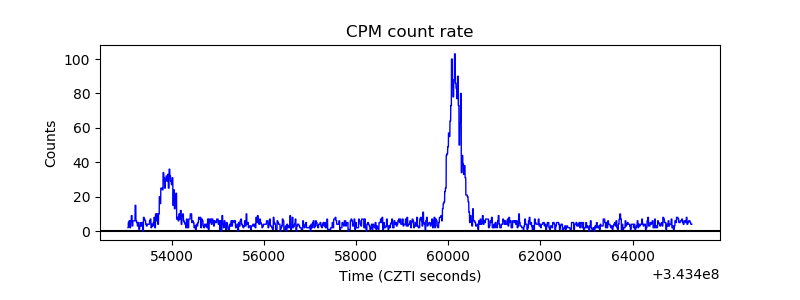 |
| CZT Counter | 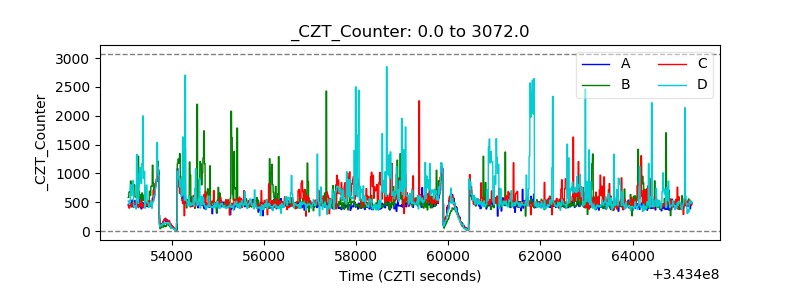 |
| +2.5 Volts monitor |  |
| +5 Volts monitor |  |
| _ROLL_ROT | 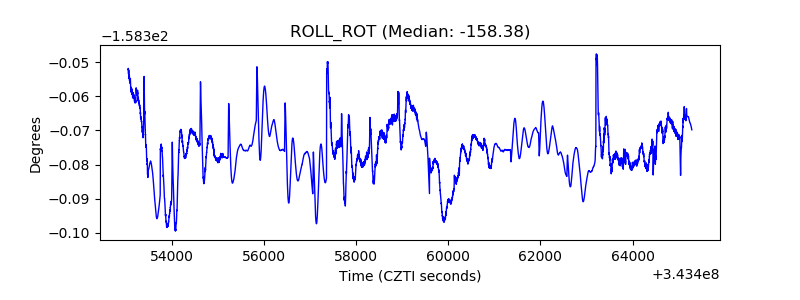 |
| _Roll_DEC | 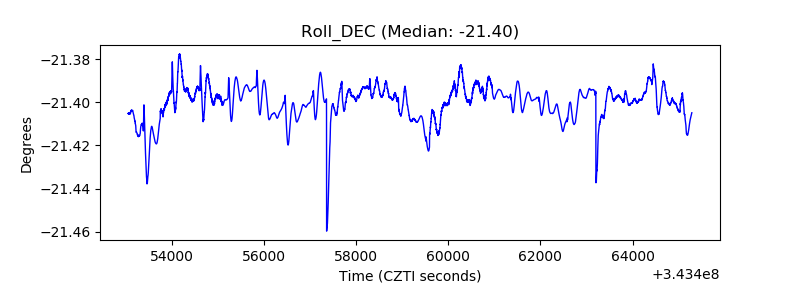 |
| _Roll_RA | 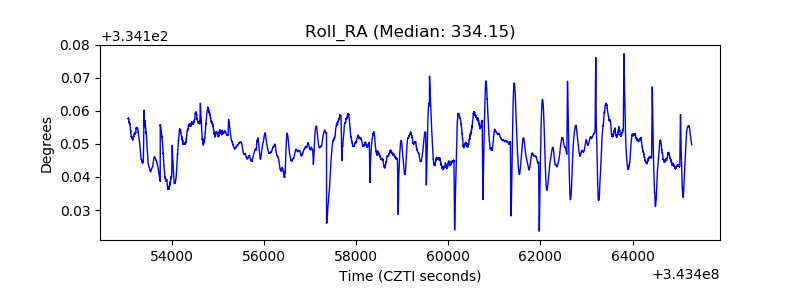 |
| Veto Counter | 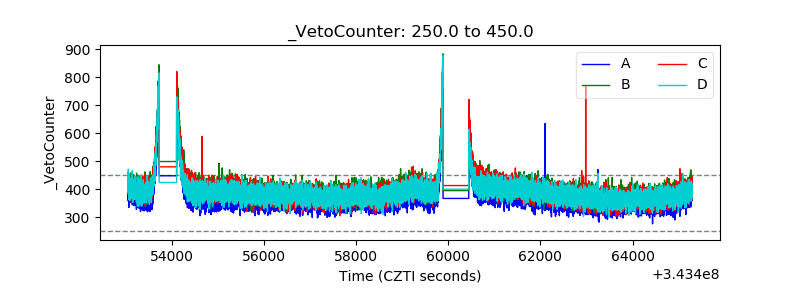 |