| Param | Original file | Final file |
|---|---|---|
| Filename | modeM0/AS1A10_048T08_9000004020_27815cztM0_level2.evt | modeM0/AS1A10_048T08_9000004020_27815cztM0_level2_quad_clean.evt |
| Size (bytes) | 701,478,720 | 121,259,520 |
| Size | 669.0 MB | 115.6 MB |
| Events in quadrant A | 4,317,506 | 787,549 |
| Events in quadrant B | 5,468,370 | 774,350 |
| Events in quadrant C | 4,873,999 | 752,803 |
| Events in quadrant D | 5,972,933 | 731,030 |
| Mode M0 | |||
|---|---|---|---|
| Quadrant | BADHDUFLAG | Total packets | Discarded packets |
| A | 0 | 18558 | 0 |
| B | 0 | 21829 | 0 |
| C | 0 | 20109 | 0 |
| D | 0 | 23565 | 0 |
| Mode M9 | |||
|---|---|---|---|
| Quadrant | BADHDUFLAG | Total packets | Discarded packets |
| A | 0 | 16 | 0 |
| B | 0 | 16 | 0 |
| C | 0 | 16 | 0 |
| D | 0 | 16 | 0 |
| Quadrant | Total seconds | Saturated seconds | Saturation percentage |
|---|---|---|---|
| A | 9033 | 88 | 0.974206% |
| B | 9033 | 373 | 4.129304% |
| C | 9033 | 222 | 2.457655% |
| D | 9032 | 403 | 4.461913% |
Noise dominated data is calculated using 1-second bins in cleaned event files. If a bin has >2000 counts, and if more than 50% of those come from <1% of pixels, then it is considered to be noise-dominated and hence unusable.
| Quadrant | # 1 sec bins | Bins with >0 counts | Bins with >2000 counts | High rate bins dominated by noise | Noise dominated (total time) | Noise dominated (detector-on time) | Marked lightcurve |
|---|---|---|---|---|---|---|---|
| A | 10638 | 9033 | 0 | 0 | 0.00% | 0.00% | 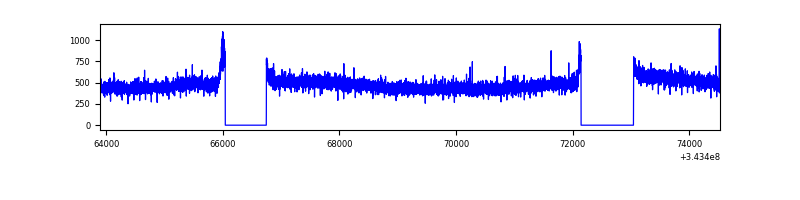 |
| B | 10638 | 9033 | 227 | 227 | 2.13% | 2.51% | 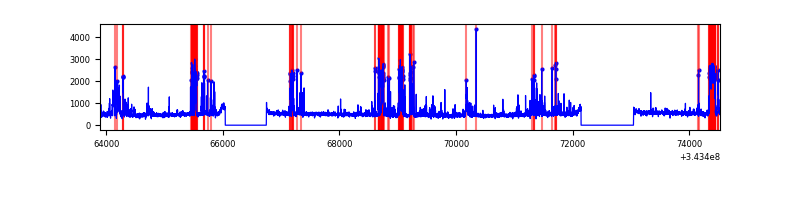 |
| C | 10638 | 9033 | 26 | 26 | 0.24% | 0.29% | 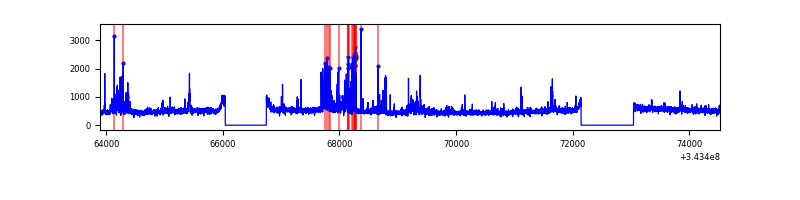 |
| D | 10637 | 9032 | 320 | 320 | 3.01% | 3.54% | 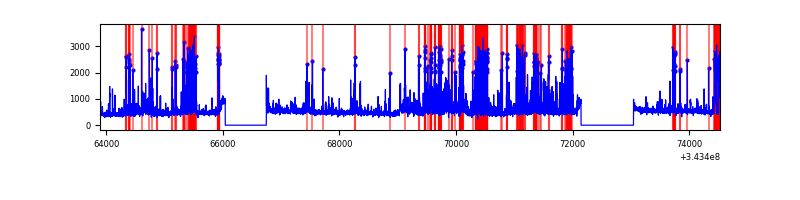 |
Top three noisy pixels from each quadrant. If the there are fewer than three noisy pixels in the level2.evt file, extra rows are filled as -1
| Pixel properties | Quadrant properties | ||||||
|---|---|---|---|---|---|---|---|
| Quadrant | DetID | PixID | Counts | Sigma | Mean | Median | Sigma |
| A | 13 | 254 | 14626 | 59.6 | 1119 | 1094 | 227.0 |
| A | 3 | 137 | 10757 | 42.56 | 1119 | 1094 | 227.0 |
| A | 0 | 226 | 9503 | 37.04 | 1119 | 1094 | 227.0 |
| B | 10 | 245 | 985242 | 4633.06 | 1098 | 1068 | 212.4 |
| B | 15 | 32 | 83938 | 390.12 | 1098 | 1068 | 212.4 |
| B | 0 | 190 | 34447 | 157.13 | 1098 | 1068 | 212.4 |
| C | 3 | 233 | 347347 | 1379.93 | 1065 | 1074 | 250.9 |
| C | 15 | 208 | 203633 | 807.21 | 1065 | 1074 | 250.9 |
| C | 14 | 238 | 170110 | 673.62 | 1065 | 1074 | 250.9 |
| D | 1 | 52 | 1710033 | 6679.21 | 1068 | 1038 | 255.9 |
| D | 2 | 250 | 144773 | 561.75 | 1068 | 1038 | 255.9 |
| D | 2 | 234 | 39762 | 151.34 | 1068 | 1038 | 255.9 |
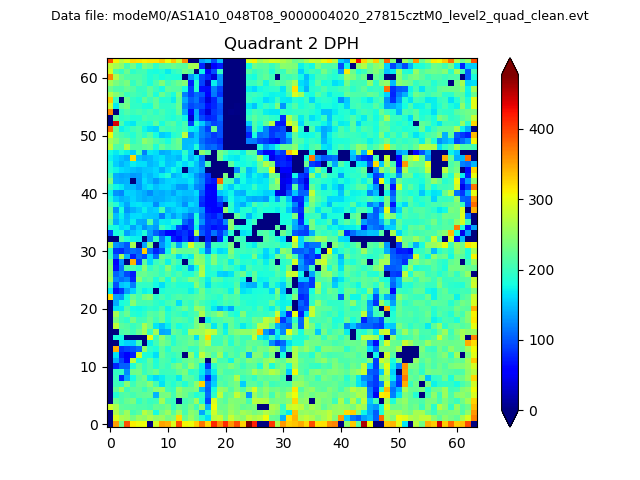
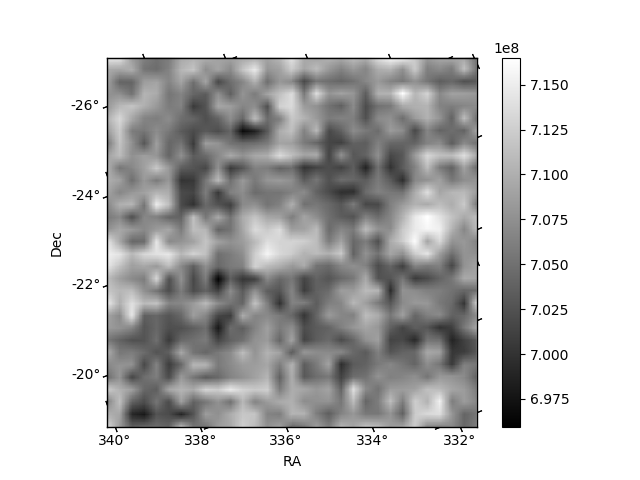
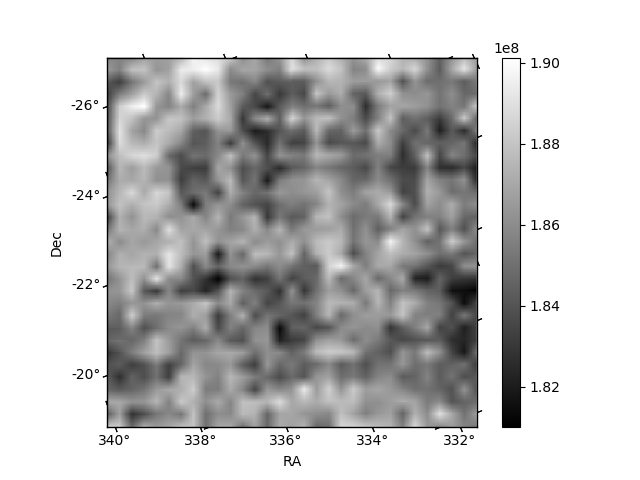
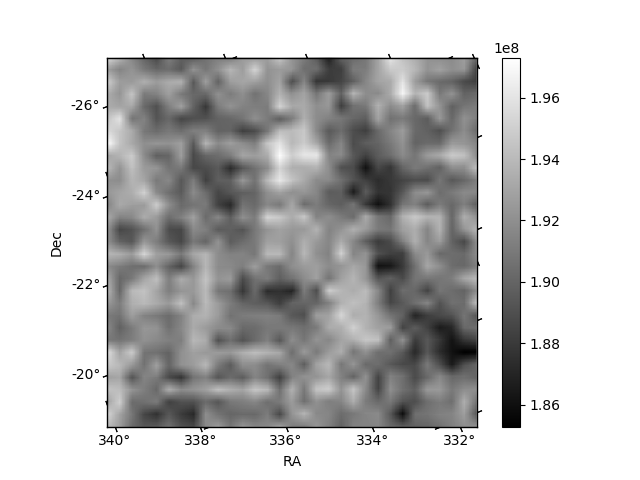
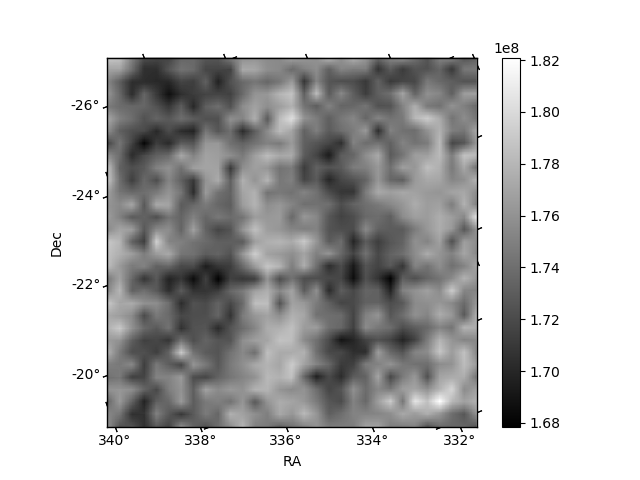
Histogram calculated using DETX and DETY for each event in the final _common_clean file
| Quadrant A | 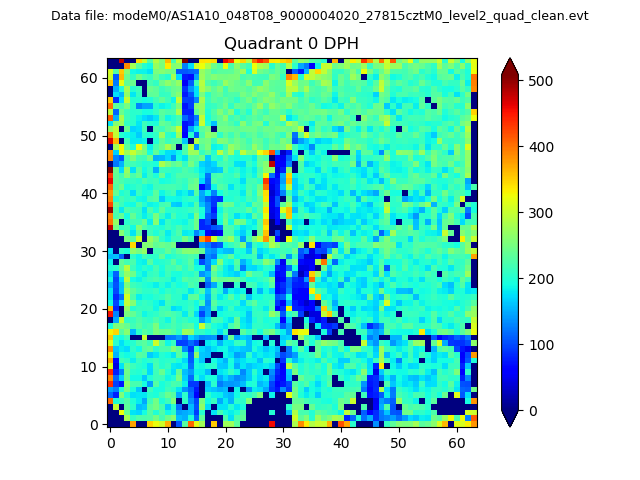 |
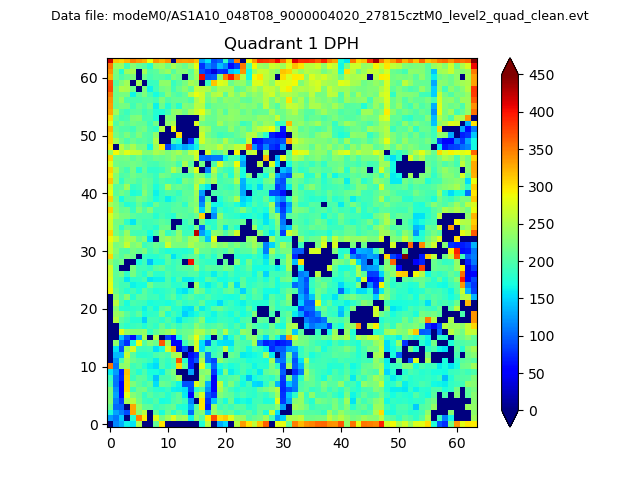 |
Quadrant B |
|---|---|---|---|
| Quadrant D | 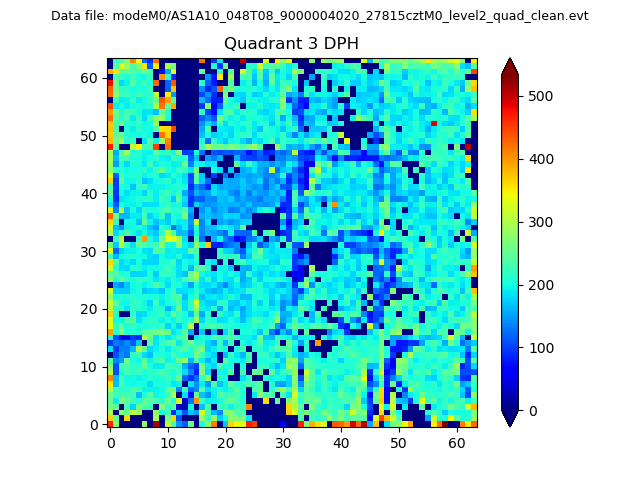 |
 |
Quadrant C |
| Plot type | Count rate plots | Images |
|---|---|---|
| Comparison with Poisson distribution Blue bars denote a histogram of data divided into 1 sec bins. Red curve is a Poisson curve with rate = median count rate of data. |
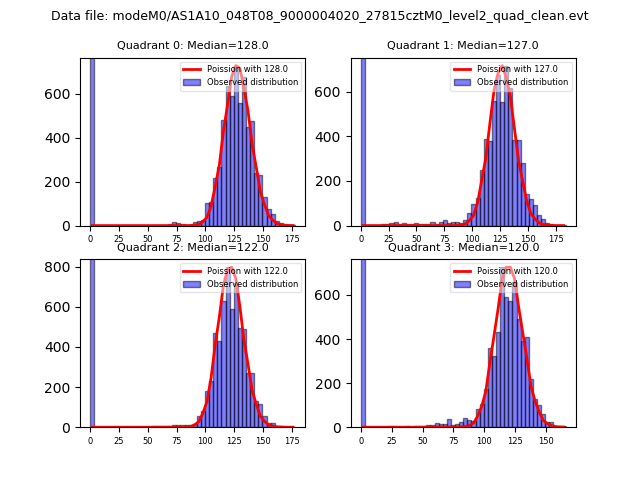 |
 |
| Quadrant-wise count rates Data is divided into 100 sec bins |
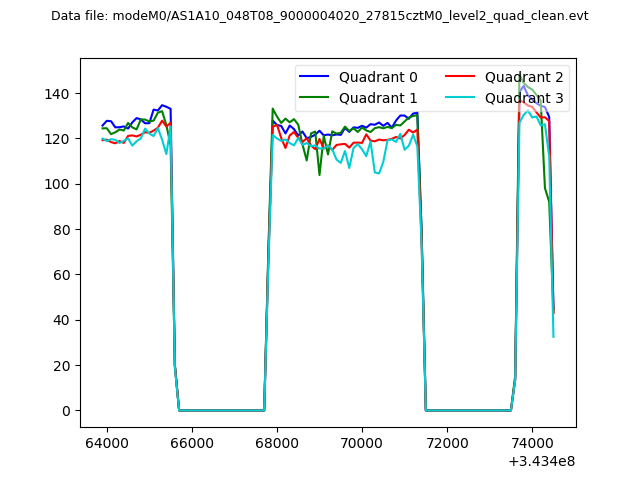 |
|
| Module-wise count rates for Quadrant A Data is divided into 100 sec bins |
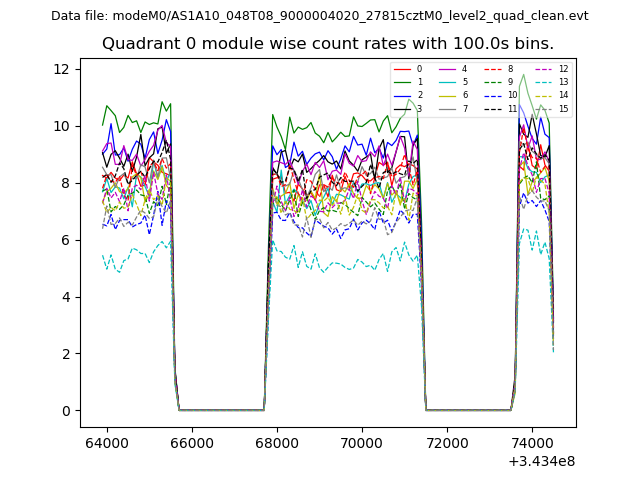 |
 |
| Module-wise count rates for Quadrant B Data is divided into 100 sec bins |
 |
 |
| Module-wise count rates for Quadrant C Data is divided into 100 sec bins |
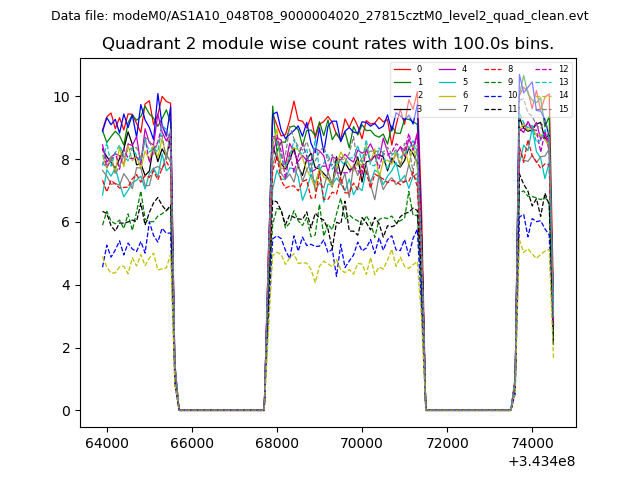 |
 |
| Module-wise count rates for Quadrant D Data is divided into 100 sec bins |
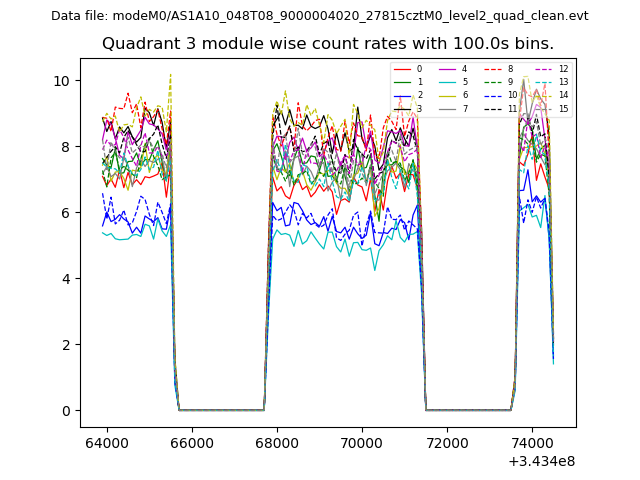 |
 |
| Parameter | Plot |
|---|---|
| CZT HV Monitor | 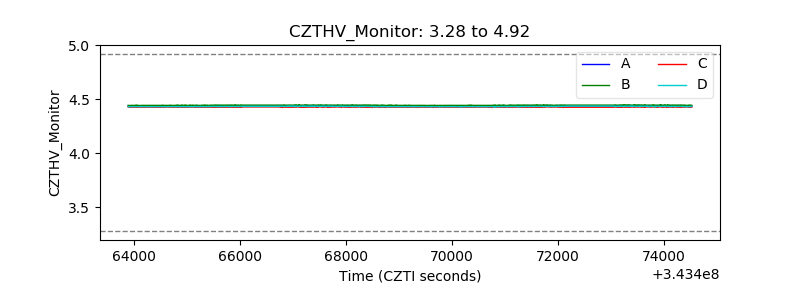 |
| D_VDD | 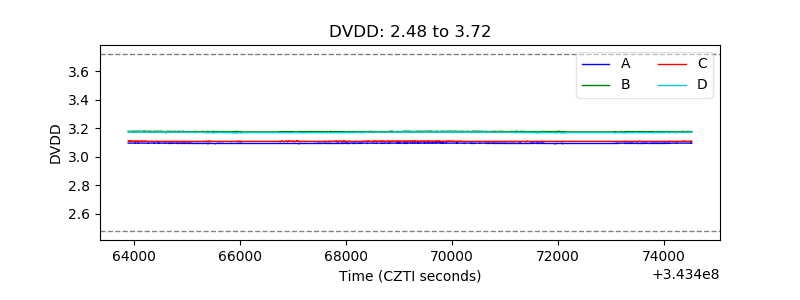 |
| Temperature 1 | 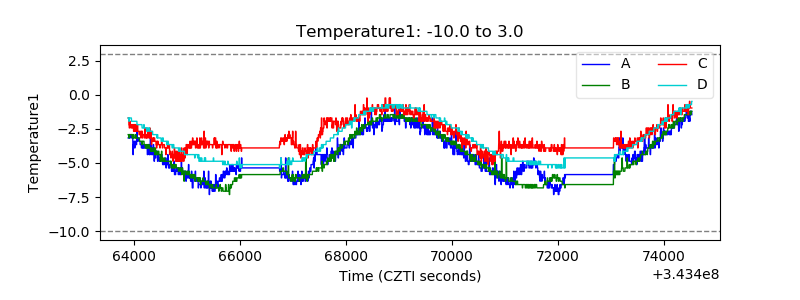 |
| Veto HV Monitor | 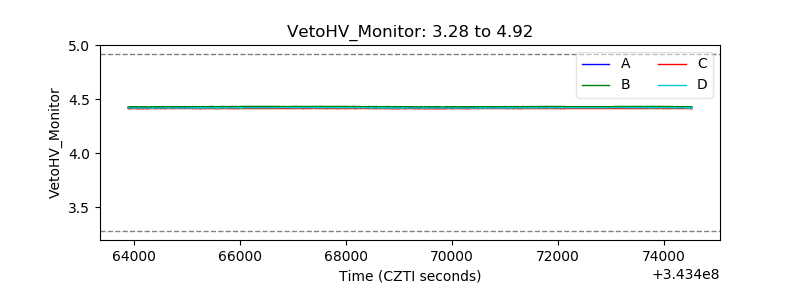 |
| Veto LLD | 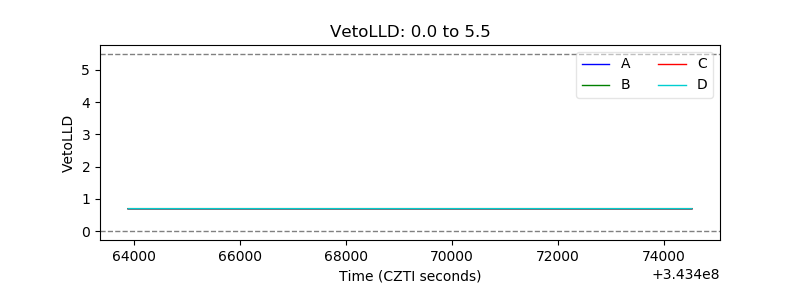 |
| Alpha Counter | 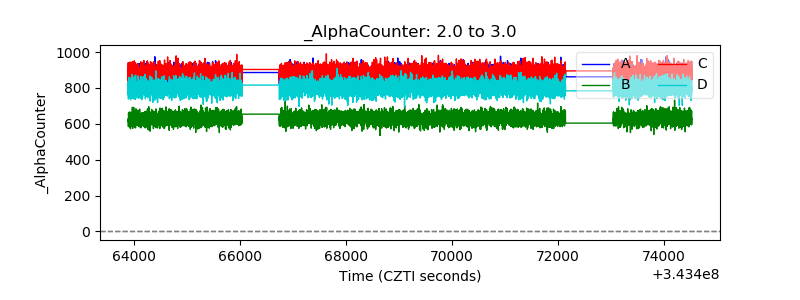 |
| _CPM_Rate | 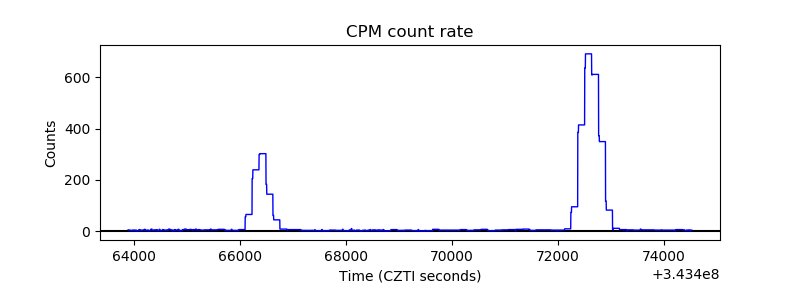 |
| CZT Counter | 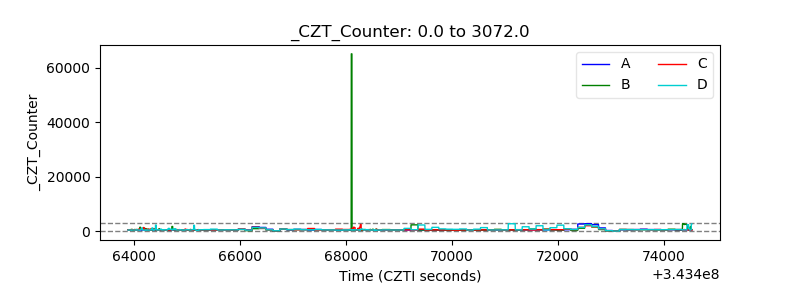 |
| +2.5 Volts monitor |  |
| +5 Volts monitor |  |
| _ROLL_ROT | 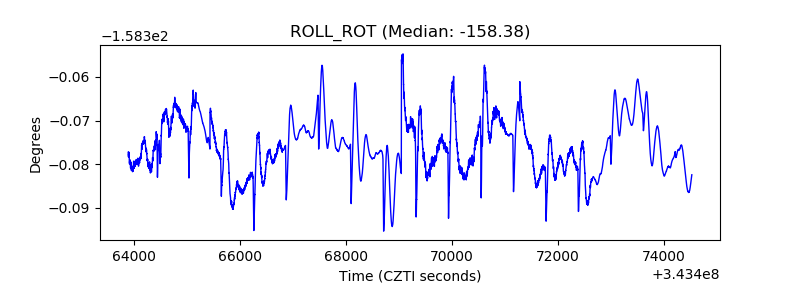 |
| _Roll_DEC | 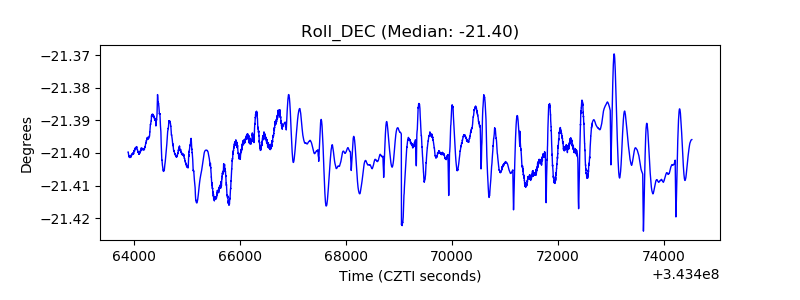 |
| _Roll_RA | 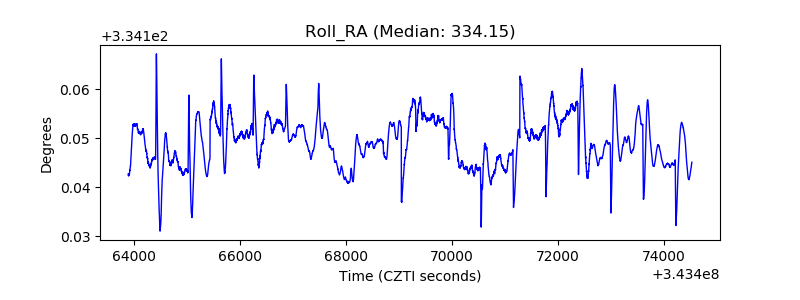 |
| Veto Counter | 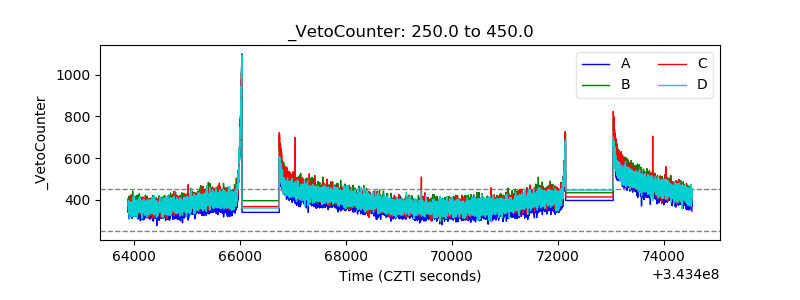 |