| Param | Original file | Final file |
|---|---|---|
| Filename | modeM0/AS1A10_048T08_9000004020_27816cztM0_level2.evt | modeM0/AS1A10_048T08_9000004020_27816cztM0_level2_quad_clean.evt |
| Size (bytes) | 453,427,200 | 93,859,200 |
| Size | 432.4 MB | 89.5 MB |
| Events in quadrant A | 2,926,631 | 629,031 |
| Events in quadrant B | 3,584,847 | 623,494 |
| Events in quadrant C | 2,917,401 | 599,144 |
| Events in quadrant D | 3,903,914 | 579,973 |
| Mode M0 | |||
|---|---|---|---|
| Quadrant | BADHDUFLAG | Total packets | Discarded packets |
| A | 0 | 12553 | 0 |
| B | 0 | 14486 | 0 |
| C | 0 | 12469 | 0 |
| D | 0 | 15504 | 0 |
| Mode M9 | |||
|---|---|---|---|
| Quadrant | BADHDUFLAG | Total packets | Discarded packets |
| A | 0 | 10 | 0 |
| B | 0 | 10 | 0 |
| C | 0 | 10 | 0 |
| D | 0 | 10 | 0 |
| Quadrant | Total seconds | Saturated seconds | Saturation percentage |
|---|---|---|---|
| A | 5875 | 64 | 1.089362% |
| B | 5875 | 230 | 3.914894% |
| C | 5875 | 92 | 1.565957% |
| D | 5875 | 280 | 4.765957% |
Noise dominated data is calculated using 1-second bins in cleaned event files. If a bin has >2000 counts, and if more than 50% of those come from <1% of pixels, then it is considered to be noise-dominated and hence unusable.
| Quadrant | # 1 sec bins | Bins with >0 counts | Bins with >2000 counts | High rate bins dominated by noise | Noise dominated (total time) | Noise dominated (detector-on time) | Marked lightcurve |
|---|---|---|---|---|---|---|---|
| A | 6885 | 5875 | 12 | 12 | 0.17% | 0.20% | 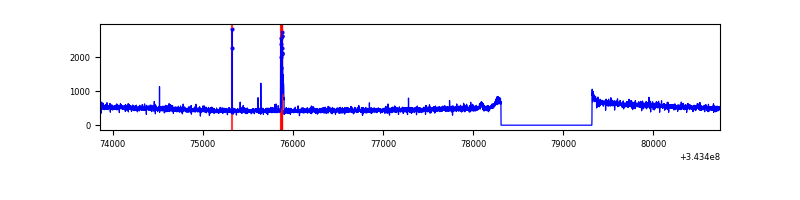 |
| B | 6885 | 5875 | 140 | 140 | 2.03% | 2.38% | 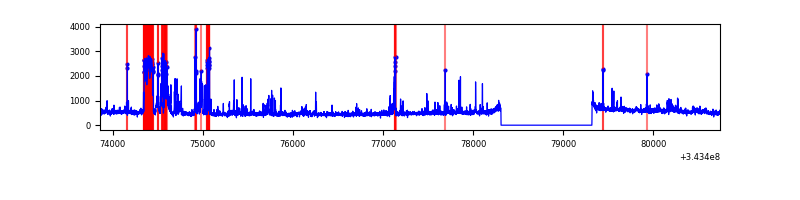 |
| C | 6885 | 5875 | 1 | 1 | 0.01% | 0.02% | 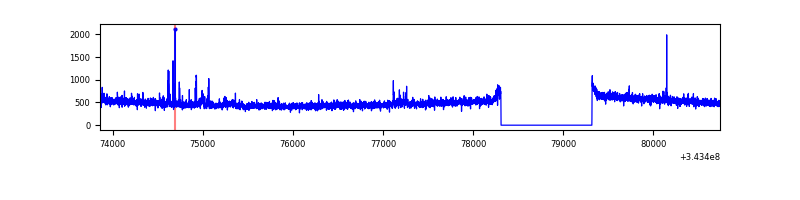 |
| D | 6885 | 5875 | 262 | 262 | 3.81% | 4.46% | 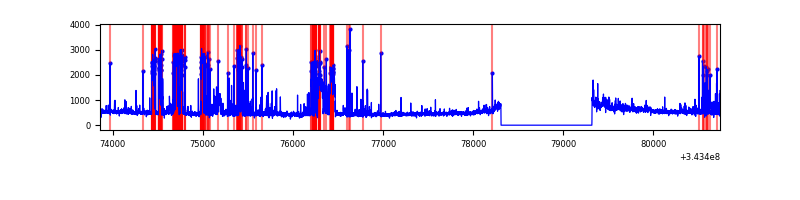 |
Top three noisy pixels from each quadrant. If the there are fewer than three noisy pixels in the level2.evt file, extra rows are filled as -1
| Pixel properties | Quadrant properties | ||||||
|---|---|---|---|---|---|---|---|
| Quadrant | DetID | PixID | Counts | Sigma | Mean | Median | Sigma |
| A | 13 | 248 | 51597 | 336.49 | 745 | 731 | 151.2 |
| A | 13 | 254 | 9104 | 55.39 | 745 | 731 | 151.2 |
| A | 3 | 137 | 6938 | 41.06 | 745 | 731 | 151.2 |
| B | 10 | 245 | 579712 | 4196.4 | 722 | 706 | 138.0 |
| B | 3 | 64 | 51990 | 371.69 | 722 | 706 | 138.0 |
| B | 15 | 32 | 45676 | 325.92 | 722 | 706 | 138.0 |
| C | 14 | 238 | 112460 | 680.21 | 697 | 701 | 164.3 |
| C | 3 | 233 | 58692 | 352.95 | 697 | 701 | 164.3 |
| C | 15 | 208 | 27801 | 164.94 | 697 | 701 | 164.3 |
| D | 1 | 52 | 1101790 | 6463.7 | 705 | 687 | 170.4 |
| D | 2 | 250 | 56969 | 330.39 | 705 | 687 | 170.4 |
| D | 12 | 233 | 42916 | 247.89 | 705 | 687 | 170.4 |
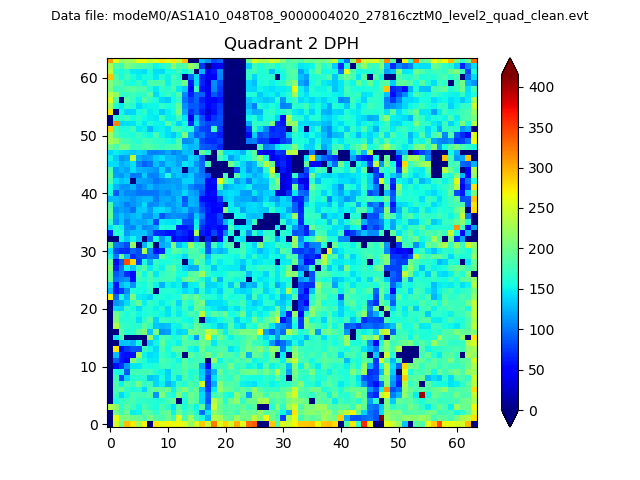
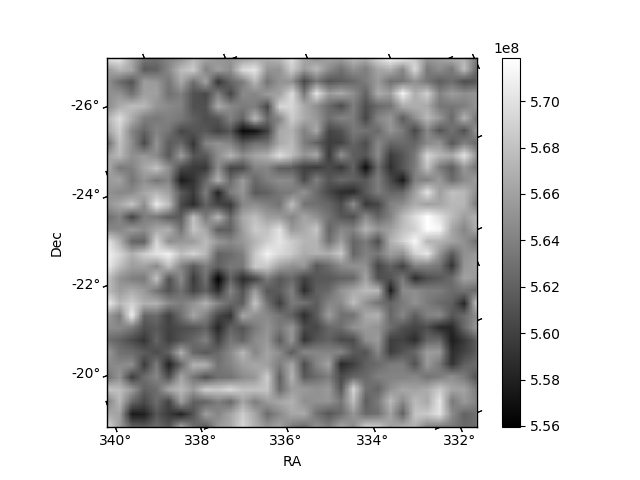
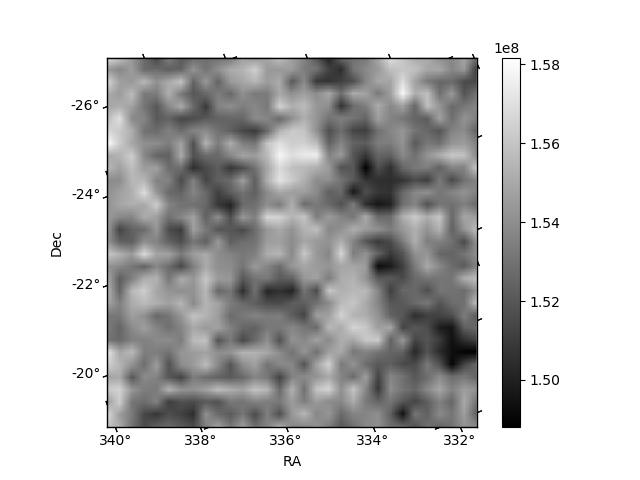
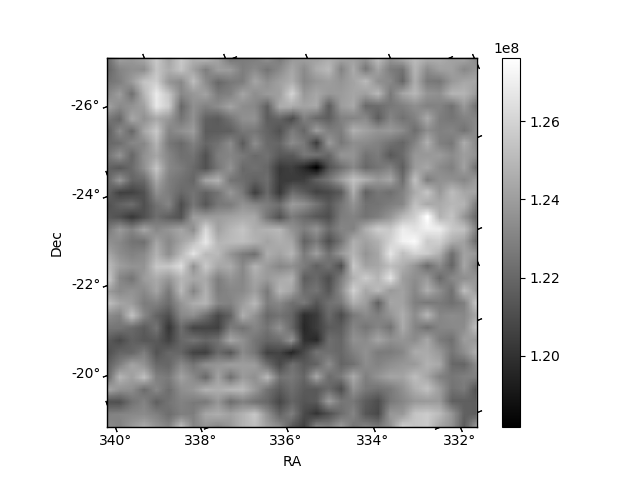
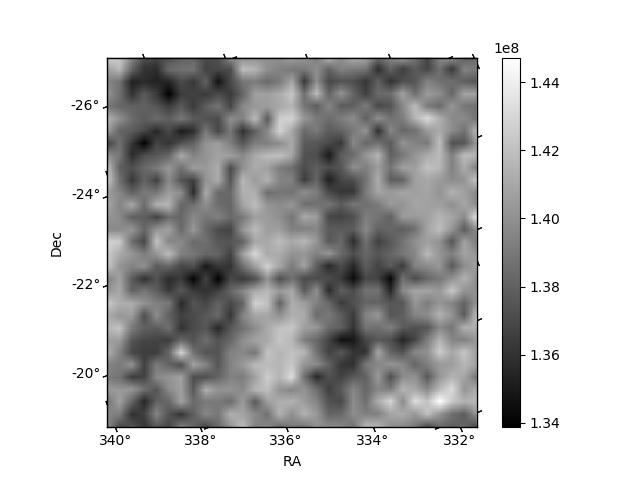
Histogram calculated using DETX and DETY for each event in the final _common_clean file
| Quadrant A | 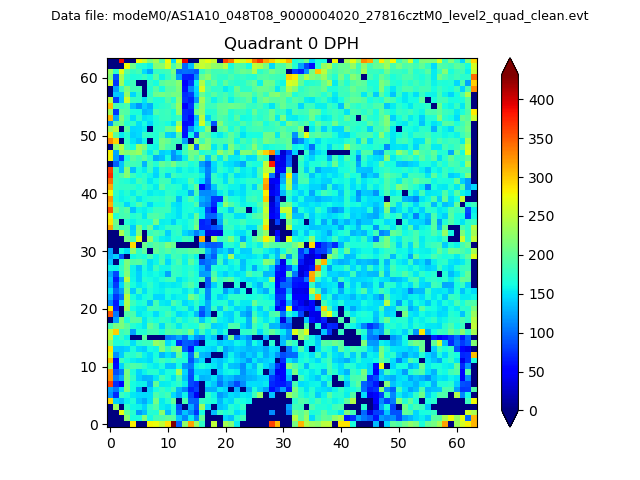 |
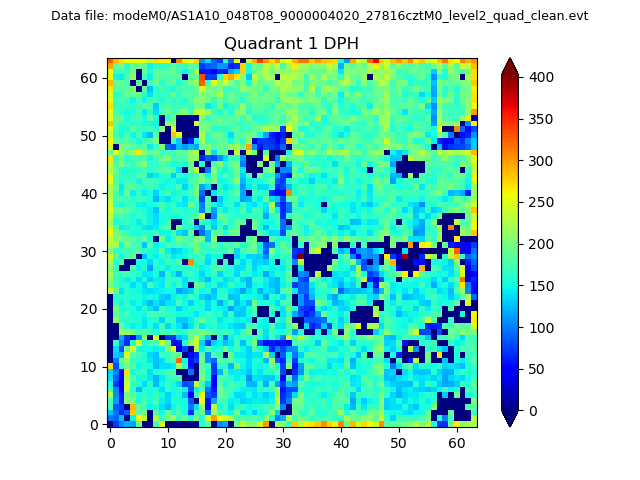 |
Quadrant B |
|---|---|---|---|
| Quadrant D | 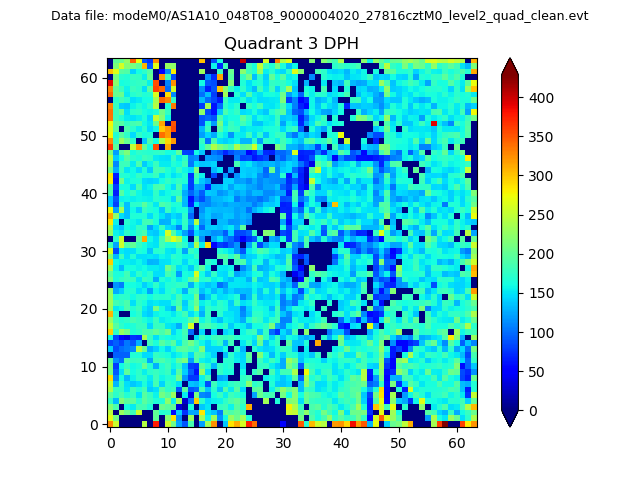 |
 |
Quadrant C |
| Plot type | Count rate plots | Images |
|---|---|---|
| Comparison with Poisson distribution Blue bars denote a histogram of data divided into 1 sec bins. Red curve is a Poisson curve with rate = median count rate of data. |
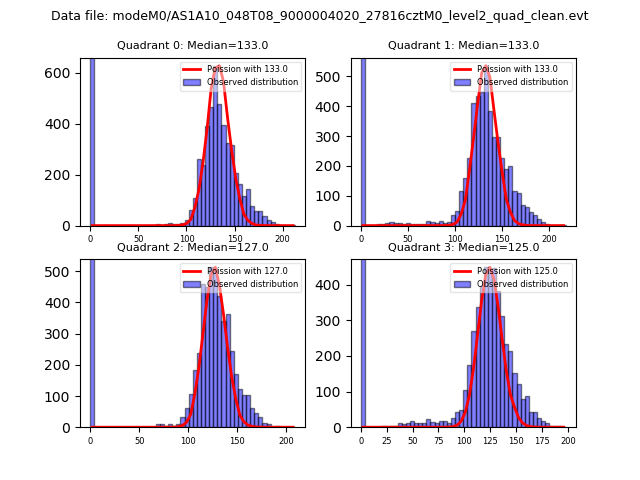 |
 |
| Quadrant-wise count rates Data is divided into 100 sec bins |
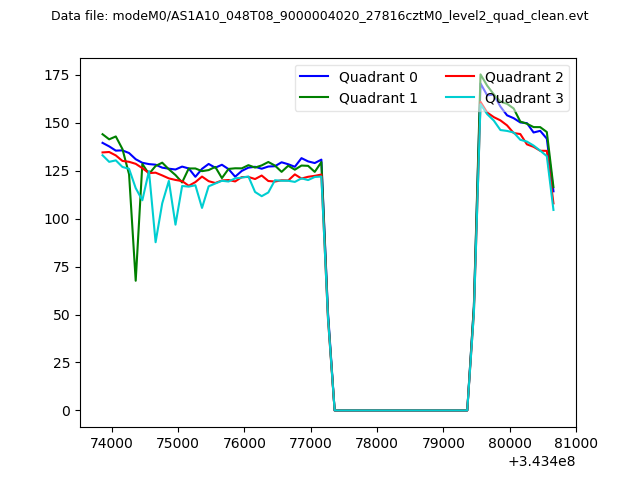 |
|
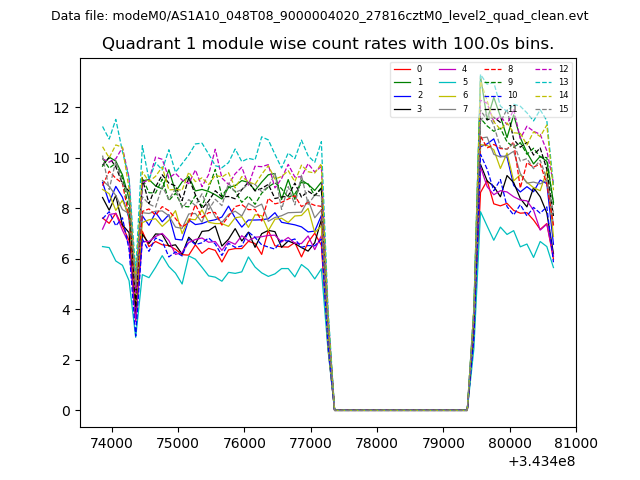
| Module-wise count rates for Quadrant A Data is divided into 100 sec bins |
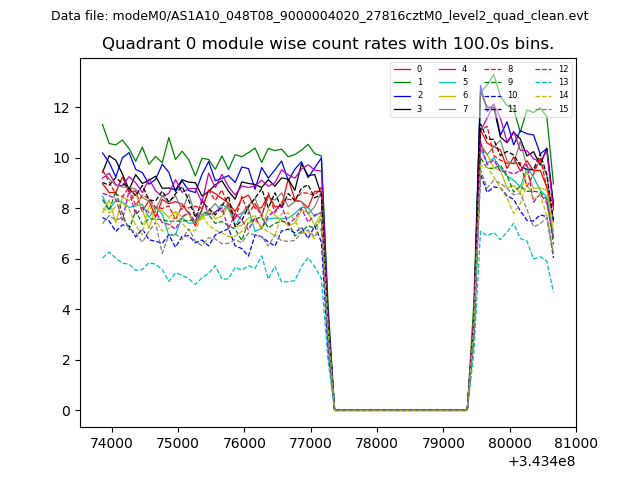 |
 |
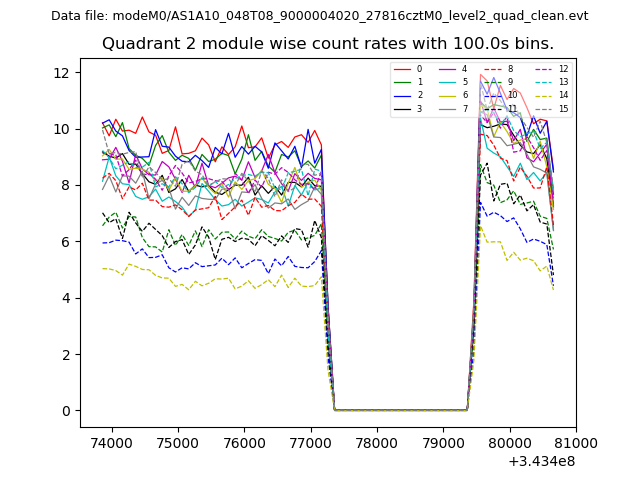
| Module-wise count rates for Quadrant B Data is divided into 100 sec bins |
 |
 |
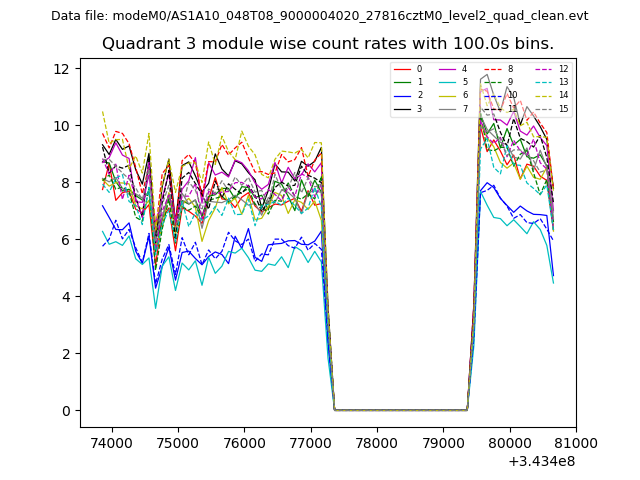
| Module-wise count rates for Quadrant C Data is divided into 100 sec bins |
 |
 |
| Module-wise count rates for Quadrant D Data is divided into 100 sec bins |
 |
 |
| Parameter | Plot |
|---|---|
| CZT HV Monitor | 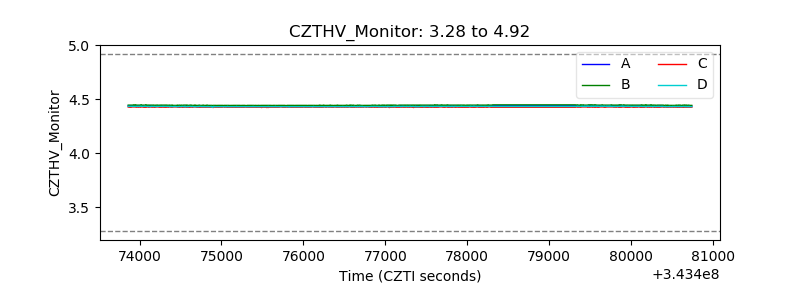 |
| D_VDD | 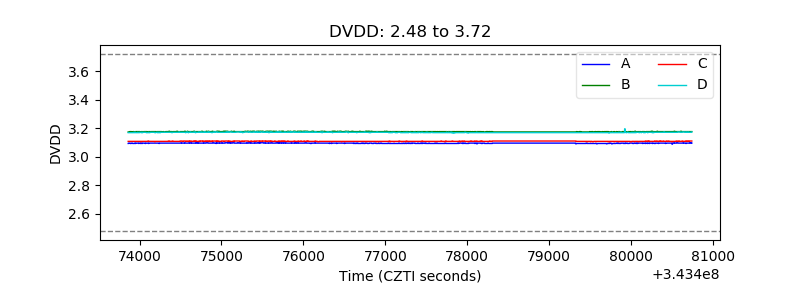 |
| Temperature 1 |  |
| Veto HV Monitor |  |
| Veto LLD | 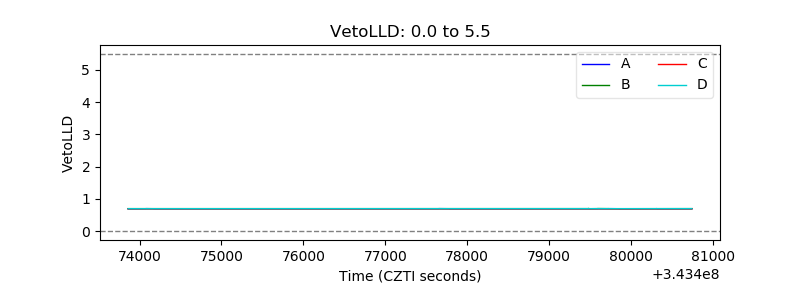 |
| Alpha Counter | 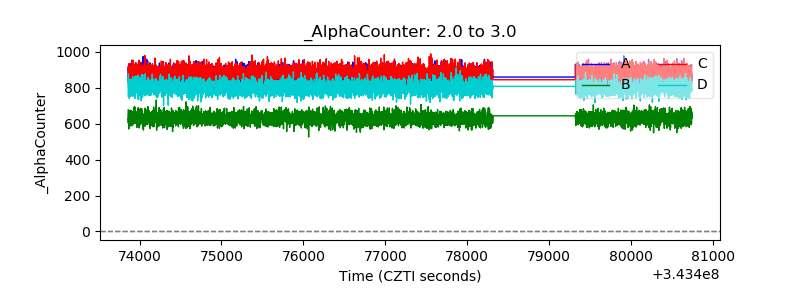 |
| _CPM_Rate | 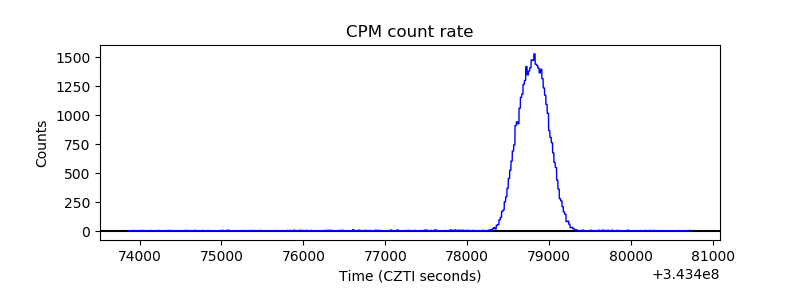 |
| CZT Counter | 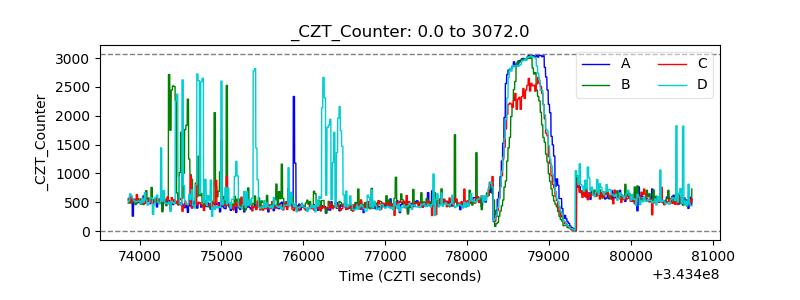 |
| +2.5 Volts monitor |  |
| +5 Volts monitor |  |
| _ROLL_ROT | 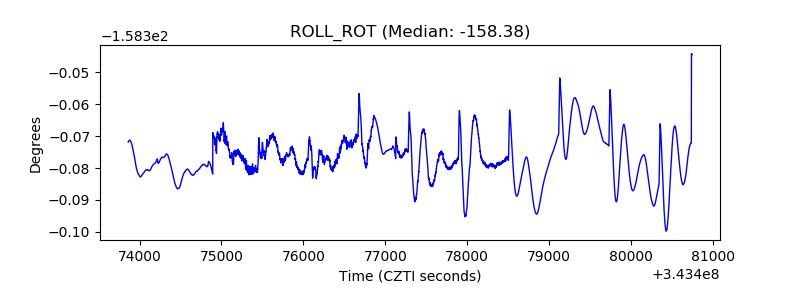 |
| _Roll_DEC |  |
| _Roll_RA | 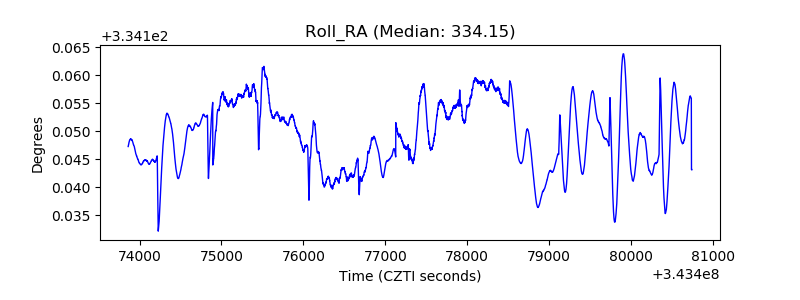 |
| Veto Counter | 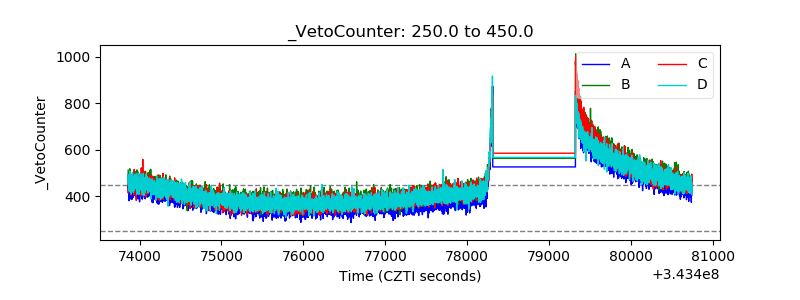 |