| Param | Original file | Final file |
|---|---|---|
| Filename | modeM0/AS1A10_048T08_9000004020_27818cztM0_level2.evt | modeM0/AS1A10_048T08_9000004020_27818cztM0_level2_quad_clean.evt |
| Size (bytes) | 441,509,760 | 100,088,640 |
| Size | 421.1 MB | 95.5 MB |
| Events in quadrant A | 3,030,919 | 674,944 |
| Events in quadrant B | 3,185,948 | 682,414 |
| Events in quadrant C | 2,981,173 | 638,629 |
| Events in quadrant D | 3,771,215 | 621,981 |
| Mode M0 | |||
|---|---|---|---|
| Quadrant | BADHDUFLAG | Total packets | Discarded packets |
| A | 0 | 12883 | 0 |
| B | 0 | 13328 | 0 |
| C | 0 | 12651 | 0 |
| D | 0 | 15104 | 0 |
| Mode M9 | |||
|---|---|---|---|
| Quadrant | BADHDUFLAG | Total packets | Discarded packets |
| A | 0 | 12 | 0 |
| B | 0 | 12 | 0 |
| C | 0 | 12 | 0 |
| D | 0 | 12 | 0 |
| Quadrant | Total seconds | Saturated seconds | Saturation percentage |
|---|---|---|---|
| A | 5923 | 87 | 1.468850% |
| B | 5924 | 69 | 1.164754% |
| C | 5924 | 92 | 1.553005% |
| D | 5924 | 187 | 3.156651% |
Noise dominated data is calculated using 1-second bins in cleaned event files. If a bin has >2000 counts, and if more than 50% of those come from <1% of pixels, then it is considered to be noise-dominated and hence unusable.
| Quadrant | # 1 sec bins | Bins with >0 counts | Bins with >2000 counts | High rate bins dominated by noise | Noise dominated (total time) | Noise dominated (detector-on time) | Marked lightcurve |
|---|---|---|---|---|---|---|---|
| A | 7058 | 5923 | 22 | 22 | 0.31% | 0.37% | 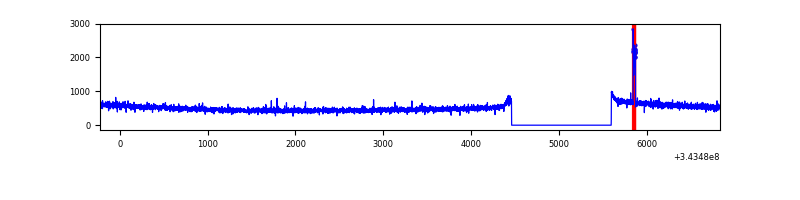 |
| B | 7059 | 5924 | 6 | 6 | 0.08% | 0.10% | 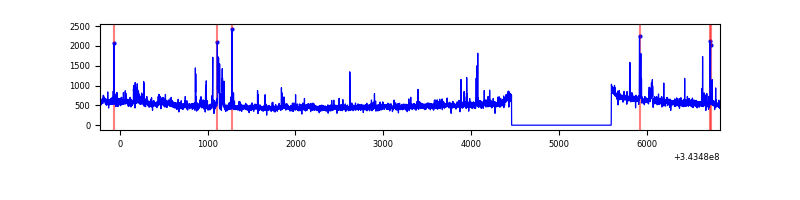 |
| C | 7059 | 5924 | 0 | 0 | 0.00% | 0.00% | 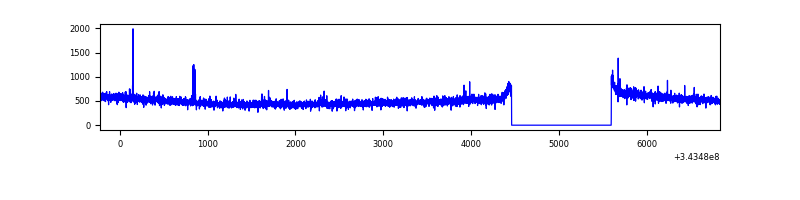 |
| D | 7059 | 5924 | 152 | 152 | 2.15% | 2.57% | 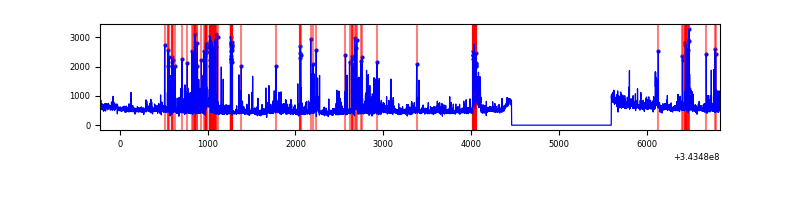 |
Top three noisy pixels from each quadrant. If the there are fewer than three noisy pixels in the level2.evt file, extra rows are filled as -1
| Pixel properties | Quadrant properties | ||||||
|---|---|---|---|---|---|---|---|
| Quadrant | DetID | PixID | Counts | Sigma | Mean | Median | Sigma |
| A | 6 | 16 | 46652 | 295.74 | 773 | 759 | 155.2 |
| A | 13 | 254 | 9251 | 54.72 | 773 | 759 | 155.2 |
| A | 3 | 137 | 7085 | 40.77 | 773 | 759 | 155.2 |
| B | 10 | 245 | 144634 | 994.36 | 762 | 745 | 144.7 |
| B | 12 | 111 | 17488 | 115.7 | 762 | 745 | 144.7 |
| B | 15 | 32 | 15886 | 104.63 | 762 | 745 | 144.7 |
| C | 14 | 238 | 118435 | 694.3 | 724 | 730 | 169.5 |
| C | 3 | 233 | 30289 | 174.36 | 724 | 730 | 169.5 |
| C | 15 | 208 | 13896 | 77.66 | 724 | 730 | 169.5 |
| D | 1 | 52 | 892159 | 5107.0 | 731 | 711 | 174.6 |
| D | 2 | 250 | 50054 | 282.68 | 731 | 711 | 174.6 |
| D | 2 | 234 | 28697 | 160.33 | 731 | 711 | 174.6 |
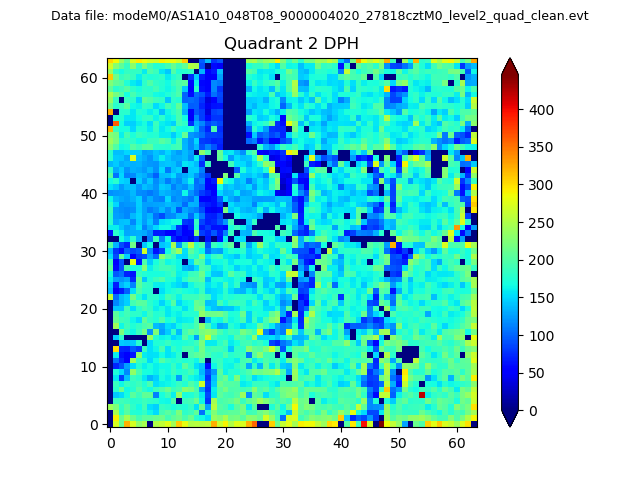
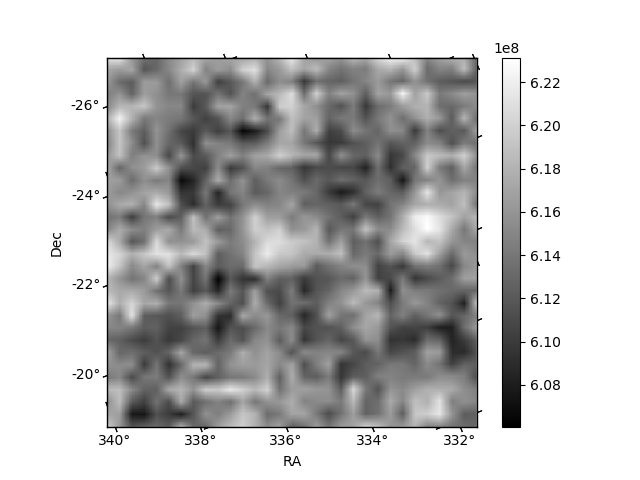
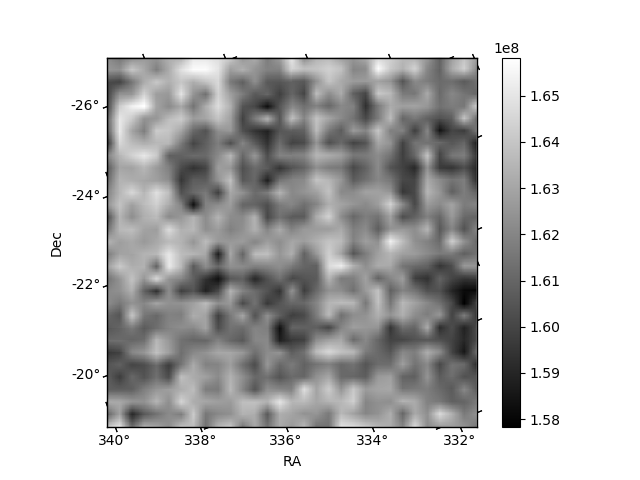
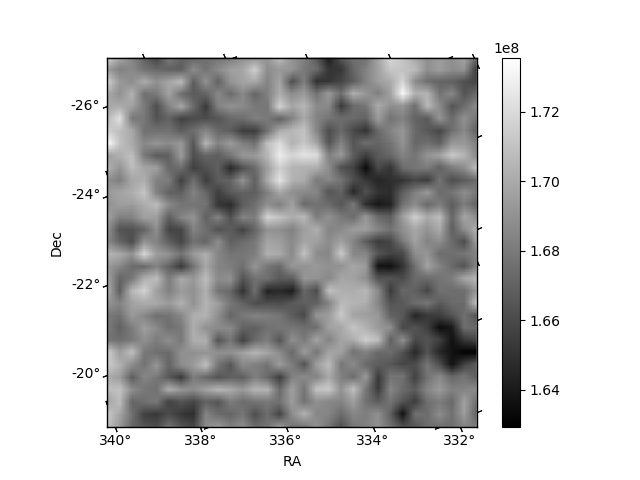
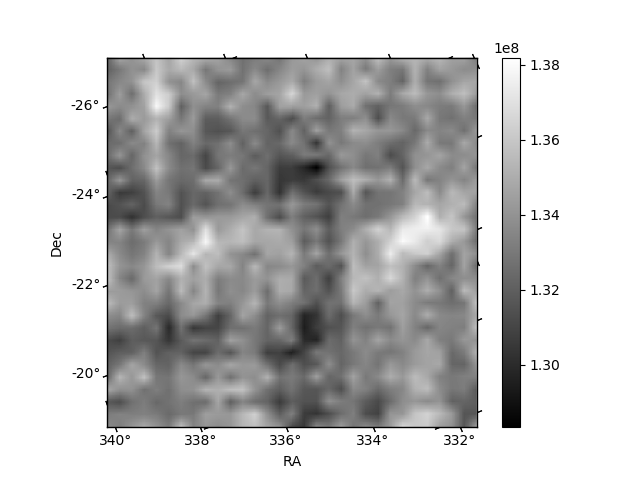
Histogram calculated using DETX and DETY for each event in the final _common_clean file
| Quadrant A | 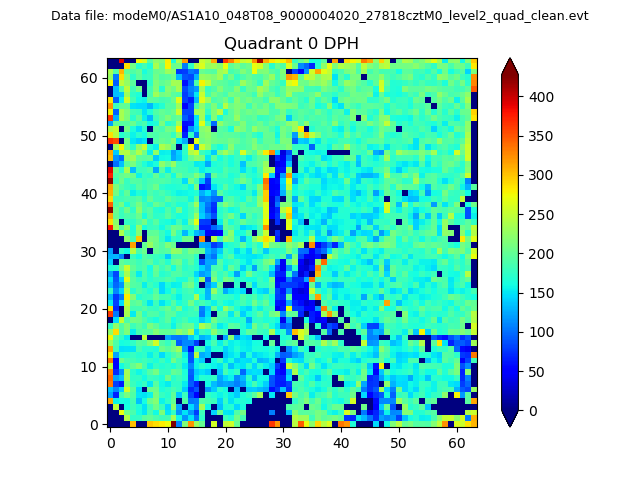 |
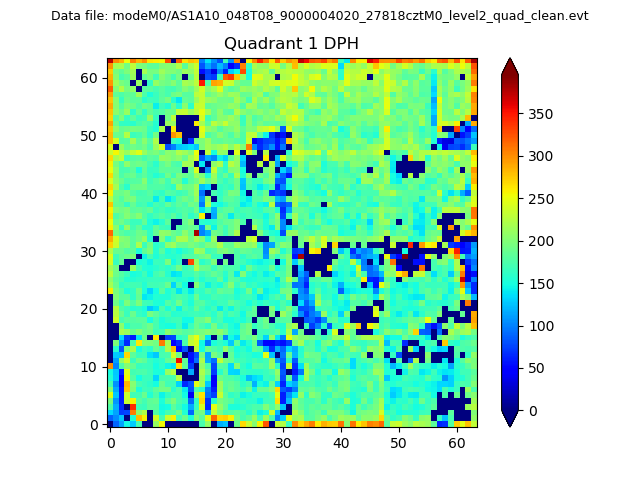 |
Quadrant B |
|---|---|---|---|
| Quadrant D | 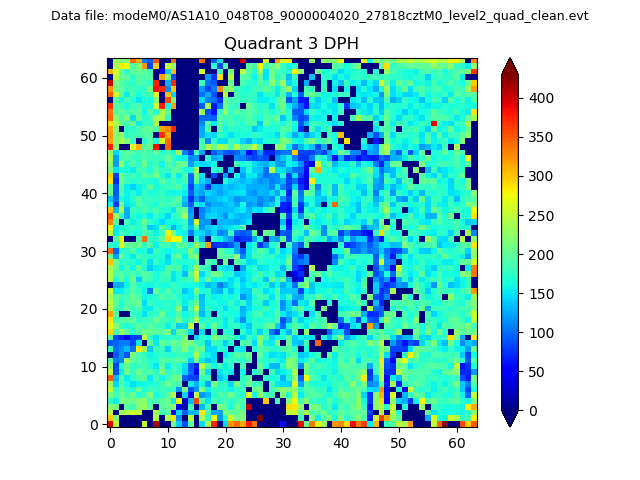 |
 |
Quadrant C |
| Plot type | Count rate plots | Images |
|---|---|---|
| Comparison with Poisson distribution Blue bars denote a histogram of data divided into 1 sec bins. Red curve is a Poisson curve with rate = median count rate of data. |
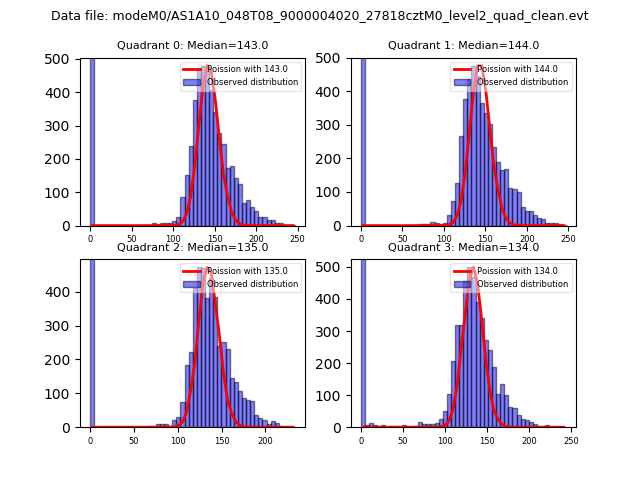 |
 |
| Quadrant-wise count rates Data is divided into 100 sec bins |
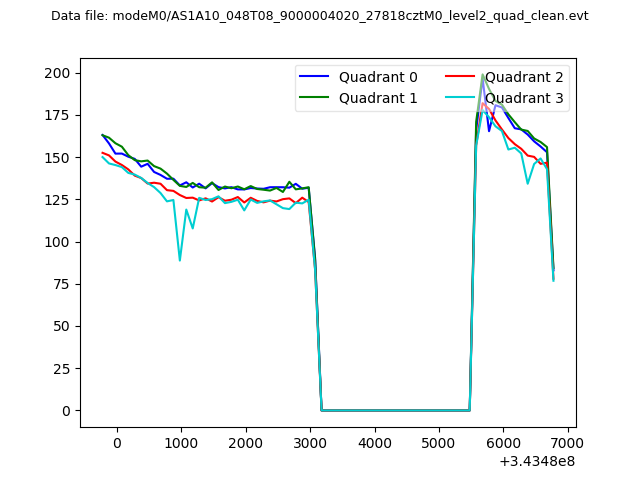 |
|
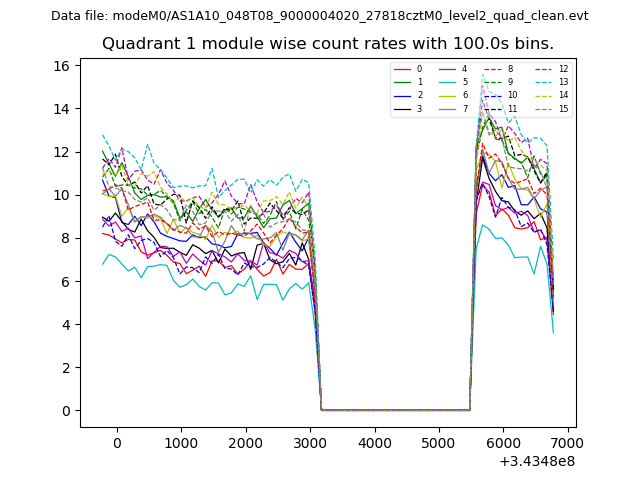
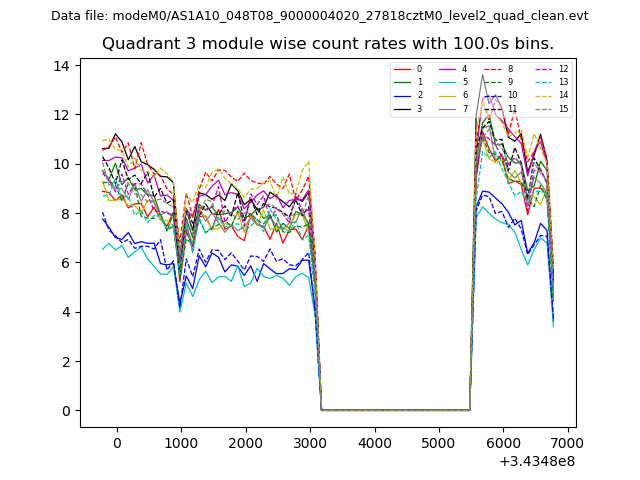
| Module-wise count rates for Quadrant A Data is divided into 100 sec bins |
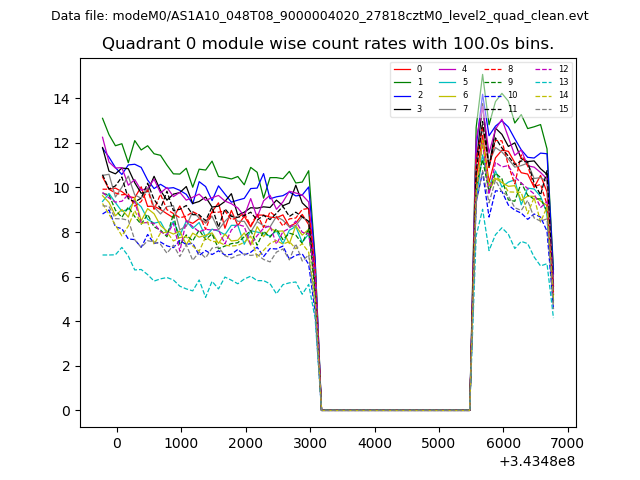 |
 |
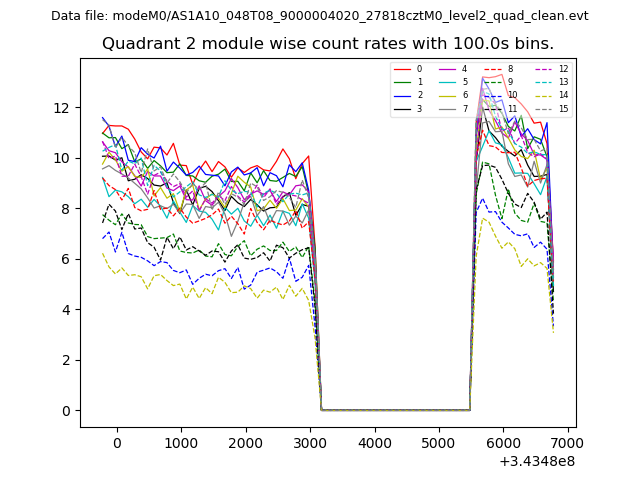
| Module-wise count rates for Quadrant B Data is divided into 100 sec bins |
 |
 |
| Module-wise count rates for Quadrant C Data is divided into 100 sec bins |
 |
 |
| Module-wise count rates for Quadrant D Data is divided into 100 sec bins |
 |
 |
| Parameter | Plot |
|---|---|
| CZT HV Monitor | 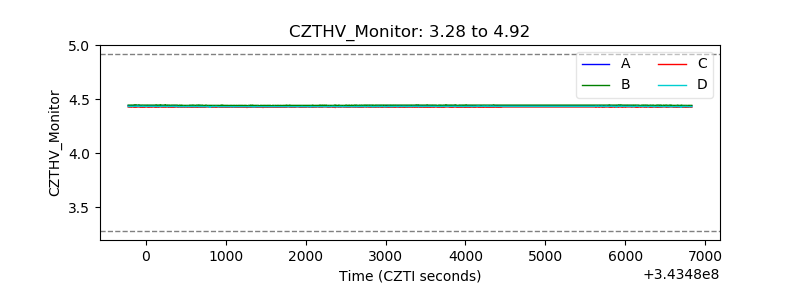 |
| D_VDD | 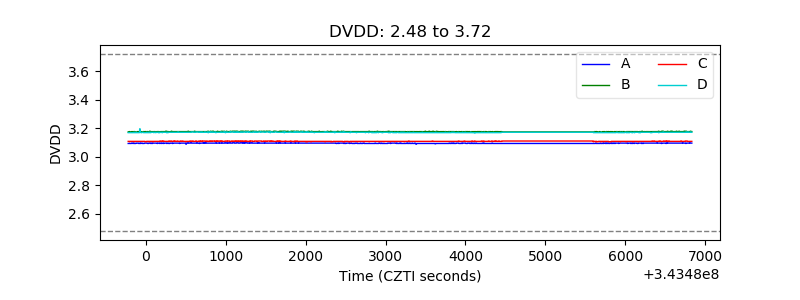 |
| Temperature 1 | 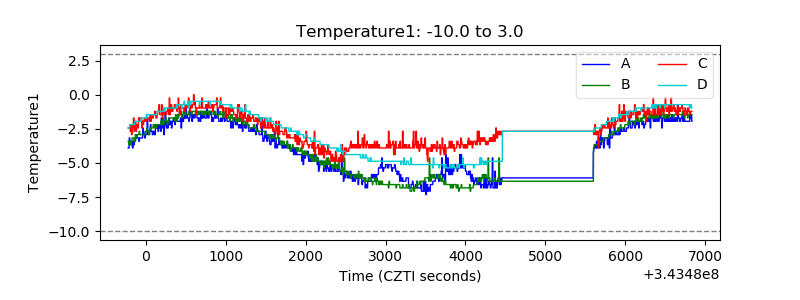 |
| Veto HV Monitor |  |
| Veto LLD | 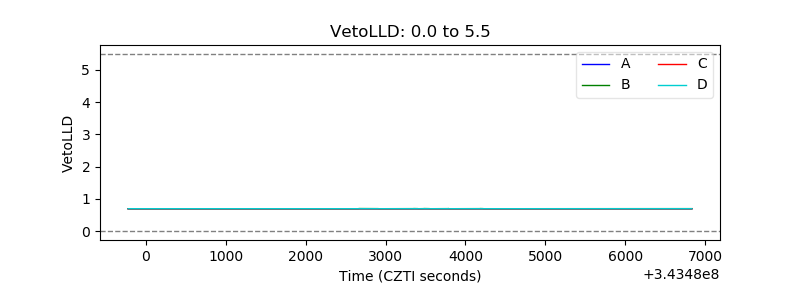 |
| Alpha Counter | 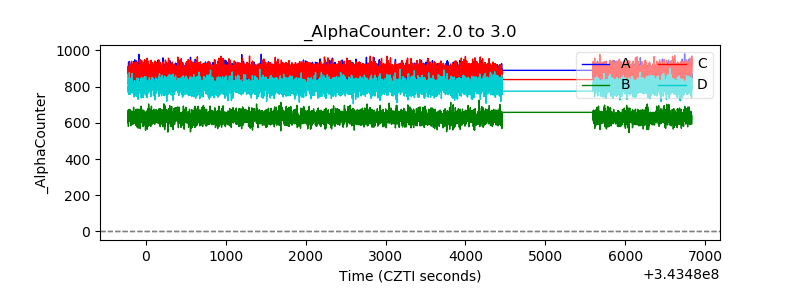 |
| _CPM_Rate | 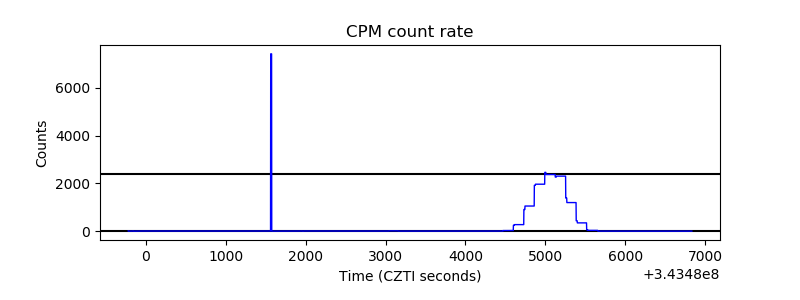 |
| CZT Counter | 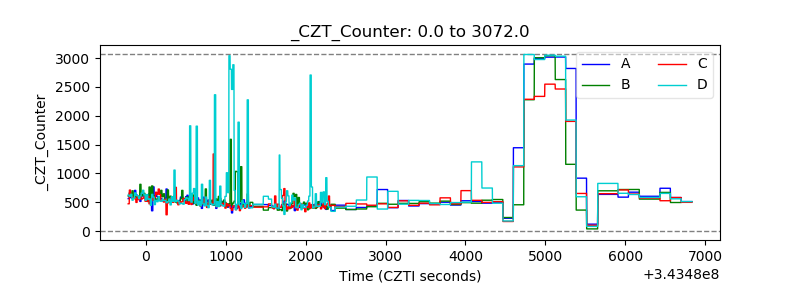 |
| +2.5 Volts monitor |  |
| +5 Volts monitor |  |
| _ROLL_ROT | 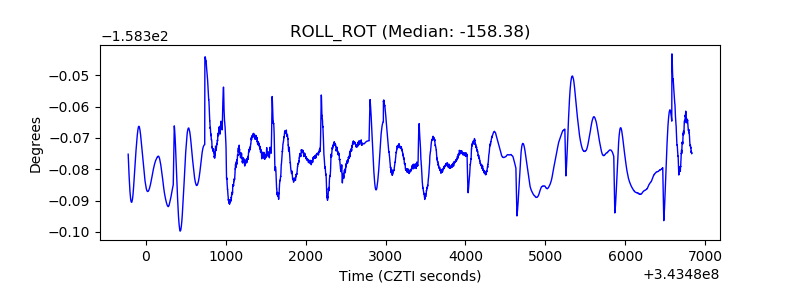 |
| _Roll_DEC | 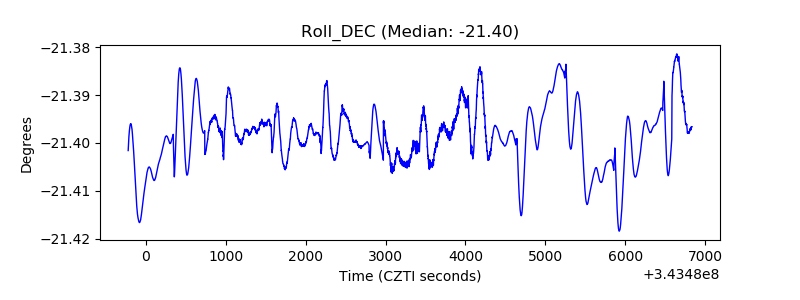 |
| _Roll_RA | 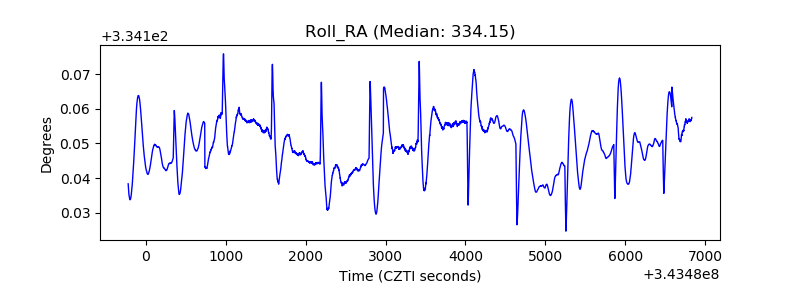 |
| Veto Counter | 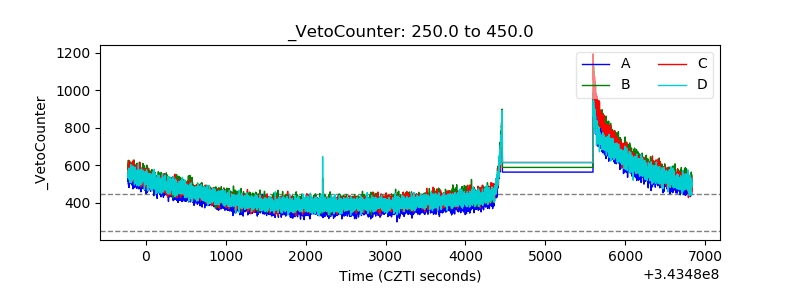 |