| Param | Original file | Final file |
|---|---|---|
| Filename | modeM0/AS1A10_048T08_9000004020_27819cztM0_level2.evt | modeM0/AS1A10_048T08_9000004020_27819cztM0_level2_quad_clean.evt |
| Size (bytes) | 476,202,240 | 105,739,200 |
| Size | 454.1 MB | 100.8 MB |
| Events in quadrant A | 3,299,386 | 718,174 |
| Events in quadrant B | 3,360,026 | 724,307 |
| Events in quadrant C | 3,479,972 | 670,168 |
| Events in quadrant D | 3,858,898 | 654,215 |
| Mode M0 | |||
|---|---|---|---|
| Quadrant | BADHDUFLAG | Total packets | Discarded packets |
| A | 0 | 13800 | 0 |
| B | 0 | 13908 | 0 |
| C | 0 | 14344 | 0 |
| D | 0 | 15663 | 0 |
| Mode M9 | |||
|---|---|---|---|
| Quadrant | BADHDUFLAG | Total packets | Discarded packets |
| A | 0 | 12 | 0 |
| B | 0 | 12 | 0 |
| C | 0 | 12 | 0 |
| D | 0 | 12 | 0 |
| Quadrant | Total seconds | Saturated seconds | Saturation percentage |
|---|---|---|---|
| A | 6232 | 97 | 1.556483% |
| B | 6233 | 86 | 1.379753% |
| C | 6233 | 127 | 2.037542% |
| D | 6233 | 181 | 2.903899% |
Noise dominated data is calculated using 1-second bins in cleaned event files. If a bin has >2000 counts, and if more than 50% of those come from <1% of pixels, then it is considered to be noise-dominated and hence unusable.
| Quadrant | # 1 sec bins | Bins with >0 counts | Bins with >2000 counts | High rate bins dominated by noise | Noise dominated (total time) | Noise dominated (detector-on time) | Marked lightcurve |
|---|---|---|---|---|---|---|---|
| A | 7457 | 6232 | 22 | 22 | 0.30% | 0.35% | 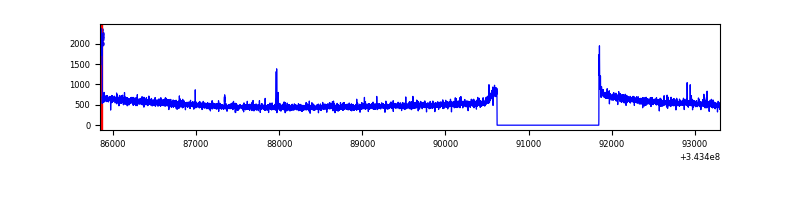 |
| B | 7458 | 6233 | 3 | 3 | 0.04% | 0.05% | 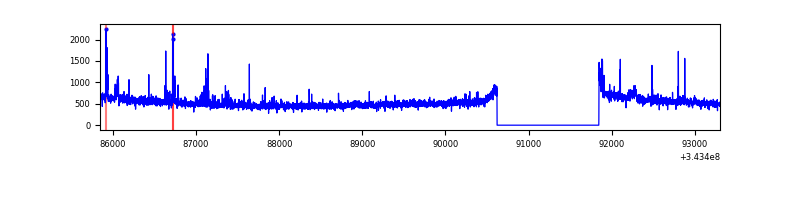 |
| C | 7458 | 6233 | 32 | 32 | 0.43% | 0.51% | 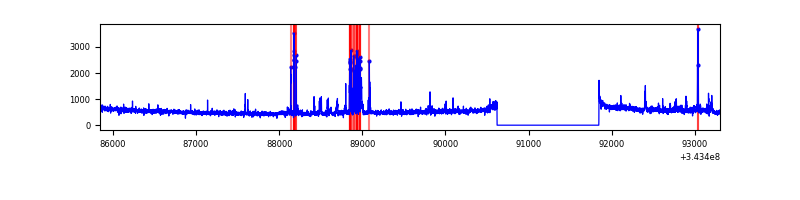 |
| D | 7458 | 6233 | 144 | 144 | 1.93% | 2.31% | 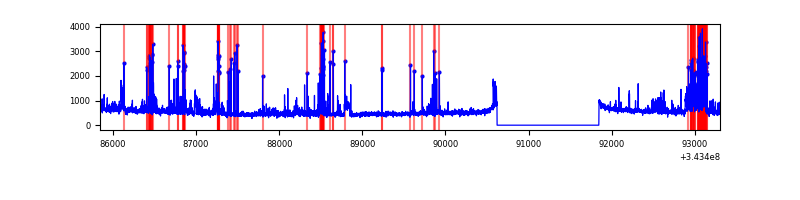 |
Top three noisy pixels from each quadrant. If the there are fewer than three noisy pixels in the level2.evt file, extra rows are filled as -1
| Pixel properties | Quadrant properties | ||||||
|---|---|---|---|---|---|---|---|
| Quadrant | DetID | PixID | Counts | Sigma | Mean | Median | Sigma |
| A | 6 | 16 | 47035 | 275.21 | 838 | 824 | 167.9 |
| A | 2 | 79 | 12143 | 67.41 | 838 | 824 | 167.9 |
| A | 13 | 254 | 9703 | 52.88 | 838 | 824 | 167.9 |
| B | 10 | 245 | 45938 | 290.66 | 826 | 811 | 155.3 |
| B | 15 | 32 | 25668 | 160.1 | 826 | 811 | 155.3 |
| B | 0 | 190 | 20921 | 129.53 | 826 | 811 | 155.3 |
| C | 3 | 233 | 183411 | 1018.17 | 776 | 782 | 179.4 |
| C | 15 | 208 | 134631 | 746.22 | 776 | 782 | 179.4 |
| C | 14 | 238 | 129545 | 717.86 | 776 | 782 | 179.4 |
| D | 1 | 52 | 592508 | 3154.71 | 790 | 768 | 187.6 |
| D | 2 | 250 | 210907 | 1120.3 | 790 | 768 | 187.6 |
| D | 12 | 233 | 29109 | 151.09 | 790 | 768 | 187.6 |
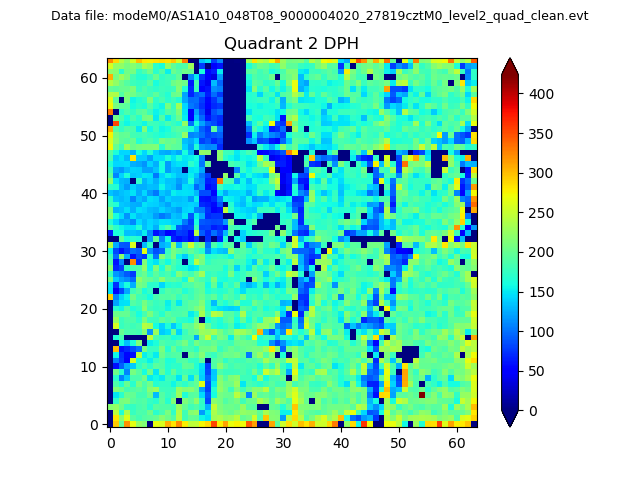
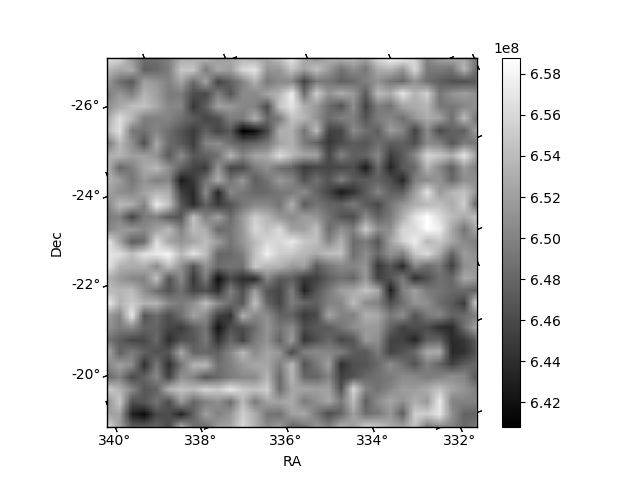
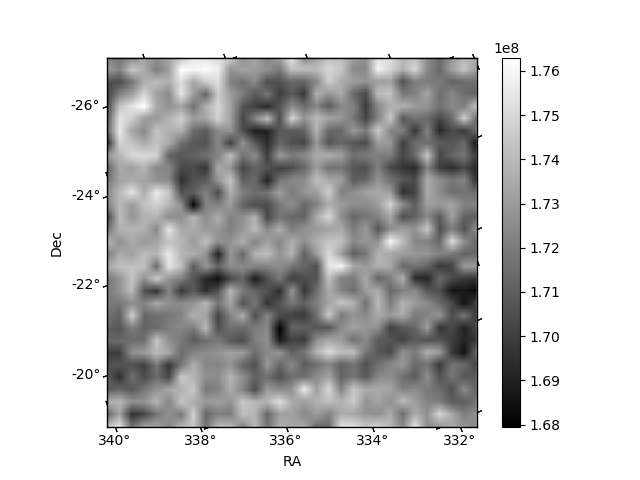
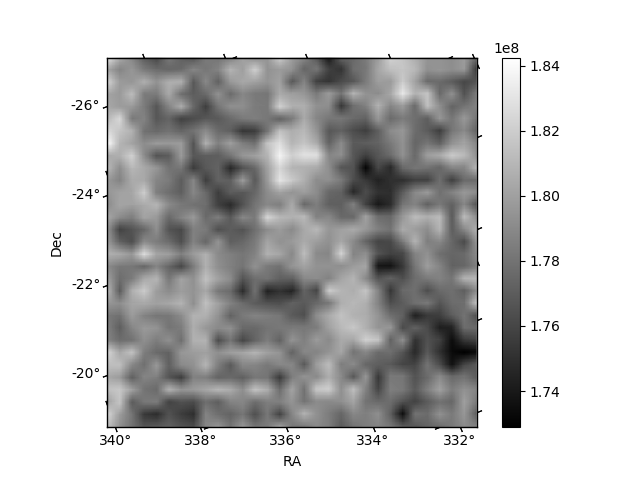
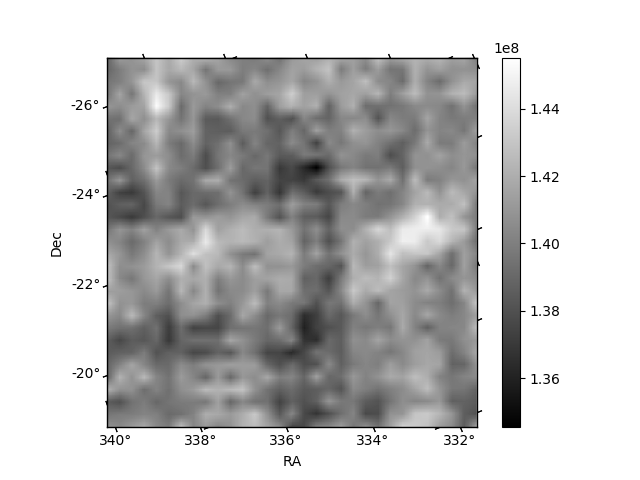
Histogram calculated using DETX and DETY for each event in the final _common_clean file
| Quadrant A | 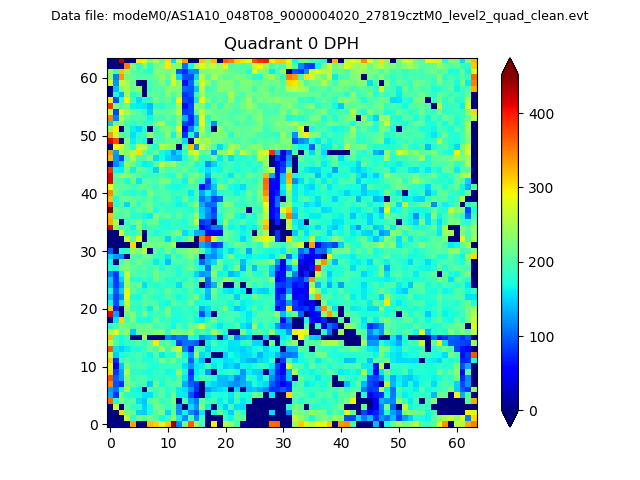 |
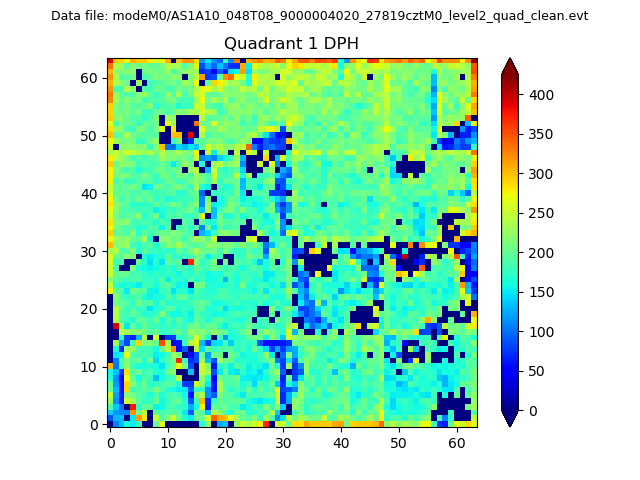 |
Quadrant B |
|---|---|---|---|
| Quadrant D | 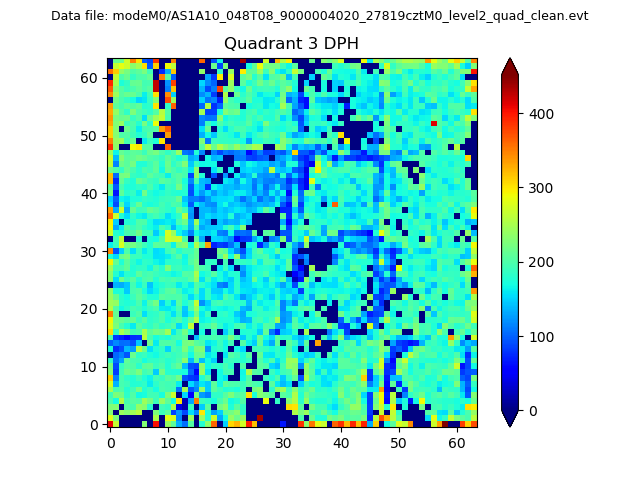 |
 |
Quadrant C |
| Plot type | Count rate plots | Images |
|---|---|---|
| Comparison with Poisson distribution Blue bars denote a histogram of data divided into 1 sec bins. Red curve is a Poisson curve with rate = median count rate of data. |
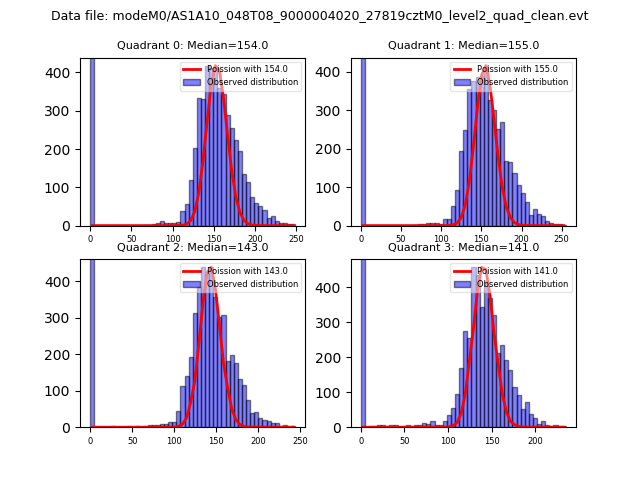 |
 |
| Quadrant-wise count rates Data is divided into 100 sec bins |
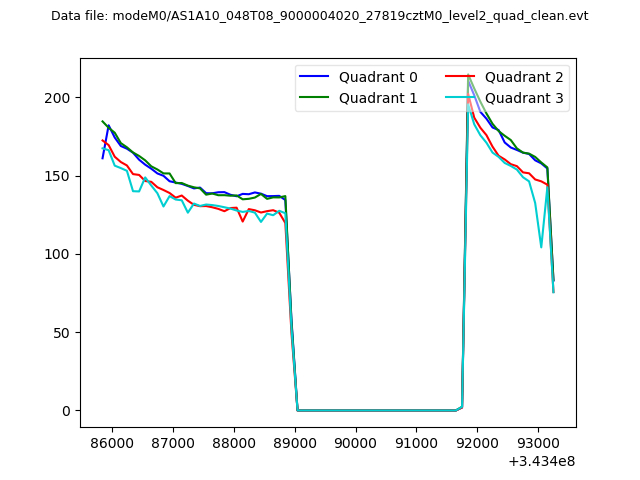 |
|
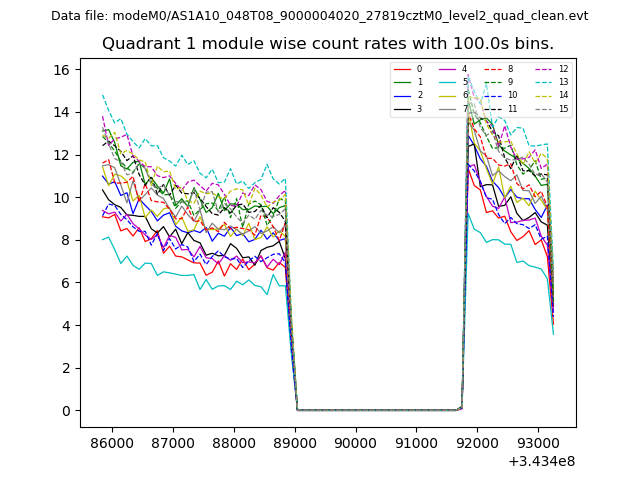
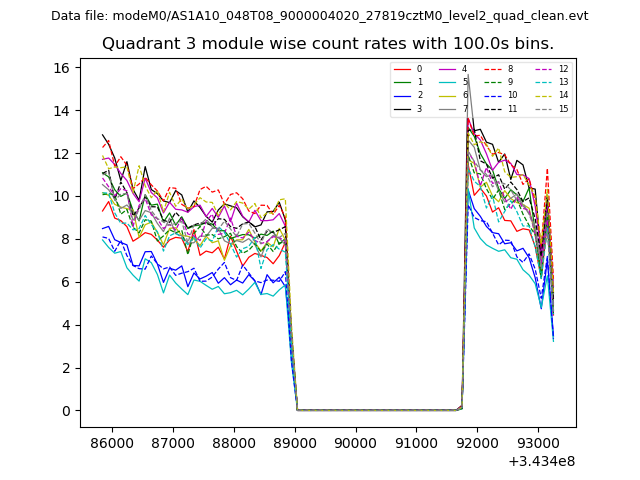
| Module-wise count rates for Quadrant A Data is divided into 100 sec bins |
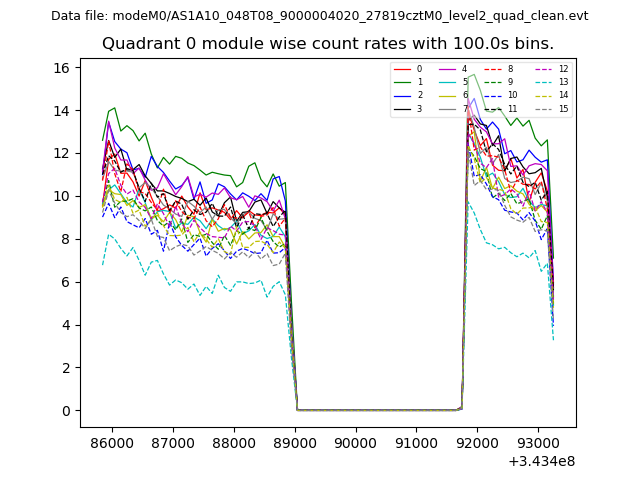 |
 |
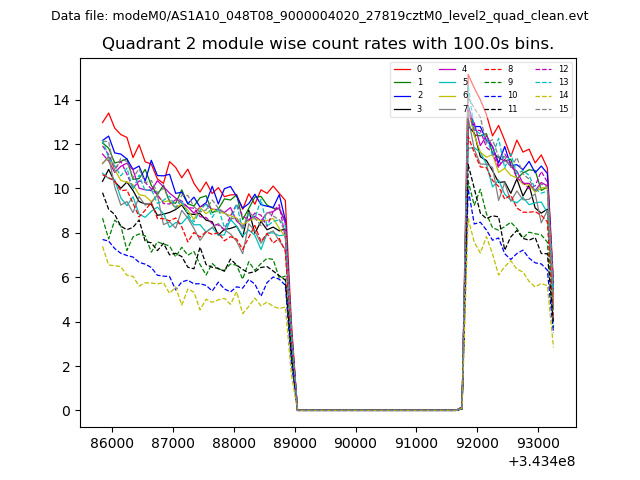
| Module-wise count rates for Quadrant B Data is divided into 100 sec bins |
 |
 |
| Module-wise count rates for Quadrant C Data is divided into 100 sec bins |
 |
 |
| Module-wise count rates for Quadrant D Data is divided into 100 sec bins |
 |
 |
| Parameter | Plot |
|---|---|
| CZT HV Monitor | 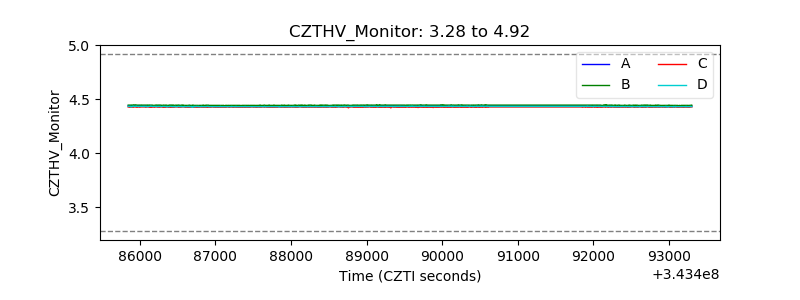 |
| D_VDD | 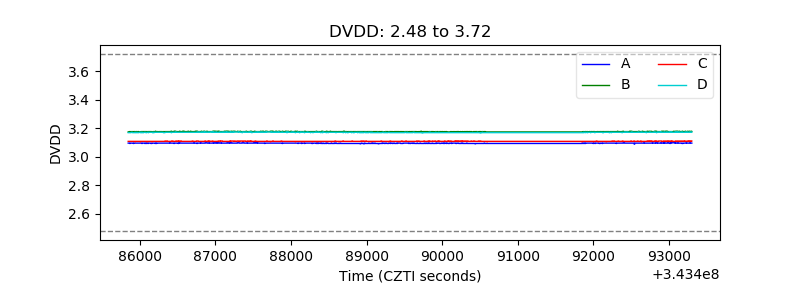 |
| Temperature 1 | 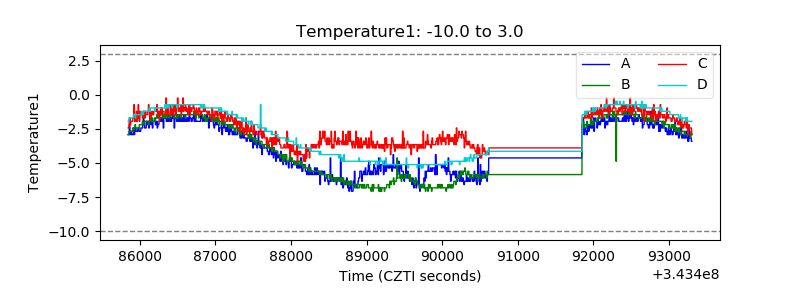 |
| Veto HV Monitor | 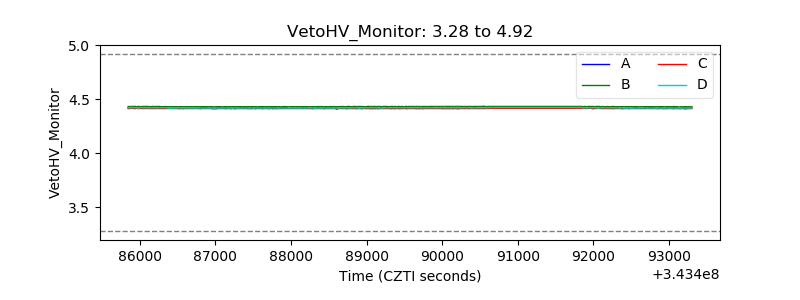 |
| Veto LLD | 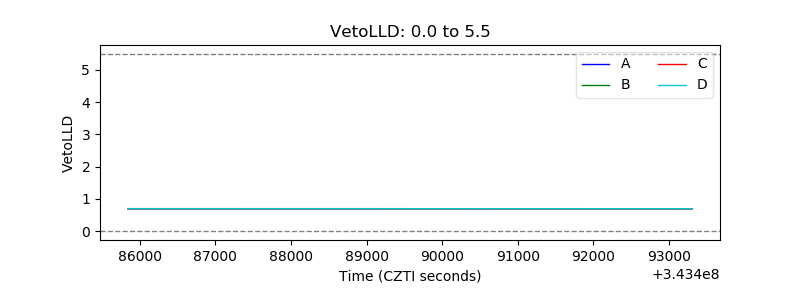 |
| Alpha Counter | 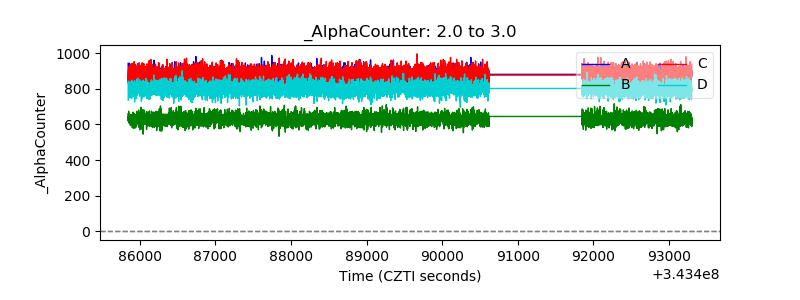 |
| _CPM_Rate | 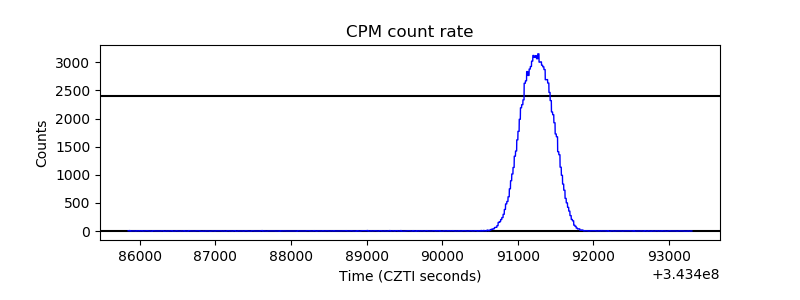 |
| CZT Counter | 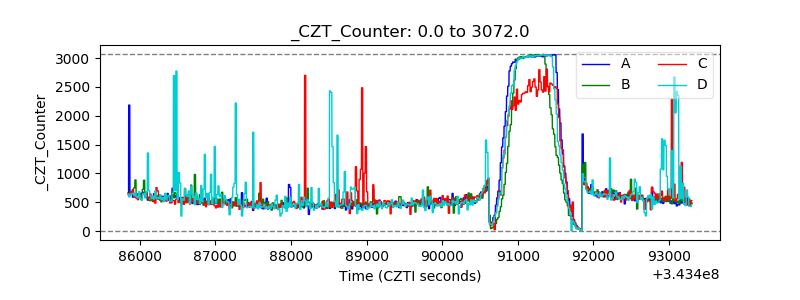 |
| +2.5 Volts monitor |  |
| +5 Volts monitor |  |
| _ROLL_ROT | 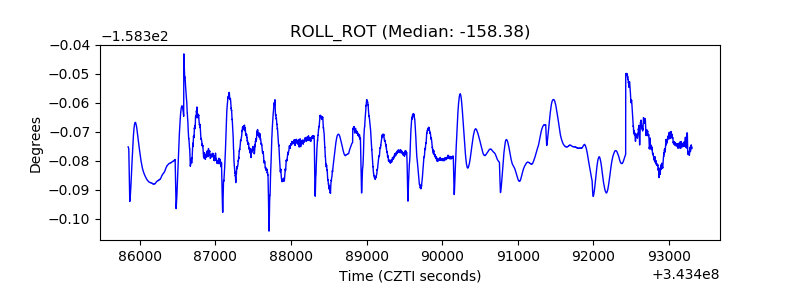 |
| _Roll_DEC | 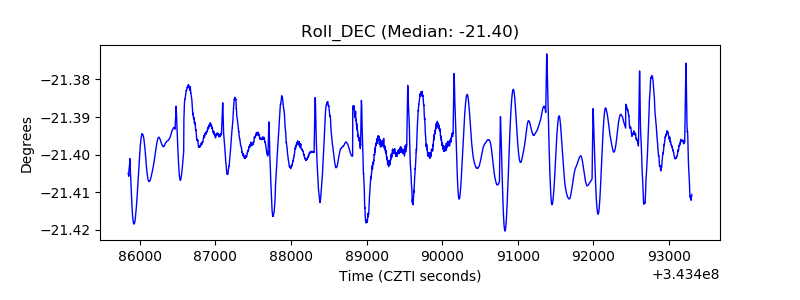 |
| _Roll_RA | 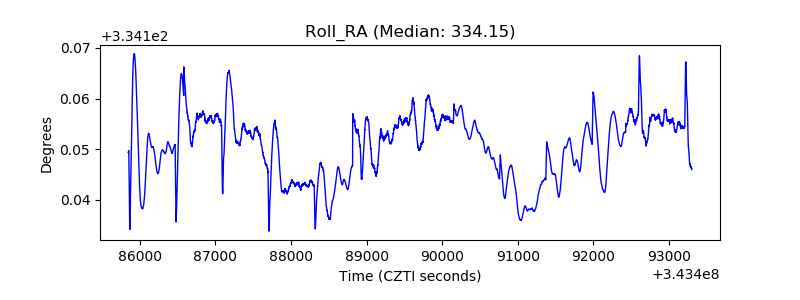 |
| Veto Counter | 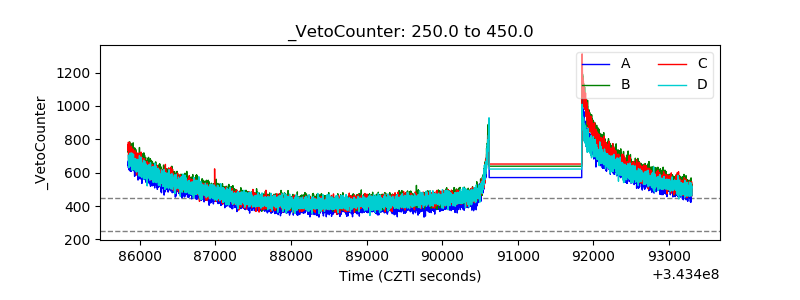 |