| Param | Original file | Final file |
|---|---|---|
| Filename | modeM0/AS1A10_048T08_9000004020_27820cztM0_level2.evt | modeM0/AS1A10_048T08_9000004020_27820cztM0_level2_quad_clean.evt |
| Size (bytes) | 483,298,560 | 104,112,000 |
| Size | 460.9 MB | 99.3 MB |
| Events in quadrant A | 3,370,965 | 705,035 |
| Events in quadrant B | 3,499,143 | 710,551 |
| Events in quadrant C | 3,613,541 | 657,492 |
| Events in quadrant D | 3,723,312 | 638,295 |
| Mode M0 | |||
|---|---|---|---|
| Quadrant | BADHDUFLAG | Total packets | Discarded packets |
| A | 0 | 14022 | 0 |
| B | 0 | 14346 | 0 |
| C | 0 | 14915 | 0 |
| D | 0 | 15209 | 0 |
| Mode M9 | |||
|---|---|---|---|
| Quadrant | BADHDUFLAG | Total packets | Discarded packets |
| A | 0 | 13 | 0 |
| B | 0 | 13 | 0 |
| C | 0 | 13 | 0 |
| D | 0 | 13 | 0 |
| Quadrant | Total seconds | Saturated seconds | Saturation percentage |
|---|---|---|---|
| A | 6333 | 68 | 1.073741% |
| B | 6333 | 89 | 1.405337% |
| C | 6333 | 141 | 2.226433% |
| D | 6334 | 142 | 2.241869% |
Noise dominated data is calculated using 1-second bins in cleaned event files. If a bin has >2000 counts, and if more than 50% of those come from <1% of pixels, then it is considered to be noise-dominated and hence unusable.
| Quadrant | # 1 sec bins | Bins with >0 counts | Bins with >2000 counts | High rate bins dominated by noise | Noise dominated (total time) | Noise dominated (detector-on time) | Marked lightcurve |
|---|---|---|---|---|---|---|---|
| A | 7628 | 6333 | 0 | 0 | 0.00% | 0.00% | 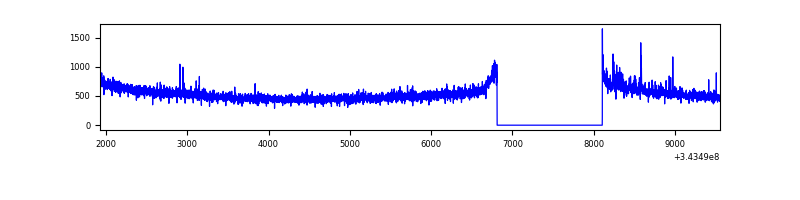 |
| B | 7628 | 6333 | 11 | 11 | 0.14% | 0.17% | 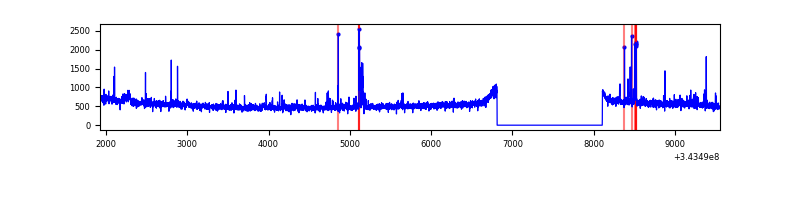 |
| C | 7628 | 6333 | 5 | 5 | 0.07% | 0.08% |  |
| D | 7629 | 6334 | 94 | 94 | 1.23% | 1.48% | 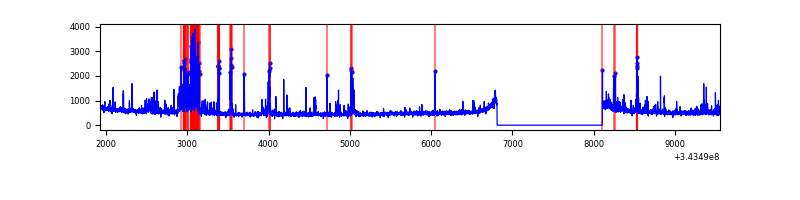 |
Top three noisy pixels from each quadrant. If the there are fewer than three noisy pixels in the level2.evt file, extra rows are filled as -1
| Pixel properties | Quadrant properties | ||||||
|---|---|---|---|---|---|---|---|
| Quadrant | DetID | PixID | Counts | Sigma | Mean | Median | Sigma |
| A | 2 | 79 | 38202 | 218.2 | 862 | 849 | 171.2 |
| A | 13 | 254 | 10394 | 55.76 | 862 | 849 | 171.2 |
| A | 3 | 137 | 7708 | 40.07 | 862 | 849 | 171.2 |
| B | 5 | 172 | 37980 | 233.27 | 851 | 835 | 159.2 |
| B | 15 | 32 | 36444 | 223.62 | 851 | 835 | 159.2 |
| B | 15 | 33 | 32353 | 197.93 | 851 | 835 | 159.2 |
| C | 3 | 233 | 347974 | 1863.09 | 802 | 808 | 186.3 |
| C | 14 | 238 | 131375 | 700.7 | 802 | 808 | 186.3 |
| C | 4 | 175 | 6571 | 30.93 | 802 | 808 | 186.3 |
| D | 1 | 52 | 265680 | 1364.9 | 812 | 791 | 194.1 |
| D | 2 | 250 | 241595 | 1240.8 | 812 | 791 | 194.1 |
| D | 12 | 79 | 43619 | 220.68 | 812 | 791 | 194.1 |
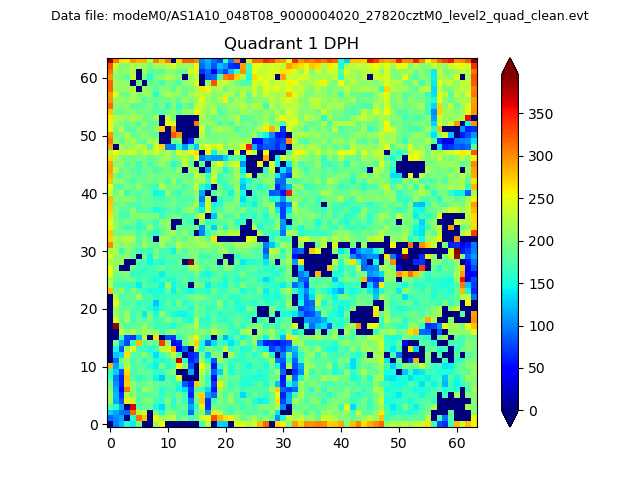
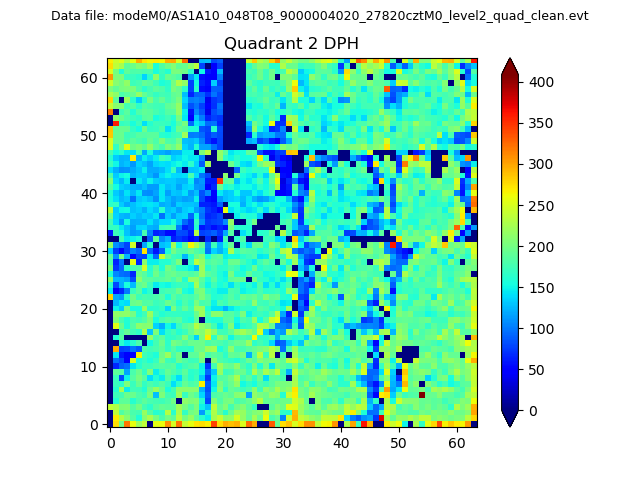
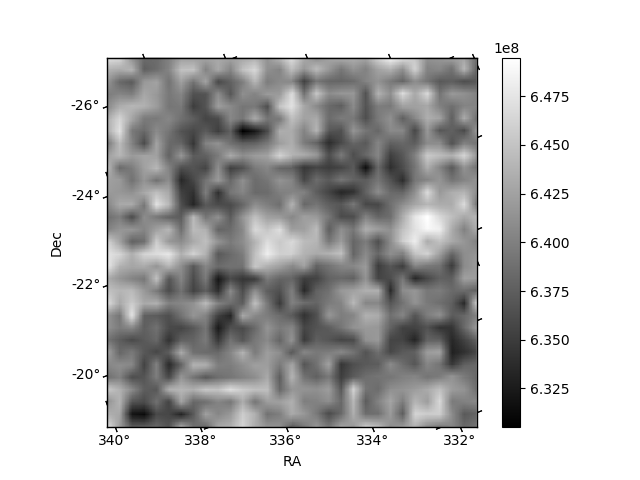
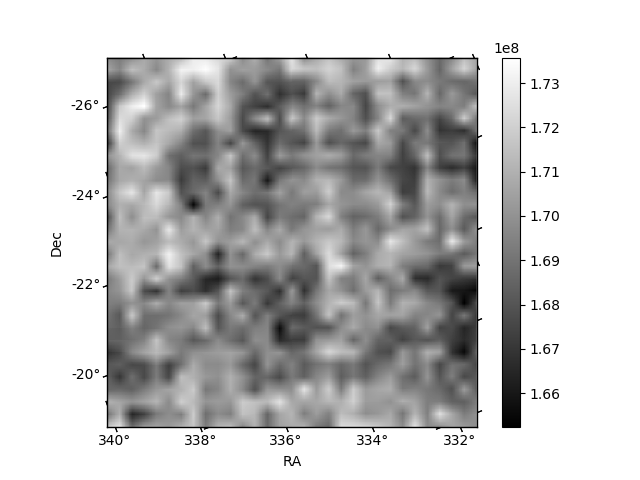
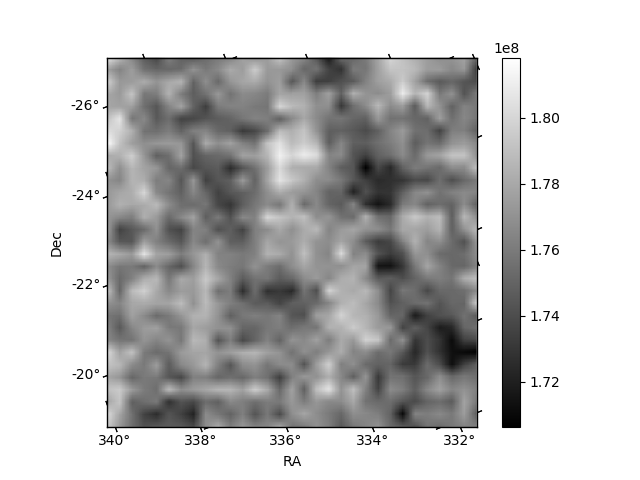
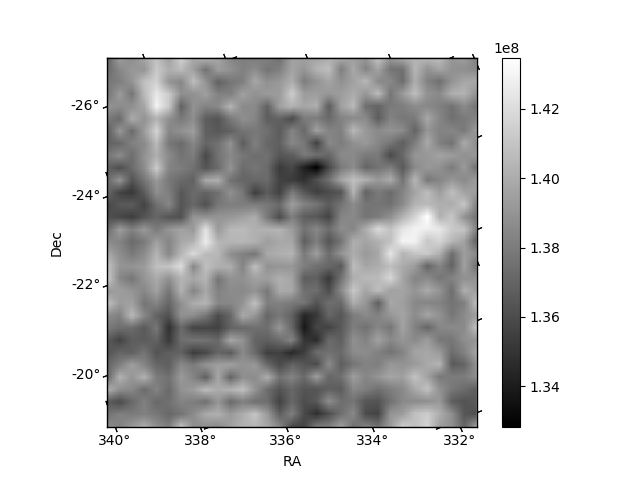
Histogram calculated using DETX and DETY for each event in the final _common_clean file
| Quadrant A | 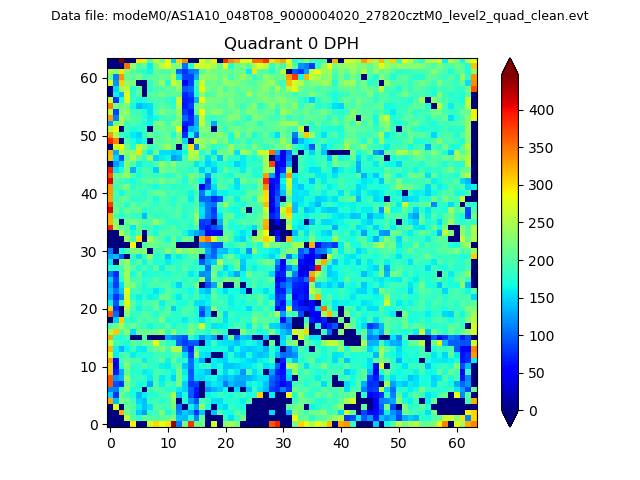 |
 |
Quadrant B |
|---|---|---|---|
| Quadrant D | 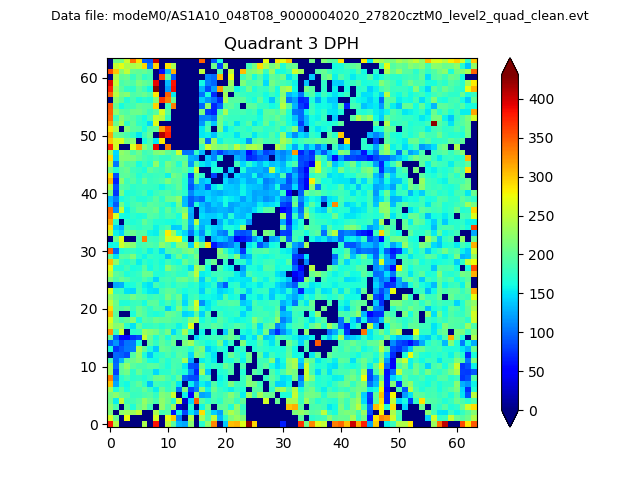 |
 |
Quadrant C |
| Plot type | Count rate plots | Images |
|---|---|---|
| Comparison with Poisson distribution Blue bars denote a histogram of data divided into 1 sec bins. Red curve is a Poisson curve with rate = median count rate of data. |
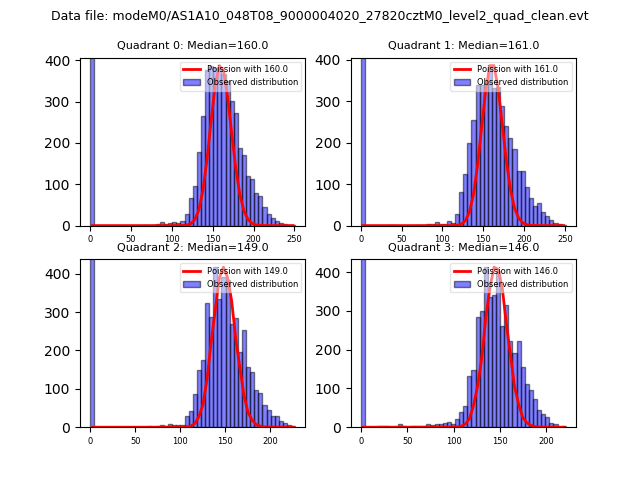 |
 |
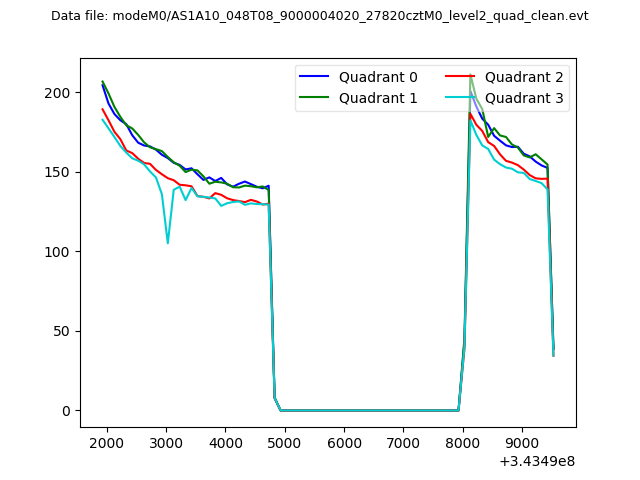
| Quadrant-wise count rates Data is divided into 100 sec bins |
 |
|
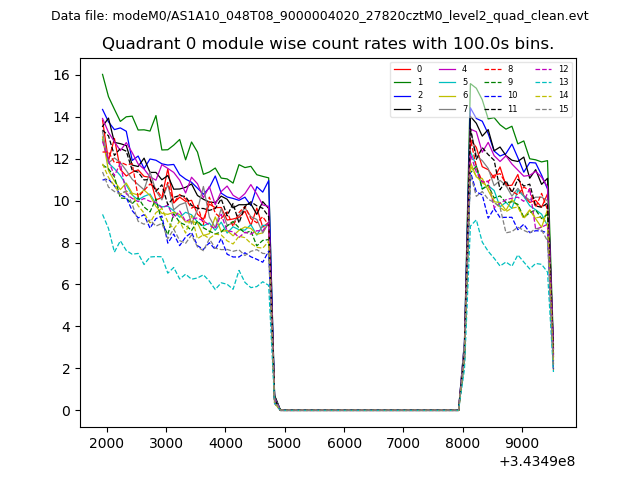
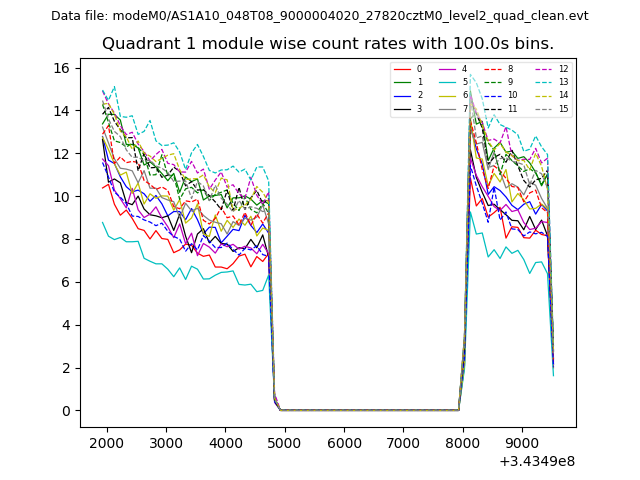
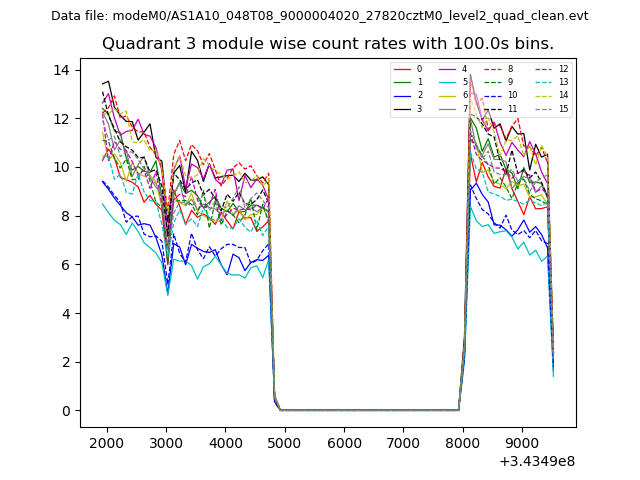
| Module-wise count rates for Quadrant A Data is divided into 100 sec bins |
 |
 |
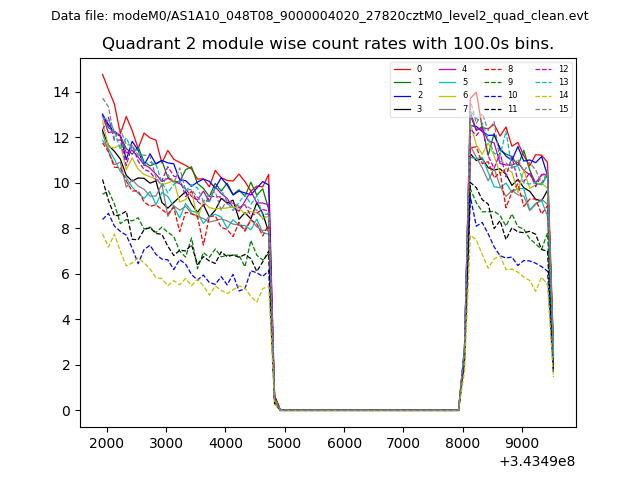
| Module-wise count rates for Quadrant B Data is divided into 100 sec bins |
 |
 |
| Module-wise count rates for Quadrant C Data is divided into 100 sec bins |
 |
 |
| Module-wise count rates for Quadrant D Data is divided into 100 sec bins |
 |
 |
| Parameter | Plot |
|---|---|
| CZT HV Monitor | 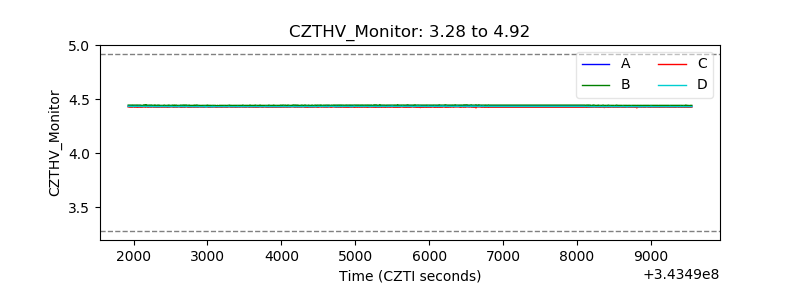 |
| D_VDD | 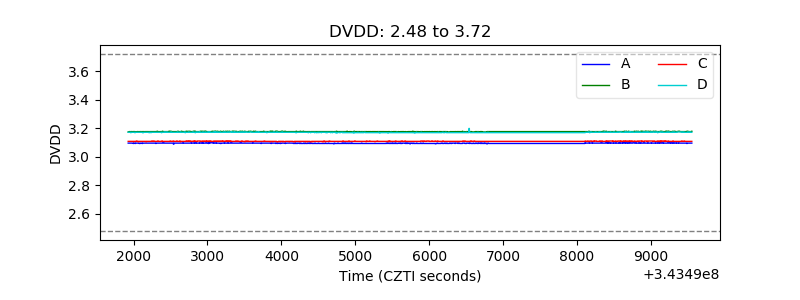 |
| Temperature 1 | 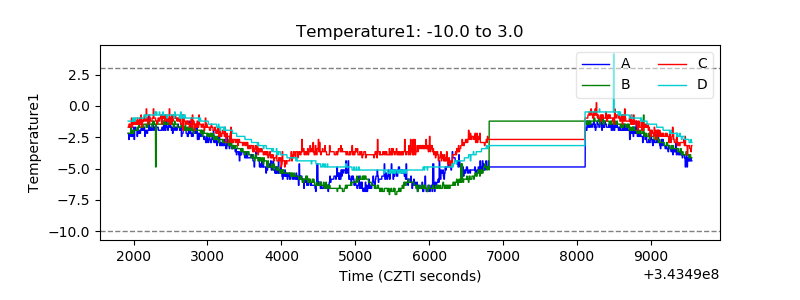 |
| Veto HV Monitor |  |
| Veto LLD | 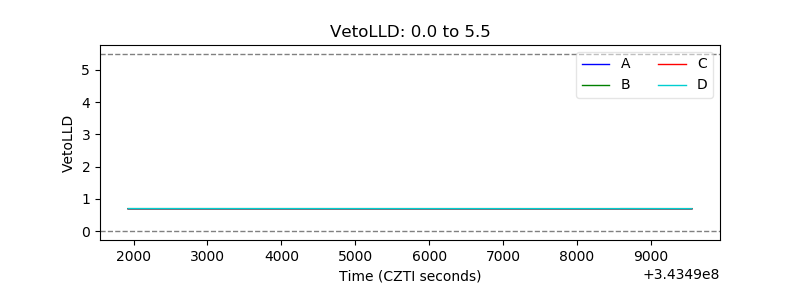 |
| Alpha Counter | 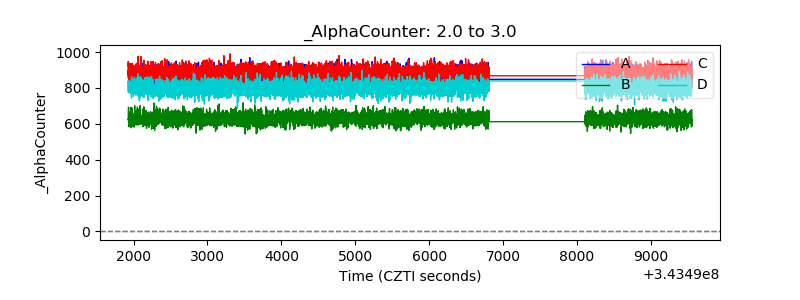 |
| _CPM_Rate | 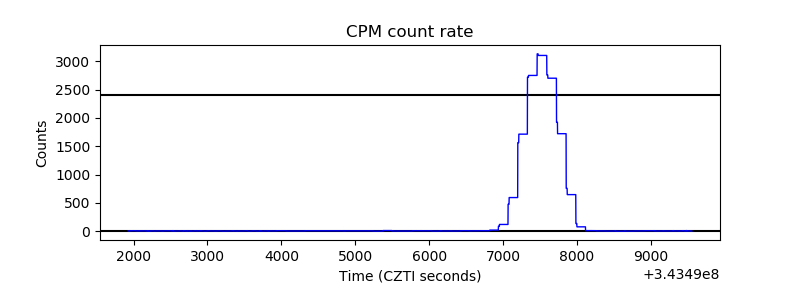 |
| CZT Counter | 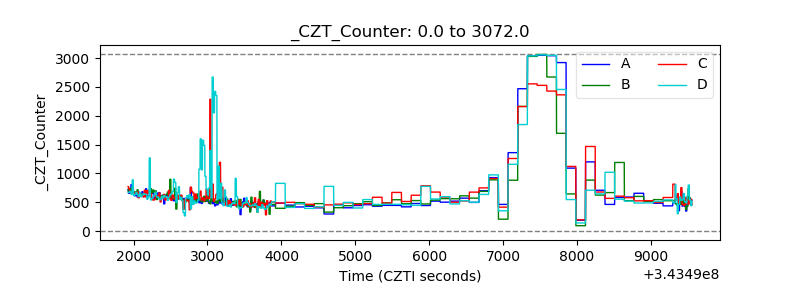 |
| +2.5 Volts monitor |  |
| +5 Volts monitor |  |
| _ROLL_ROT | 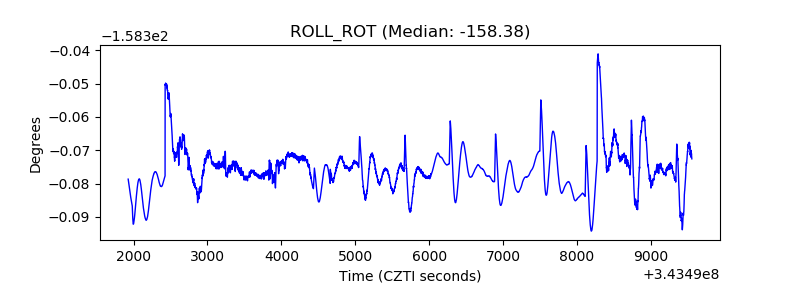 |
| _Roll_DEC |  |
| _Roll_RA | 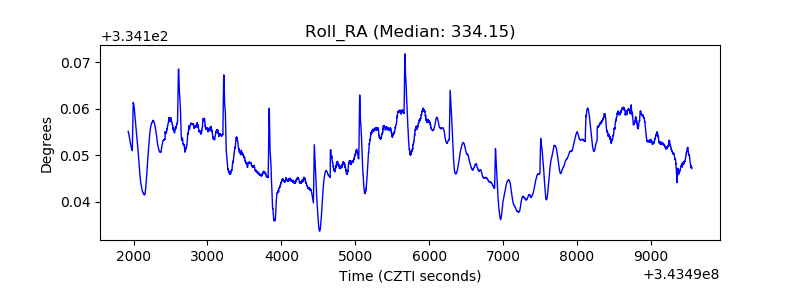 |
| Veto Counter | 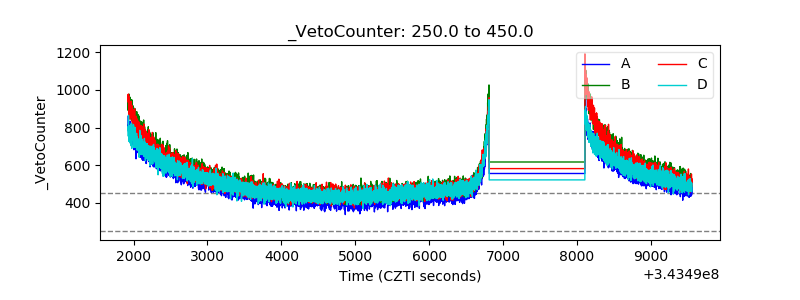 |