| Param | Original file | Final file |
|---|---|---|
| Filename | modeM0/AS1A10_048T08_9000004020_27821cztM0_level2.evt | modeM0/AS1A10_048T08_9000004020_27821cztM0_level2_quad_clean.evt |
| Size (bytes) | 489,329,280 | 95,532,480 |
| Size | 466.7 MB | 91.1 MB |
| Events in quadrant A | 3,467,295 | 634,122 |
| Events in quadrant B | 3,510,569 | 642,591 |
| Events in quadrant C | 3,997,433 | 596,405 |
| Events in quadrant D | 3,422,539 | 586,385 |
| Mode M0 | |||
|---|---|---|---|
| Quadrant | BADHDUFLAG | Total packets | Discarded packets |
| A | 0 | 14177 | 0 |
| B | 0 | 14355 | 0 |
| C | 0 | 15938 | 0 |
| D | 0 | 14133 | 0 |
| Mode M9 | |||
|---|---|---|---|
| Quadrant | BADHDUFLAG | Total packets | Discarded packets |
| A | 0 | 13 | 0 |
| B | 0 | 14 | 0 |
| C | 0 | 14 | 0 |
| D | 0 | 14 | 0 |
| Quadrant | Total seconds | Saturated seconds | Saturation percentage |
|---|---|---|---|
| A | 6214 | 105 | 1.689733% |
| B | 6214 | 134 | 2.156421% |
| C | 6214 | 295 | 4.747345% |
| D | 6214 | 79 | 1.271323% |
Noise dominated data is calculated using 1-second bins in cleaned event files. If a bin has >2000 counts, and if more than 50% of those come from <1% of pixels, then it is considered to be noise-dominated and hence unusable.
| Quadrant | # 1 sec bins | Bins with >0 counts | Bins with >2000 counts | High rate bins dominated by noise | Noise dominated (total time) | Noise dominated (detector-on time) | Marked lightcurve |
|---|---|---|---|---|---|---|---|
| A | 7489 | 6214 | 9 | 9 | 0.12% | 0.14% | 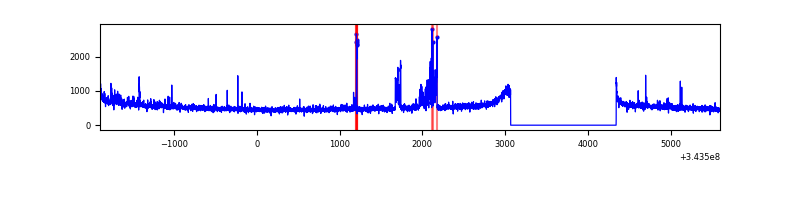 |
| B | 7489 | 6214 | 10 | 10 | 0.13% | 0.16% | 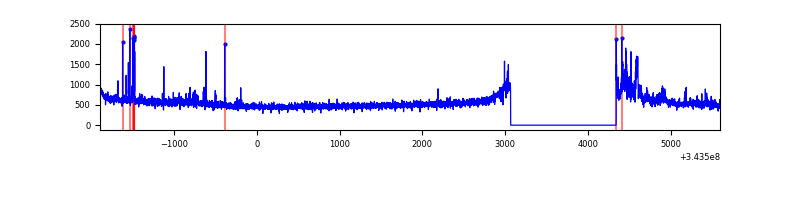 |
| C | 7489 | 6214 | 102 | 102 | 1.36% | 1.64% | 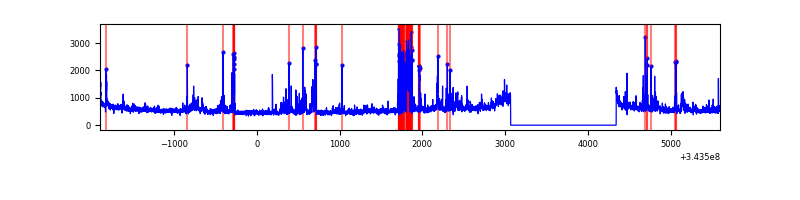 |
| D | 7489 | 6214 | 23 | 23 | 0.31% | 0.37% | 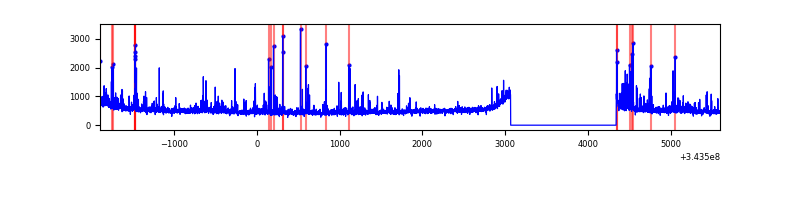 |
Top three noisy pixels from each quadrant. If the there are fewer than three noisy pixels in the level2.evt file, extra rows are filled as -1
| Pixel properties | Quadrant properties | ||||||
|---|---|---|---|---|---|---|---|
| Quadrant | DetID | PixID | Counts | Sigma | Mean | Median | Sigma |
| A | 13 | 170 | 178272 | 1051.66 | 839 | 825 | 168.7 |
| A | 2 | 79 | 33998 | 196.6 | 839 | 825 | 168.7 |
| A | 13 | 248 | 13014 | 72.24 | 839 | 825 | 168.7 |
| B | 15 | 33 | 92424 | 590.67 | 834 | 816 | 155.1 |
| B | 5 | 172 | 46212 | 292.71 | 834 | 816 | 155.1 |
| B | 0 | 230 | 43443 | 274.85 | 834 | 816 | 155.1 |
| C | 3 | 233 | 736177 | 4039.07 | 783 | 790 | 182.1 |
| C | 14 | 238 | 126277 | 689.23 | 783 | 790 | 182.1 |
| C | 15 | 208 | 75261 | 409.03 | 783 | 790 | 182.1 |
| D | 1 | 52 | 209281 | 1096.31 | 798 | 777 | 190.2 |
| D | 2 | 250 | 77088 | 401.24 | 798 | 777 | 190.2 |
| D | 12 | 233 | 35784 | 184.07 | 798 | 777 | 190.2 |
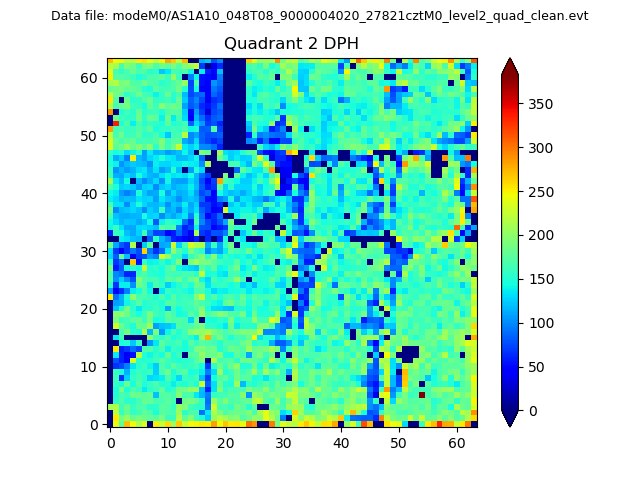
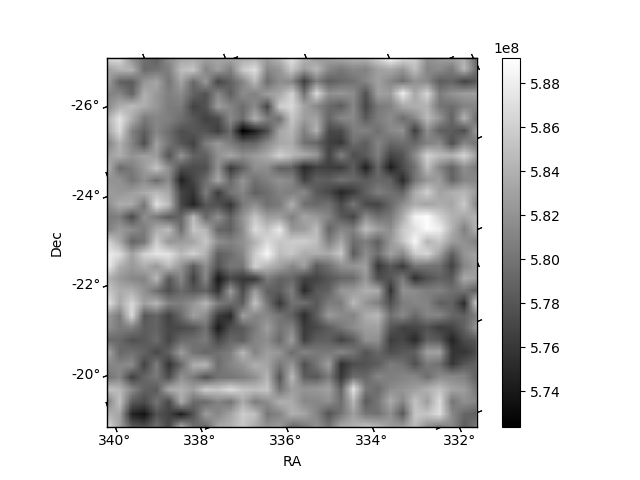
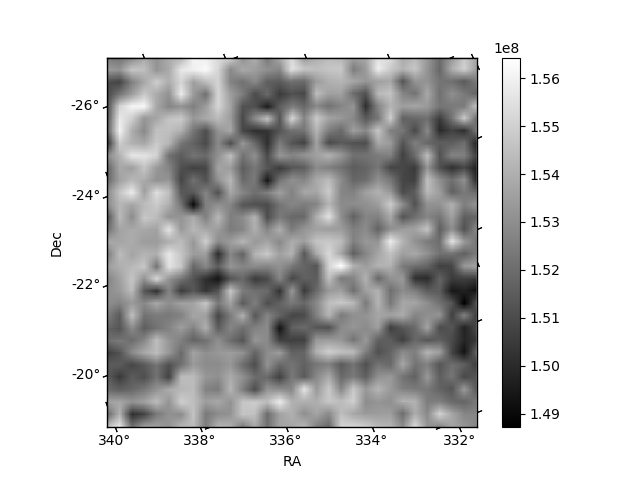
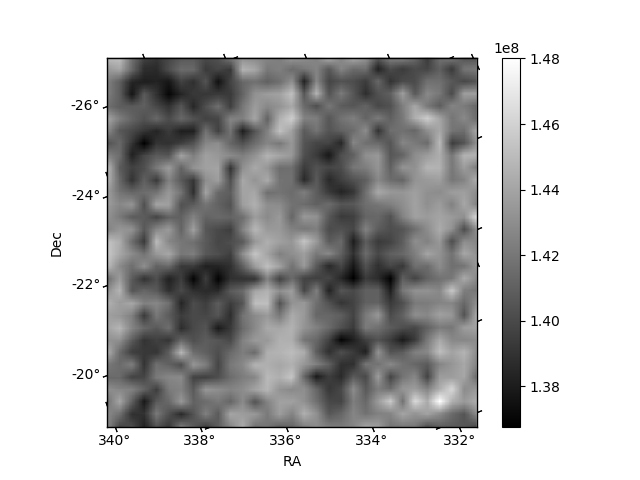
Histogram calculated using DETX and DETY for each event in the final _common_clean file
| Quadrant A | 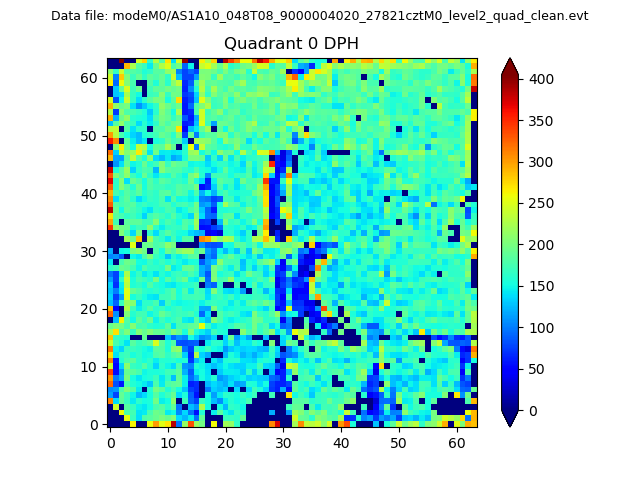 |
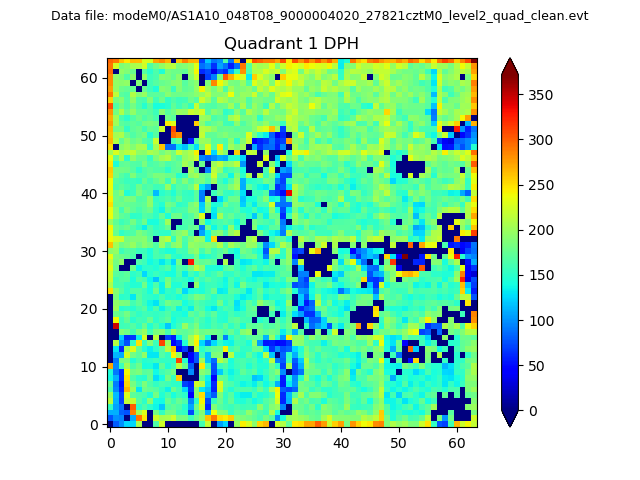 |
Quadrant B |
|---|---|---|---|
| Quadrant D | 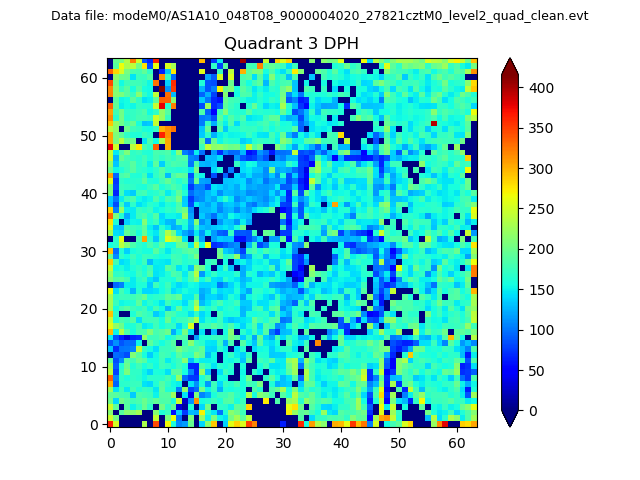 |
 |
Quadrant C |
| Plot type | Count rate plots | Images |
|---|---|---|
| Comparison with Poisson distribution Blue bars denote a histogram of data divided into 1 sec bins. Red curve is a Poisson curve with rate = median count rate of data. |
 |
 |
| Quadrant-wise count rates Data is divided into 100 sec bins |
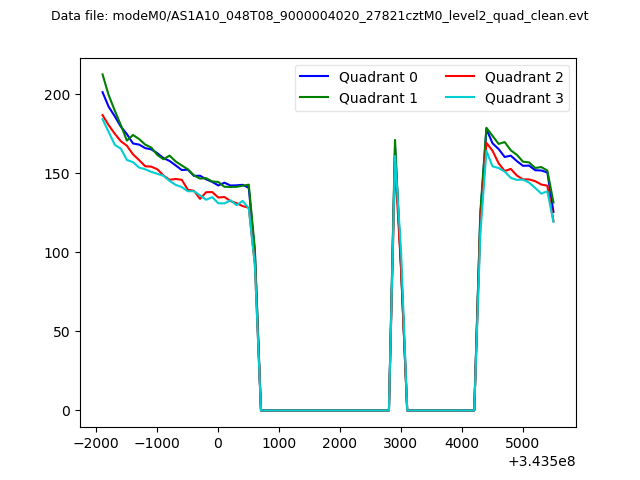 |
|
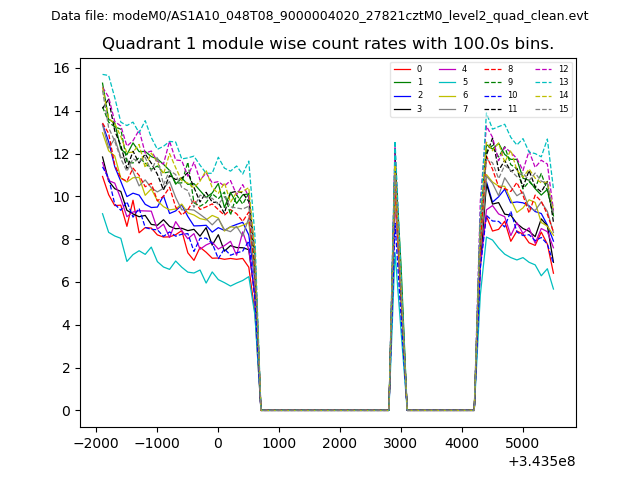
| Module-wise count rates for Quadrant A Data is divided into 100 sec bins |
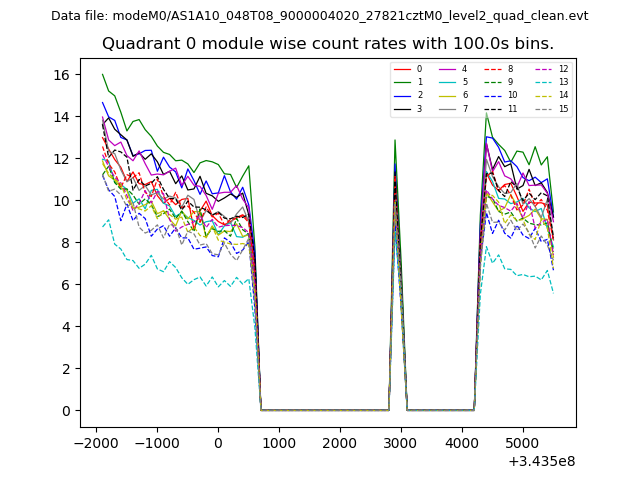 |
 |
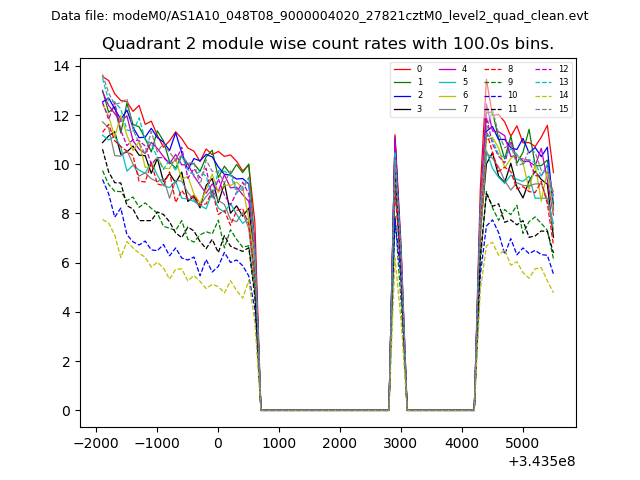
| Module-wise count rates for Quadrant B Data is divided into 100 sec bins |
 |
 |
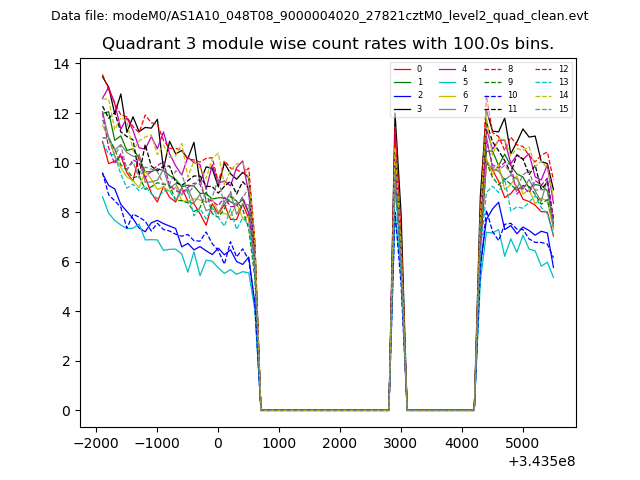
| Module-wise count rates for Quadrant C Data is divided into 100 sec bins |
 |
 |
| Module-wise count rates for Quadrant D Data is divided into 100 sec bins |
 |
 |
| Parameter | Plot |
|---|---|
| CZT HV Monitor | 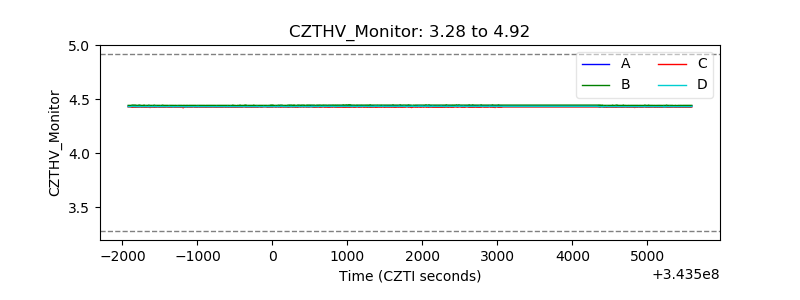 |
| D_VDD | 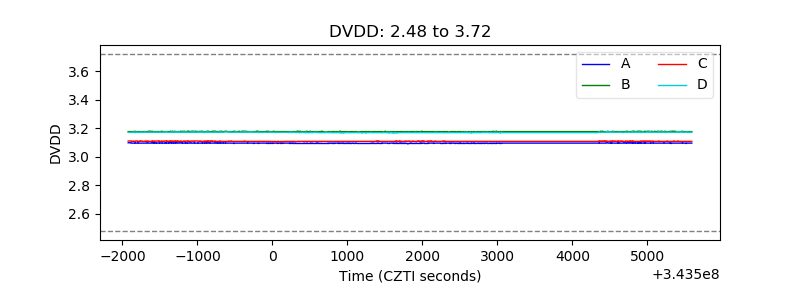 |
| Temperature 1 | 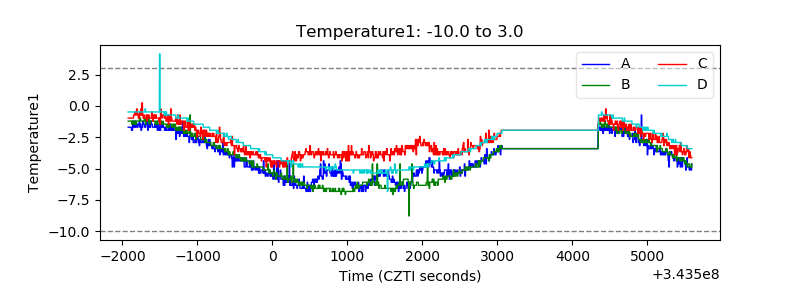 |
| Veto HV Monitor | 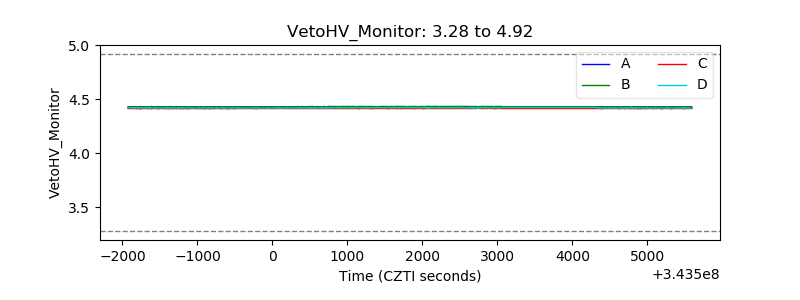 |
| Veto LLD | 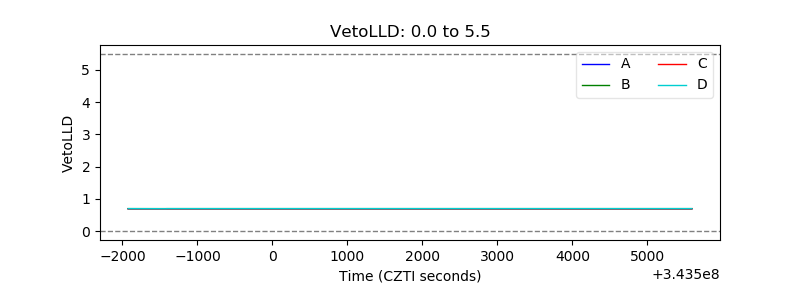 |
| Alpha Counter | 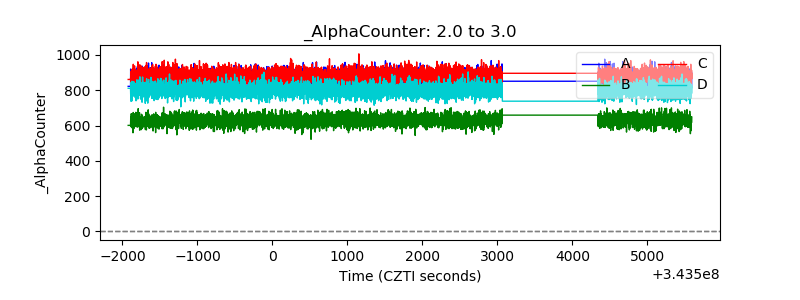 |
| _CPM_Rate | 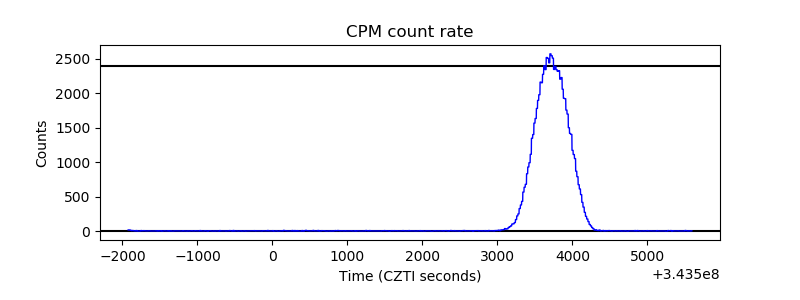 |
| CZT Counter | 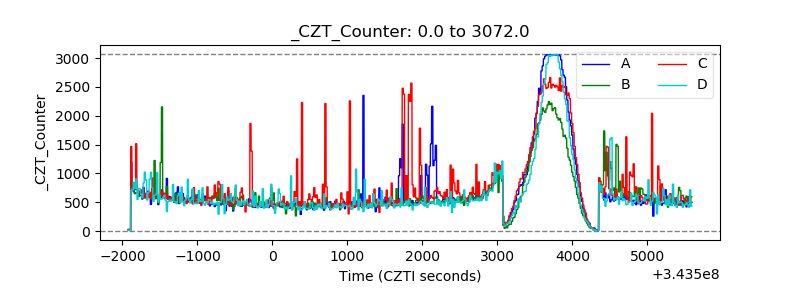 |
| +2.5 Volts monitor |  |
| +5 Volts monitor | 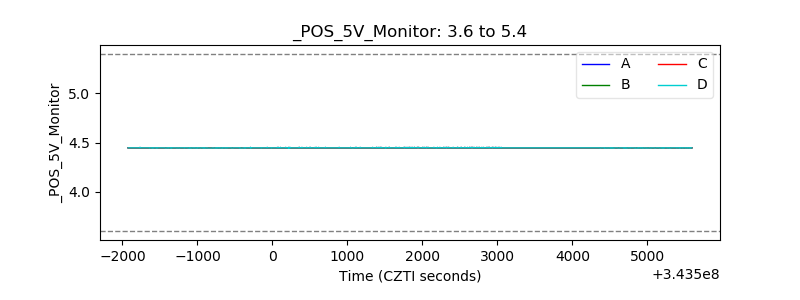 |
| _ROLL_ROT | 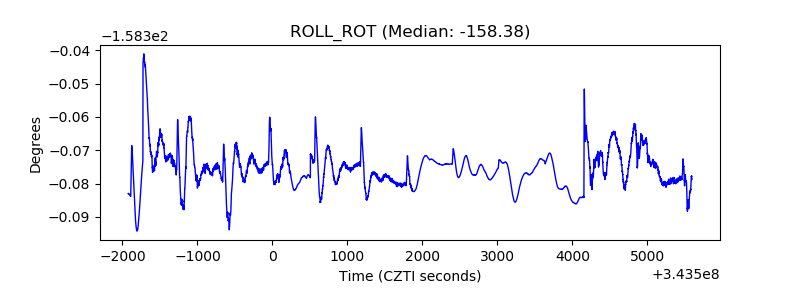 |
| _Roll_DEC | 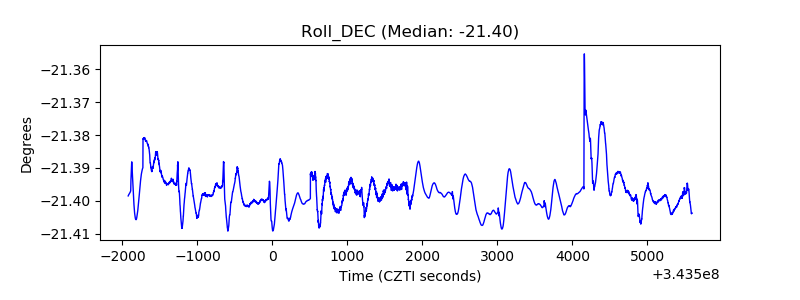 |
| _Roll_RA | 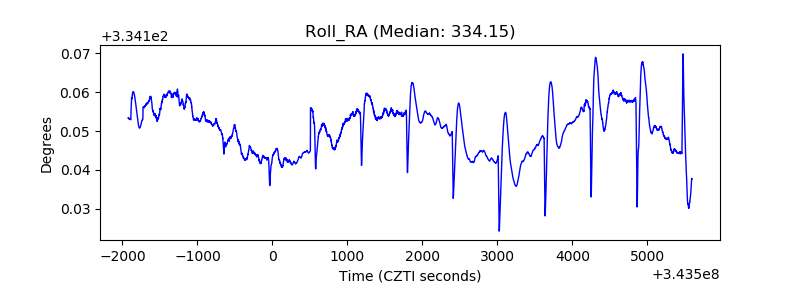 |
| Veto Counter | 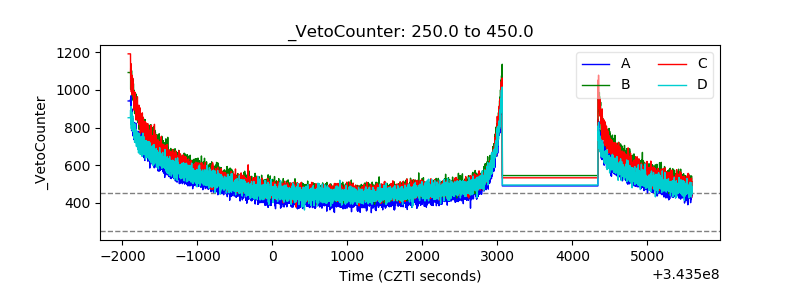 |