| Param | Original file | Final file |
|---|---|---|
| Filename | modeM0/AS1A10_048T08_9000004020_27822cztM0_level2.evt | modeM0/AS1A10_048T08_9000004020_27822cztM0_level2_quad_clean.evt |
| Size (bytes) | 466,205,760 | 92,563,200 |
| Size | 444.6 MB | 88.3 MB |
| Events in quadrant A | 3,172,811 | 605,401 |
| Events in quadrant B | 3,382,194 | 617,321 |
| Events in quadrant C | 3,903,541 | 576,831 |
| Events in quadrant D | 3,233,789 | 565,192 |
| Mode M0 | |||
|---|---|---|---|
| Quadrant | BADHDUFLAG | Total packets | Discarded packets |
| A | 0 | 13355 | 0 |
| B | 0 | 13960 | 0 |
| C | 0 | 15491 | 0 |
| D | 0 | 13763 | 0 |
| Mode M9 | |||
|---|---|---|---|
| Quadrant | BADHDUFLAG | Total packets | Discarded packets |
| A | 0 | 16 | 0 |
| B | 0 | 17 | 0 |
| C | 0 | 17 | 0 |
| D | 0 | 17 | 0 |
| Quadrant | Total seconds | Saturated seconds | Saturation percentage |
|---|---|---|---|
| A | 6280 | 43 | 0.684713% |
| B | 6280 | 51 | 0.812102% |
| C | 6280 | 227 | 3.614650% |
| D | 6280 | 37 | 0.589172% |
Noise dominated data is calculated using 1-second bins in cleaned event files. If a bin has >2000 counts, and if more than 50% of those come from <1% of pixels, then it is considered to be noise-dominated and hence unusable.
| Quadrant | # 1 sec bins | Bins with >0 counts | Bins with >2000 counts | High rate bins dominated by noise | Noise dominated (total time) | Noise dominated (detector-on time) | Marked lightcurve |
|---|---|---|---|---|---|---|---|
| A | 7540 | 6281 | 12 | 12 | 0.16% | 0.19% | 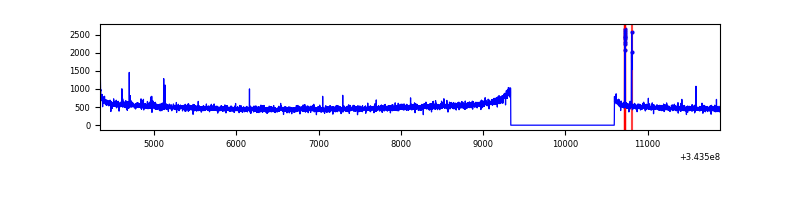 |
| B | 7540 | 6281 | 2 | 2 | 0.03% | 0.03% | 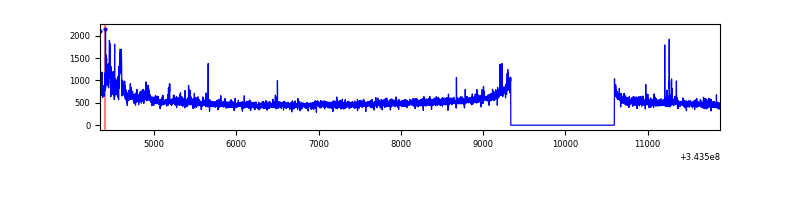 |
| C | 7540 | 6281 | 99 | 99 | 1.31% | 1.58% |  |
| D | 7540 | 6281 | 21 | 21 | 0.28% | 0.33% | 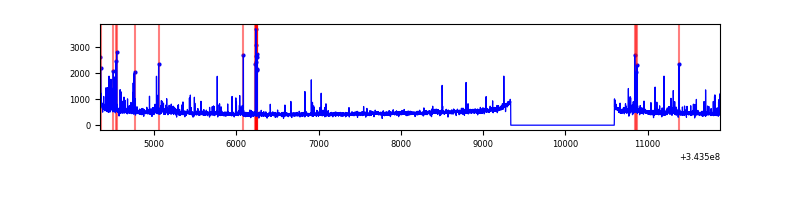 |
Top three noisy pixels from each quadrant. If the there are fewer than three noisy pixels in the level2.evt file, extra rows are filled as -1
| Pixel properties | Quadrant properties | ||||||
|---|---|---|---|---|---|---|---|
| Quadrant | DetID | PixID | Counts | Sigma | Mean | Median | Sigma |
| A | 13 | 248 | 40869 | 244.58 | 810 | 796 | 163.8 |
| A | 13 | 254 | 10671 | 60.27 | 810 | 796 | 163.8 |
| A | 3 | 137 | 7462 | 40.69 | 810 | 796 | 163.8 |
| B | 15 | 33 | 96290 | 622.37 | 810 | 793 | 153.4 |
| B | 0 | 230 | 32820 | 208.72 | 810 | 793 | 153.4 |
| B | 12 | 111 | 18123 | 112.94 | 810 | 793 | 153.4 |
| C | 3 | 233 | 790043 | 4429.47 | 762 | 767 | 178.2 |
| C | 14 | 238 | 124154 | 692.46 | 762 | 767 | 178.2 |
| C | 15 | 208 | 16276 | 87.04 | 762 | 767 | 178.2 |
| D | 2 | 250 | 127532 | 689.82 | 771 | 750 | 183.8 |
| D | 1 | 52 | 124747 | 674.66 | 771 | 750 | 183.8 |
| D | 2 | 234 | 27818 | 147.27 | 771 | 750 | 183.8 |
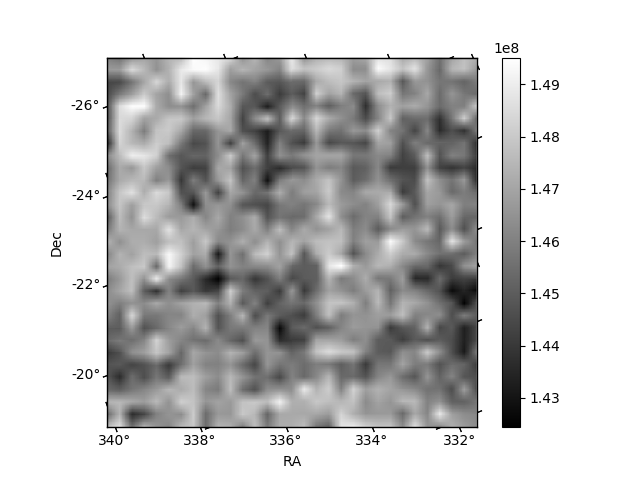
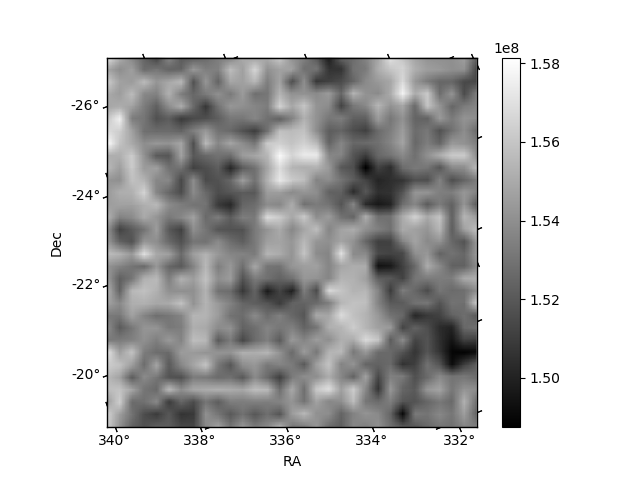
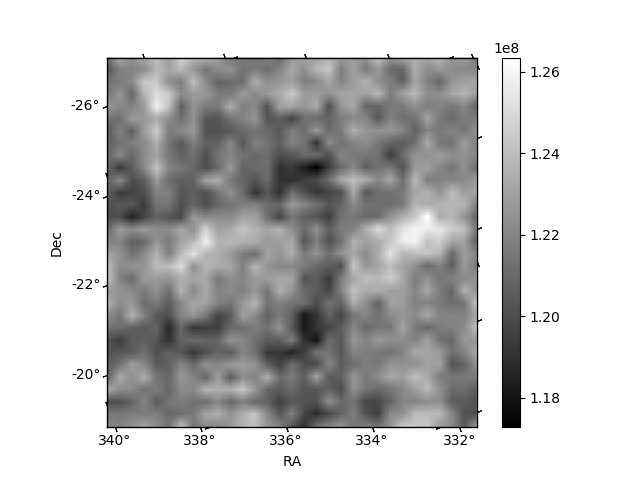
Histogram calculated using DETX and DETY for each event in the final _common_clean file
| Quadrant A | 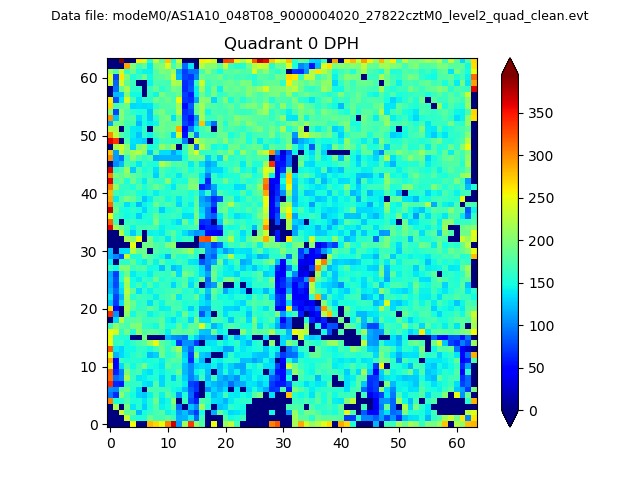 |
 |
Quadrant B |
|---|---|---|---|
| Quadrant D |  |
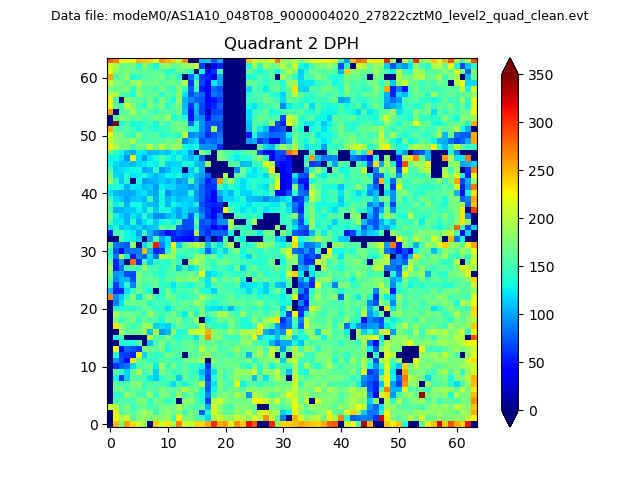 |
Quadrant C |
| Plot type | Count rate plots | Images |
|---|---|---|
| Comparison with Poisson distribution Blue bars denote a histogram of data divided into 1 sec bins. Red curve is a Poisson curve with rate = median count rate of data. |
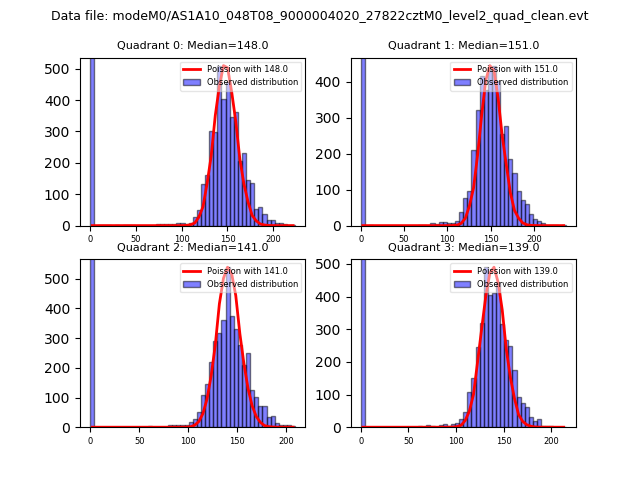 |
 |
| Quadrant-wise count rates Data is divided into 100 sec bins |
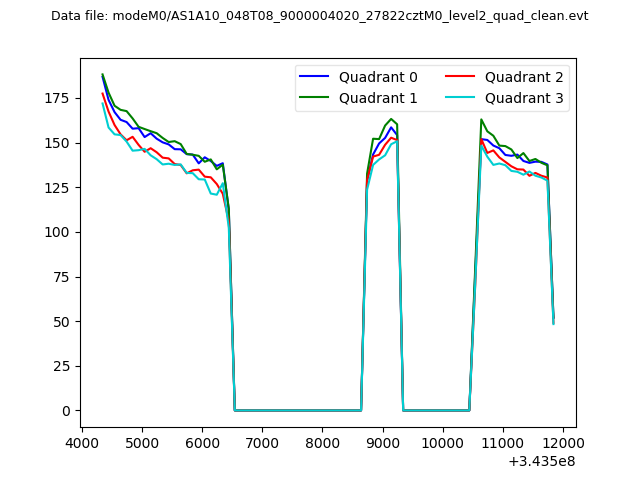 |
|
| Module-wise count rates for Quadrant A Data is divided into 100 sec bins |
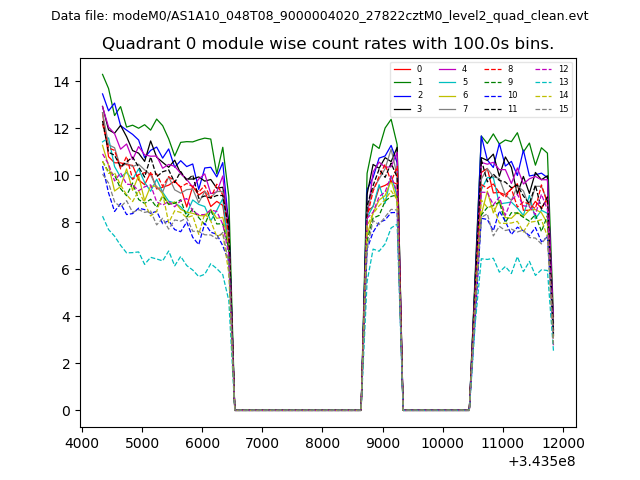 |
 |
| Module-wise count rates for Quadrant B Data is divided into 100 sec bins |
 |
 |
| Module-wise count rates for Quadrant C Data is divided into 100 sec bins |
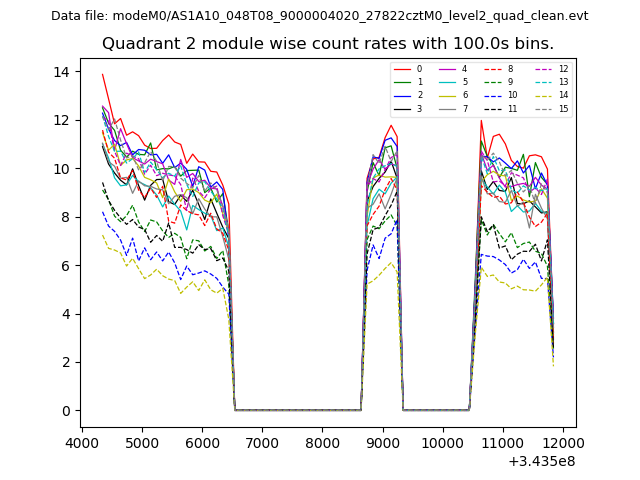 |
 |
| Module-wise count rates for Quadrant D Data is divided into 100 sec bins |
 |
 |
| Parameter | Plot |
|---|---|
| CZT HV Monitor | 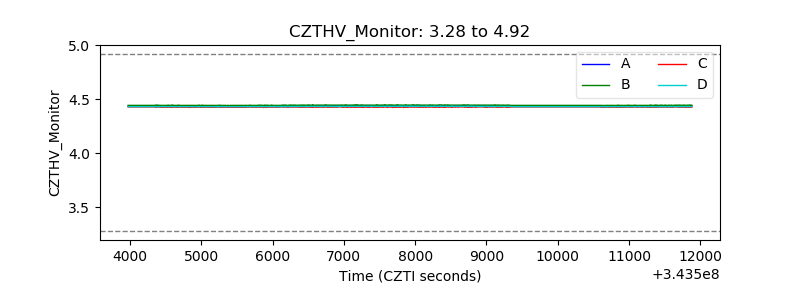 |
| D_VDD | 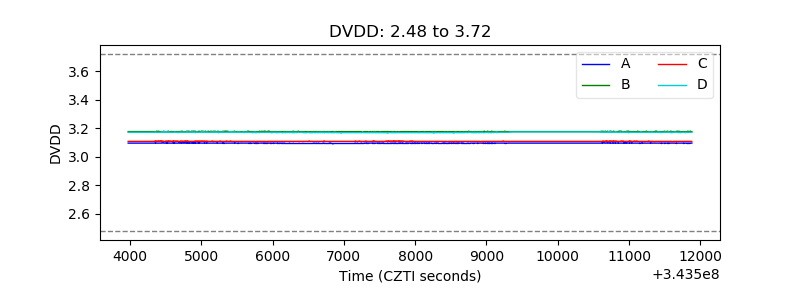 |
| Temperature 1 | 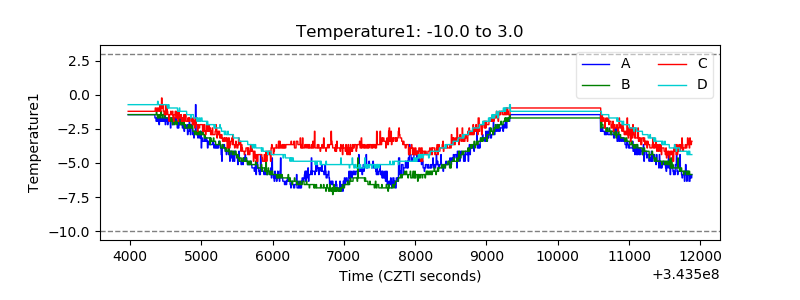 |
| Veto HV Monitor | 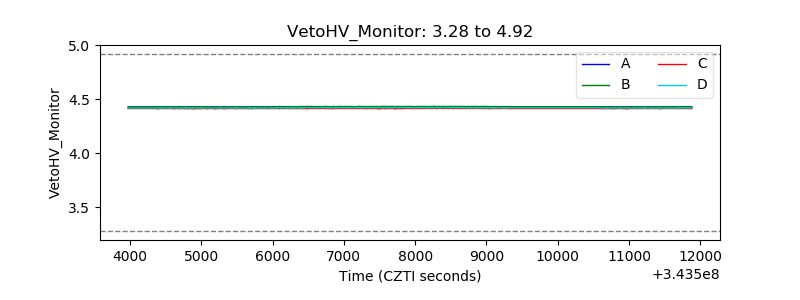 |
| Veto LLD |  |
| Alpha Counter | 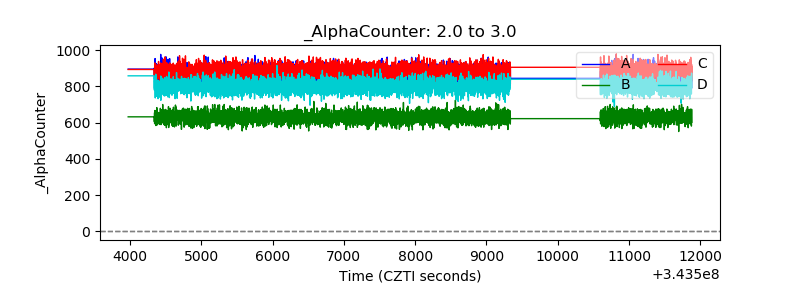 |
| _CPM_Rate | 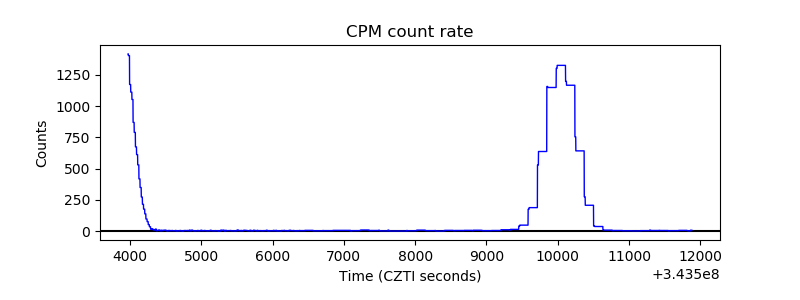 |
| CZT Counter | 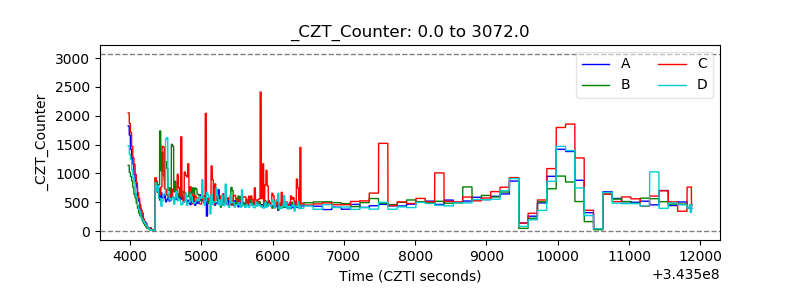 |
| +2.5 Volts monitor | 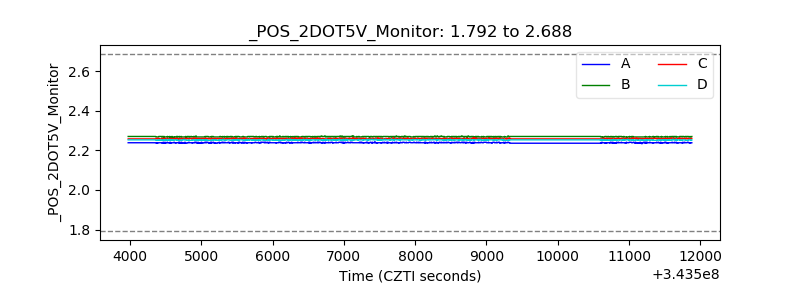 |
| +5 Volts monitor | 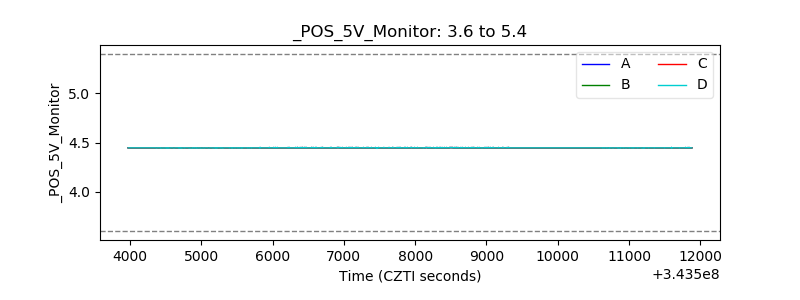 |
| _ROLL_ROT | 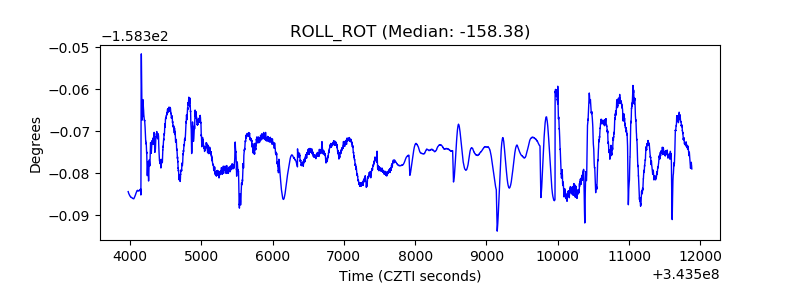 |
| _Roll_DEC | 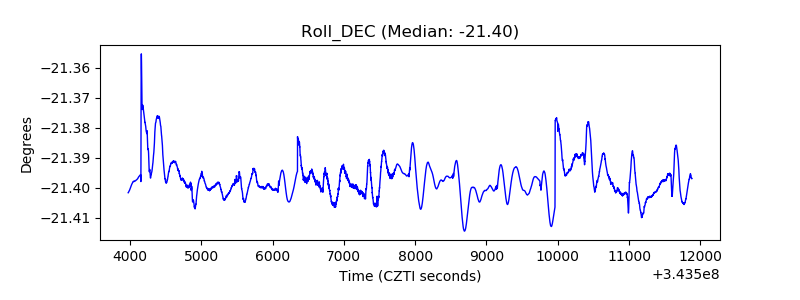 |
| _Roll_RA | 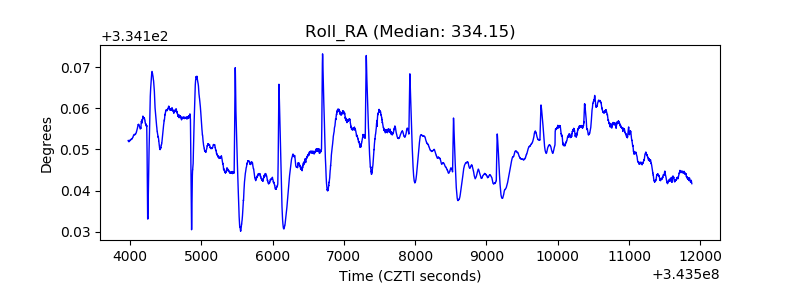 |
| Veto Counter | 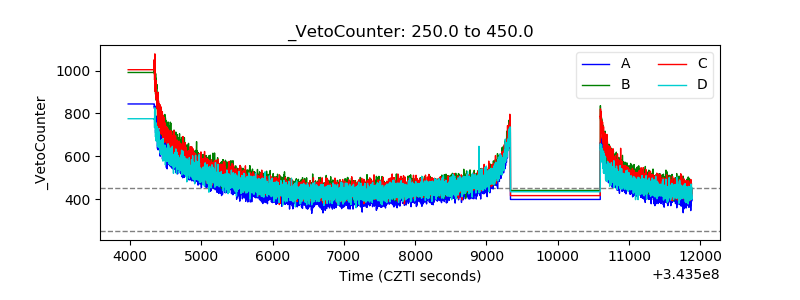 |