| Param | Original file | Final file |
|---|---|---|
| Filename | modeM0/AS1A10_048T08_9000004020_27823cztM0_level2.evt | modeM0/AS1A10_048T08_9000004020_27823cztM0_level2_quad_clean.evt |
| Size (bytes) | 480,047,040 | 94,855,680 |
| Size | 457.8 MB | 90.5 MB |
| Events in quadrant A | 3,249,030 | 617,042 |
| Events in quadrant B | 3,413,158 | 624,934 |
| Events in quadrant C | 3,537,833 | 591,553 |
| Events in quadrant D | 3,882,745 | 571,477 |
| Mode M0 | |||
|---|---|---|---|
| Quadrant | BADHDUFLAG | Total packets | Discarded packets |
| A | 0 | 13952 | 0 |
| B | 0 | 14290 | 0 |
| C | 0 | 14747 | 0 |
| D | 0 | 16057 | 0 |
| Mode M9 | |||
|---|---|---|---|
| Quadrant | BADHDUFLAG | Total packets | Discarded packets |
| A | 0 | 16 | 0 |
| B | 0 | 17 | 0 |
| C | 0 | 17 | 0 |
| D | 0 | 17 | 0 |
| Quadrant | Total seconds | Saturated seconds | Saturation percentage |
|---|---|---|---|
| A | 6714 | 38 | 0.565982% |
| B | 6714 | 78 | 1.161752% |
| C | 6714 | 110 | 1.638368% |
| D | 6714 | 173 | 2.576705% |
Noise dominated data is calculated using 1-second bins in cleaned event files. If a bin has >2000 counts, and if more than 50% of those come from <1% of pixels, then it is considered to be noise-dominated and hence unusable.
| Quadrant | # 1 sec bins | Bins with >0 counts | Bins with >2000 counts | High rate bins dominated by noise | Noise dominated (total time) | Noise dominated (detector-on time) | Marked lightcurve |
|---|---|---|---|---|---|---|---|
| A | 7674 | 6714 | 12 | 12 | 0.16% | 0.18% | 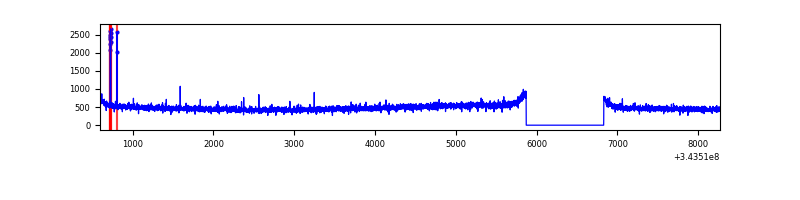 |
| B | 7674 | 6714 | 5 | 5 | 0.07% | 0.07% |  |
| C | 7674 | 6715 | 4 | 4 | 0.05% | 0.06% | 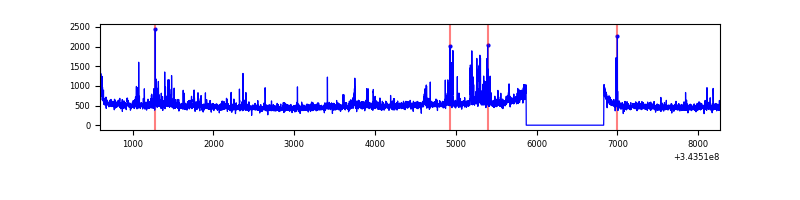 |
| D | 7674 | 6715 | 157 | 157 | 2.05% | 2.34% | 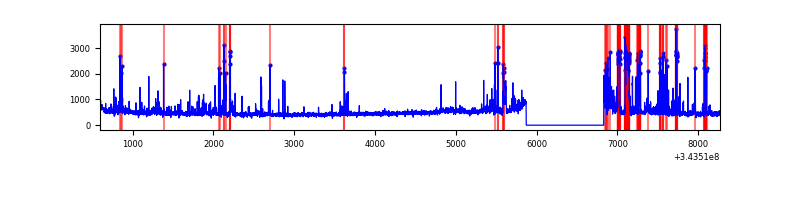 |
Top three noisy pixels from each quadrant. If the there are fewer than three noisy pixels in the level2.evt file, extra rows are filled as -1
| Pixel properties | Quadrant properties | ||||||
|---|---|---|---|---|---|---|---|
| Quadrant | DetID | PixID | Counts | Sigma | Mean | Median | Sigma |
| A | 13 | 248 | 32089 | 188.27 | 833 | 817 | 166.1 |
| A | 13 | 254 | 11101 | 61.91 | 833 | 817 | 166.1 |
| A | 3 | 137 | 7825 | 42.19 | 833 | 817 | 166.1 |
| B | 5 | 172 | 56614 | 350.95 | 831 | 813 | 159.0 |
| B | 0 | 190 | 31498 | 192.99 | 831 | 813 | 159.0 |
| B | 12 | 111 | 19472 | 117.35 | 831 | 813 | 159.0 |
| C | 3 | 233 | 300894 | 1592.91 | 796 | 801 | 188.4 |
| C | 14 | 238 | 128741 | 679.11 | 796 | 801 | 188.4 |
| C | 13 | 61 | 5601 | 25.48 | 796 | 801 | 188.4 |
| D | 1 | 52 | 607265 | 3189.83 | 791 | 769 | 190.1 |
| D | 2 | 250 | 192171 | 1006.67 | 791 | 769 | 190.1 |
| D | 2 | 234 | 29025 | 148.61 | 791 | 769 | 190.1 |
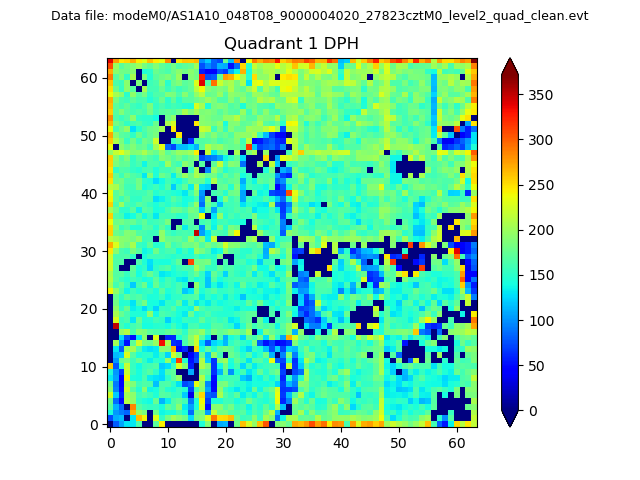
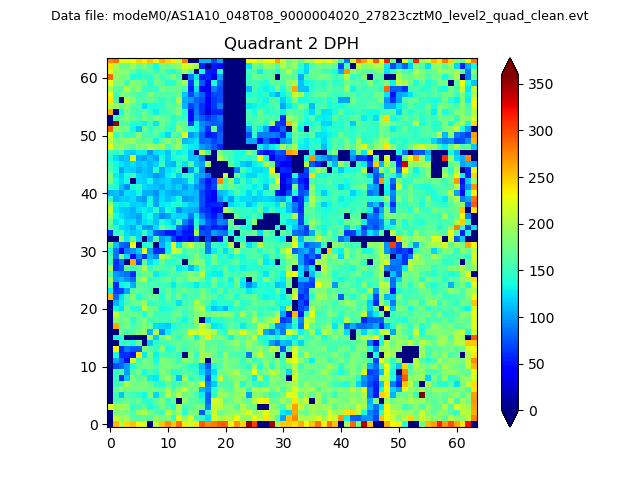
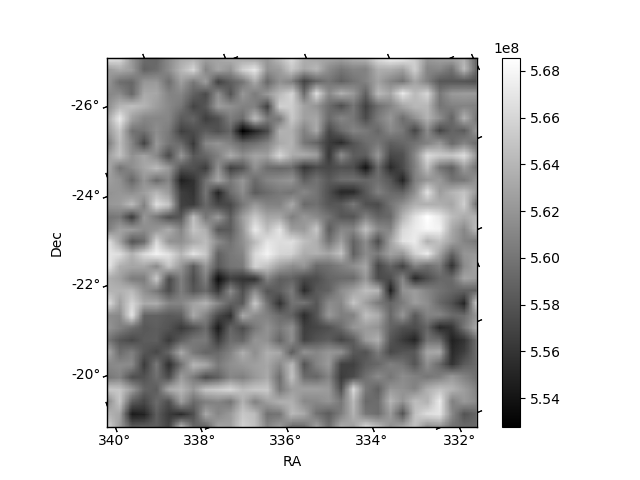
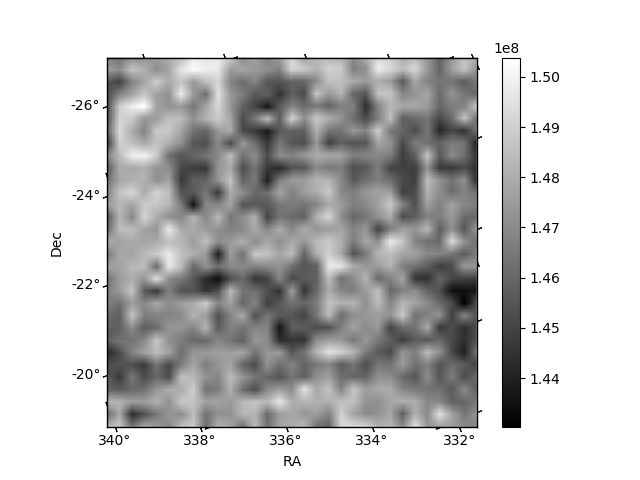
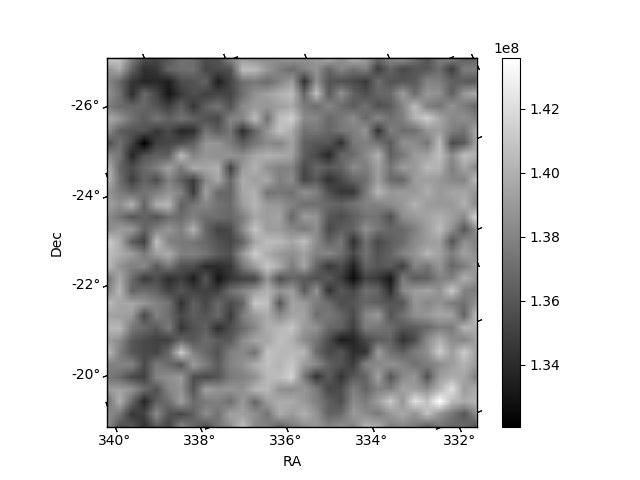
Histogram calculated using DETX and DETY for each event in the final _common_clean file
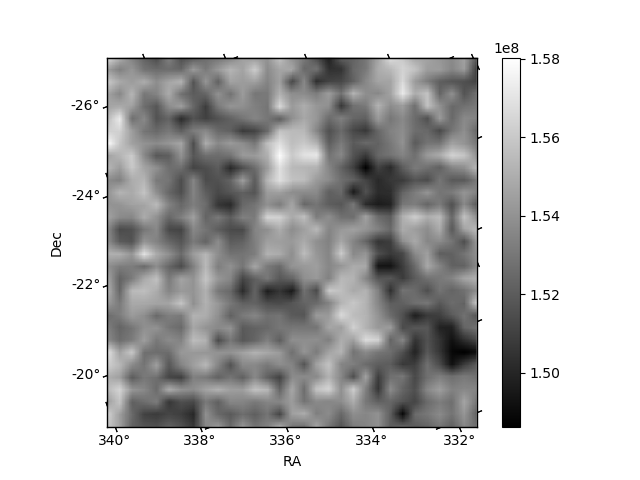
| Quadrant A | 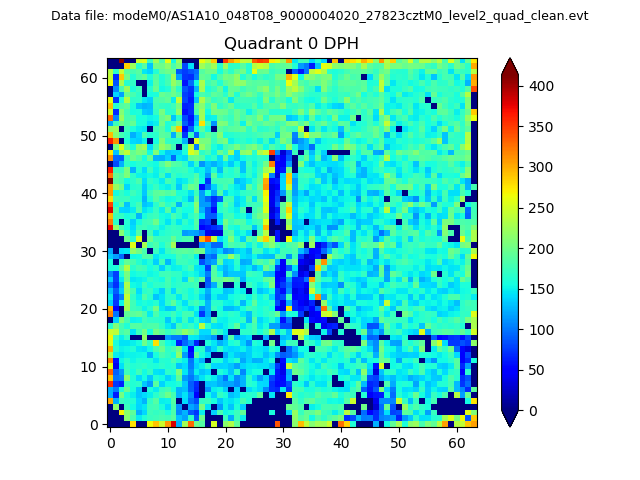 |
 |
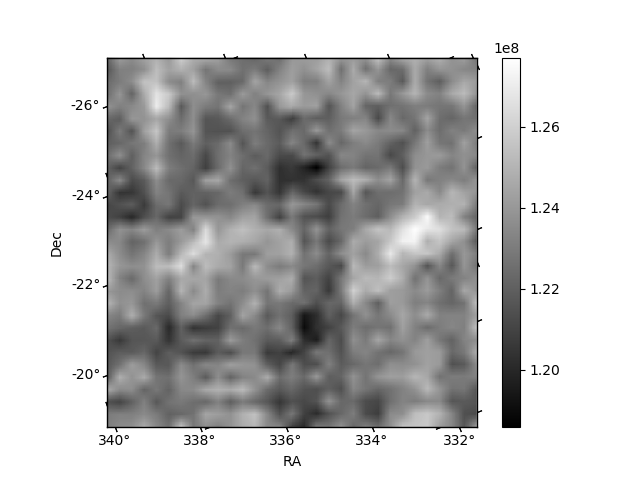
Quadrant B |
|---|---|---|---|
| Quadrant D | 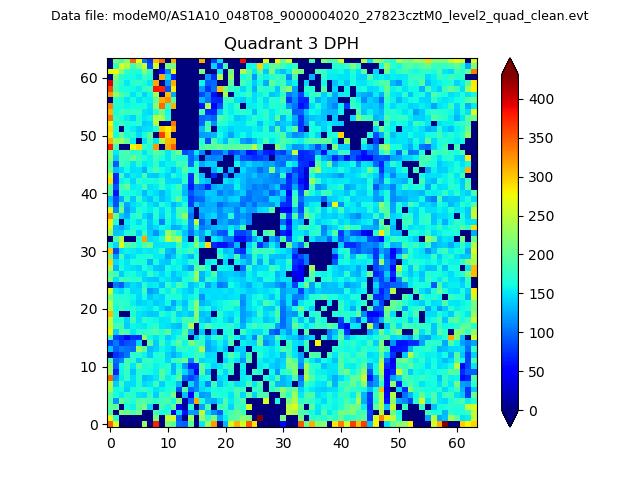 |
 |
Quadrant C |
| Plot type | Count rate plots | Images |
|---|---|---|
| Comparison with Poisson distribution Blue bars denote a histogram of data divided into 1 sec bins. Red curve is a Poisson curve with rate = median count rate of data. |
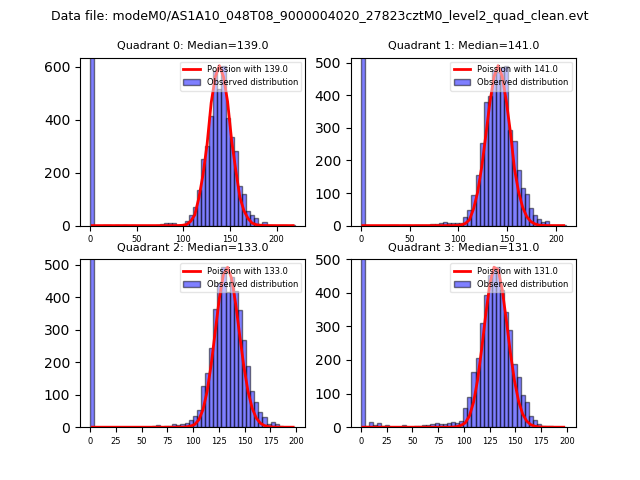 |
 |
| Quadrant-wise count rates Data is divided into 100 sec bins |
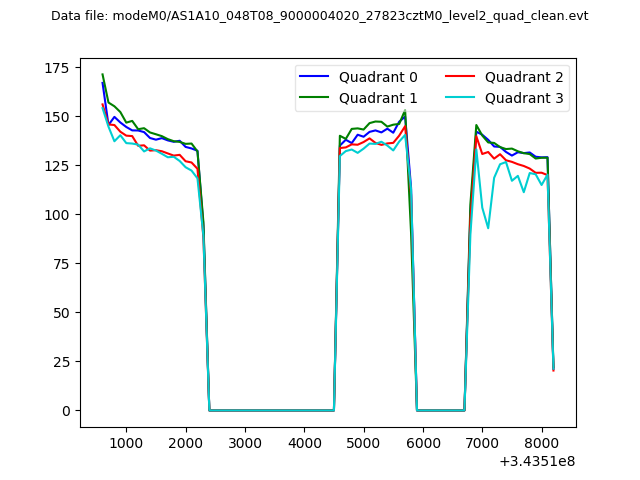 |
|
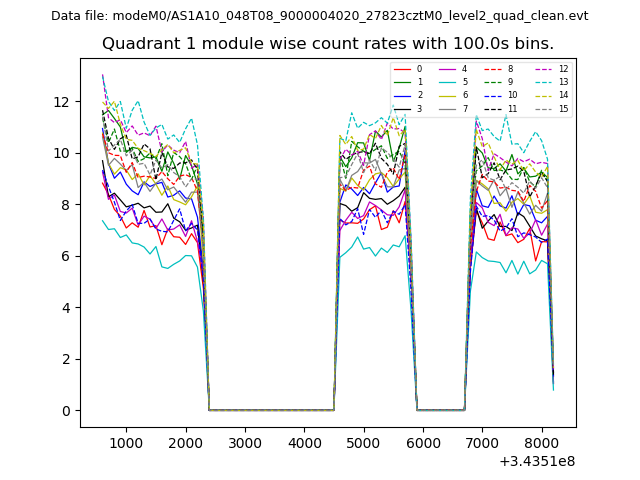
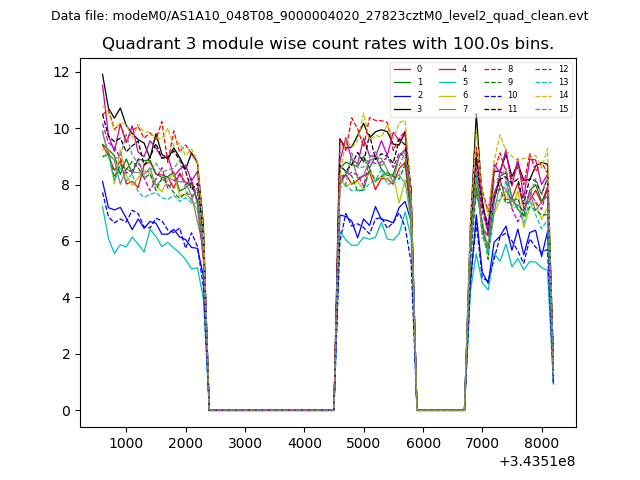
| Module-wise count rates for Quadrant A Data is divided into 100 sec bins |
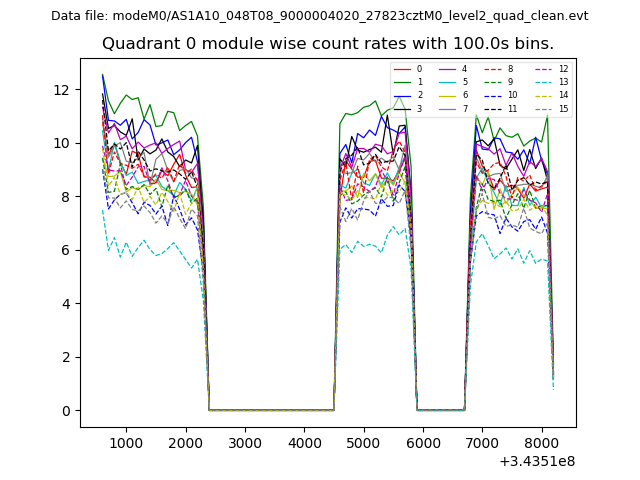 |
 |
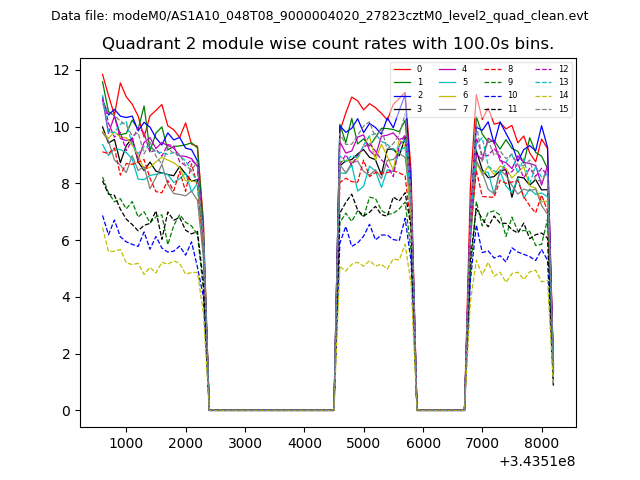
| Module-wise count rates for Quadrant B Data is divided into 100 sec bins |
 |
 |
| Module-wise count rates for Quadrant C Data is divided into 100 sec bins |
 |
 |
| Module-wise count rates for Quadrant D Data is divided into 100 sec bins |
 |
 |
| Parameter | Plot |
|---|---|
| CZT HV Monitor | 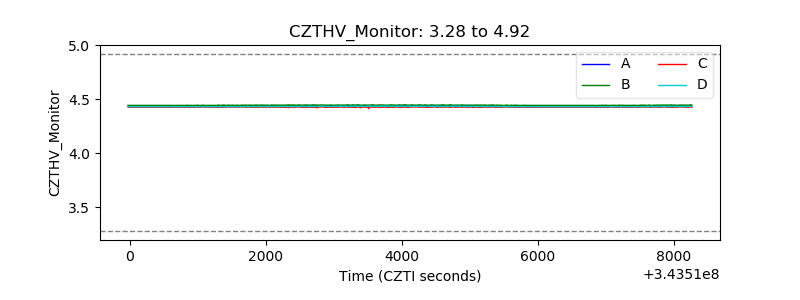 |
| D_VDD | 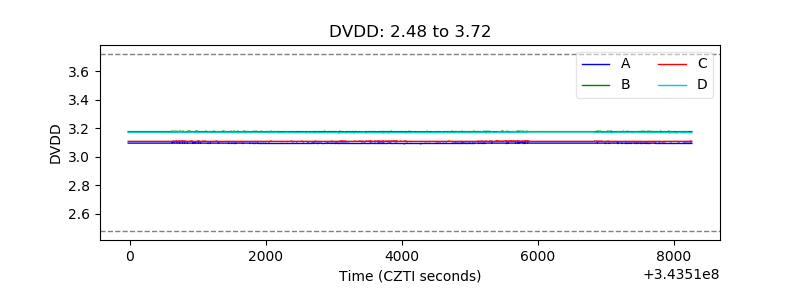 |
| Temperature 1 | 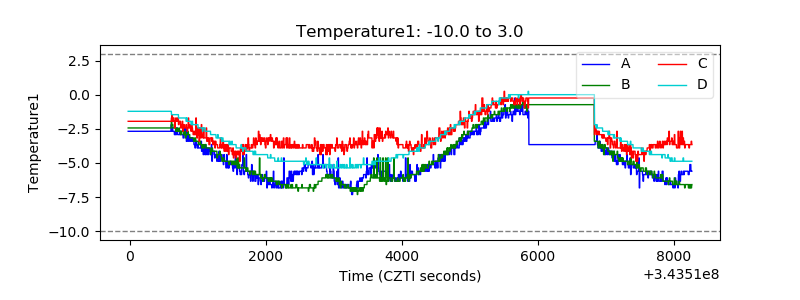 |
| Veto HV Monitor | 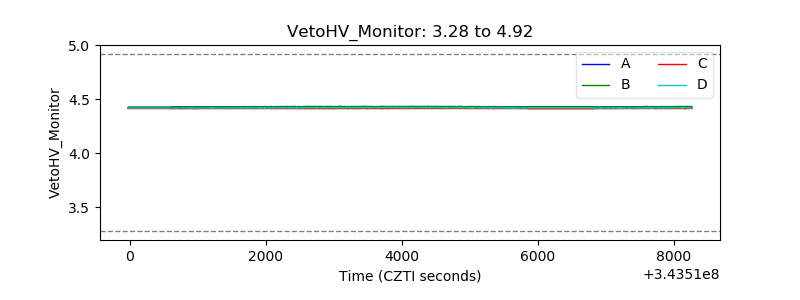 |
| Veto LLD | 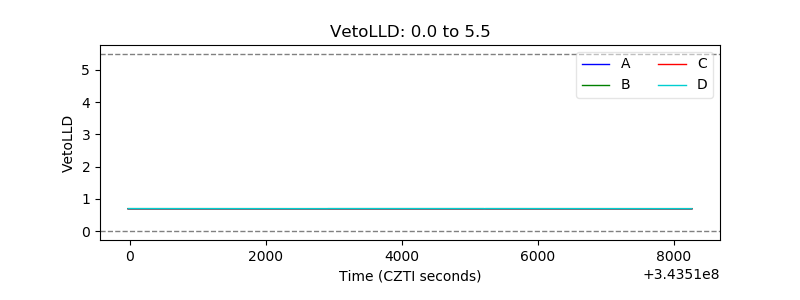 |
| Alpha Counter | 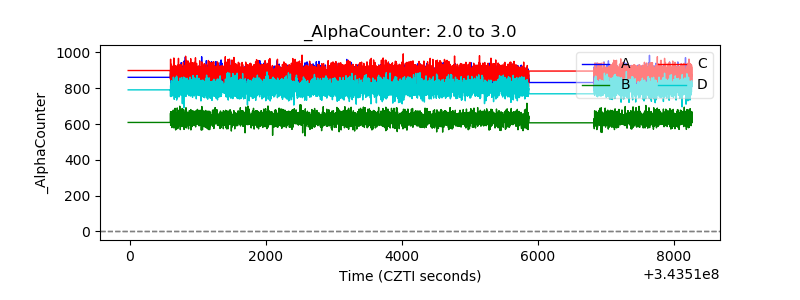 |
| _CPM_Rate | 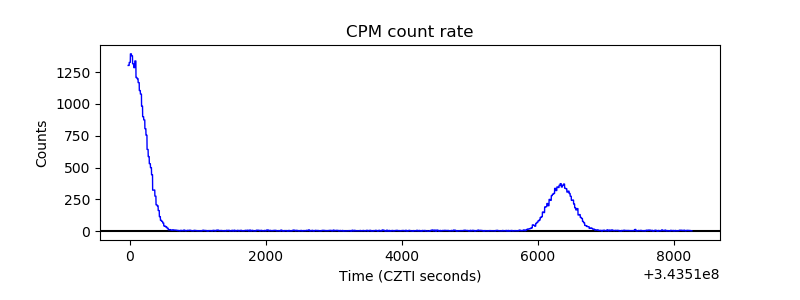 |
| CZT Counter | 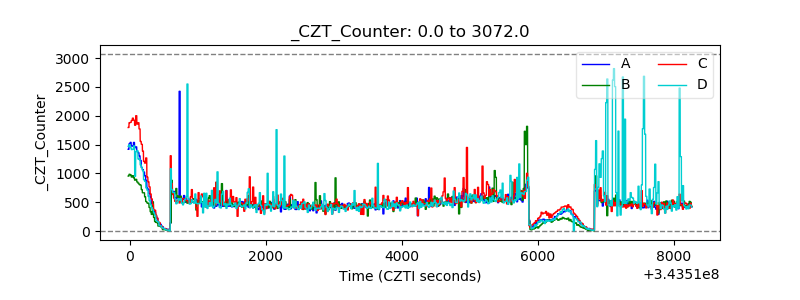 |
| +2.5 Volts monitor |  |
| +5 Volts monitor |  |
| _ROLL_ROT | 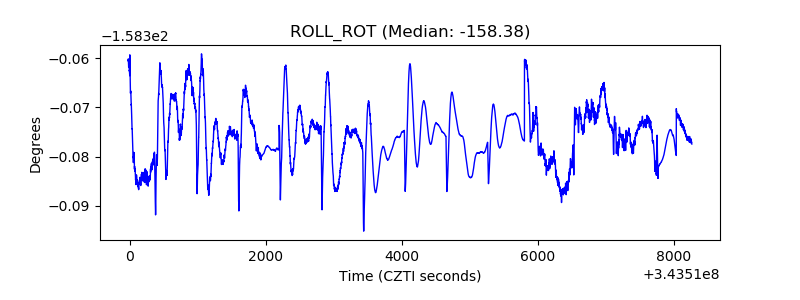 |
| _Roll_DEC | 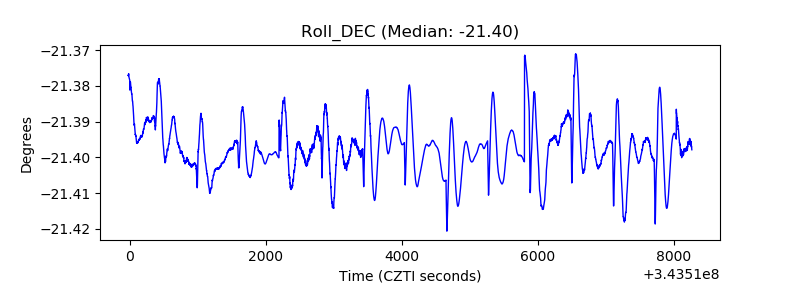 |
| _Roll_RA | 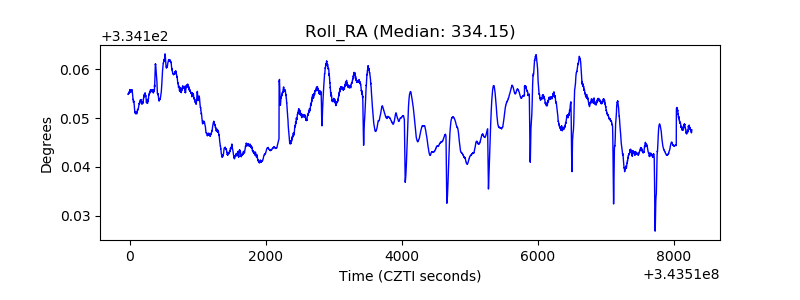 |
| Veto Counter | 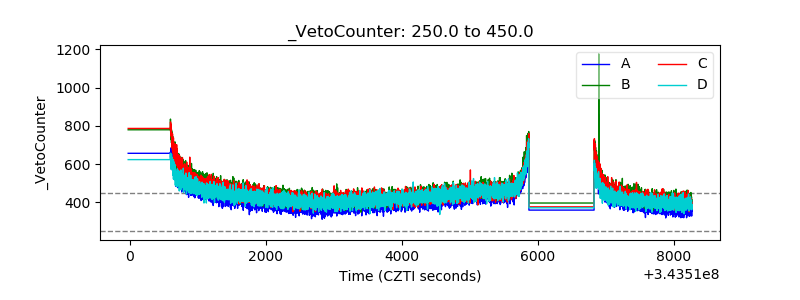 |