| Param | Original file | Final file |
|---|---|---|
| Filename | modeM0/AS1A10_048T08_9000004020_27824cztM0_level2.evt | modeM0/AS1A10_048T08_9000004020_27824cztM0_level2_quad_clean.evt |
| Size (bytes) | 533,767,680 | 90,990,720 |
| Size | 509.0 MB | 86.8 MB |
| Events in quadrant A | 3,374,147 | 585,222 |
| Events in quadrant B | 3,714,926 | 587,078 |
| Events in quadrant C | 3,877,341 | 559,515 |
| Events in quadrant D | 4,709,693 | 521,655 |
| Mode M0 | |||
|---|---|---|---|
| Quadrant | BADHDUFLAG | Total packets | Discarded packets |
| A | 0 | 14711 | 0 |
| B | 0 | 15677 | 0 |
| C | 0 | 16250 | 0 |
| D | 0 | 18903 | 0 |
| Mode M9 | |||
|---|---|---|---|
| Quadrant | BADHDUFLAG | Total packets | Discarded packets |
| A | 0 | 14 | 0 |
| B | 0 | 15 | 0 |
| C | 0 | 15 | 0 |
| D | 0 | 15 | 0 |
| Quadrant | Total seconds | Saturated seconds | Saturation percentage |
|---|---|---|---|
| A | 7207 | 17 | 0.235882% |
| B | 7207 | 104 | 1.443041% |
| C | 7207 | 94 | 1.304287% |
| D | 7207 | 363 | 5.036770% |
Noise dominated data is calculated using 1-second bins in cleaned event files. If a bin has >2000 counts, and if more than 50% of those come from <1% of pixels, then it is considered to be noise-dominated and hence unusable.
| Quadrant | # 1 sec bins | Bins with >0 counts | Bins with >2000 counts | High rate bins dominated by noise | Noise dominated (total time) | Noise dominated (detector-on time) | Marked lightcurve |
|---|---|---|---|---|---|---|---|
| A | 7832 | 7208 | 0 | 0 | 0.00% | 0.00% | 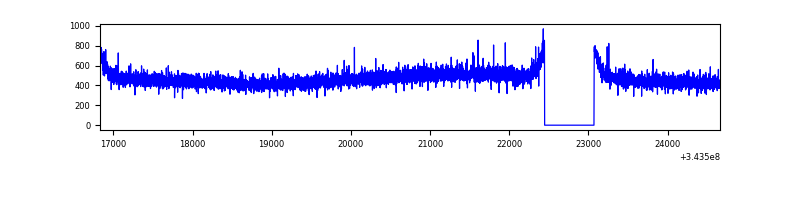 |
| B | 7832 | 7207 | 42 | 42 | 0.54% | 0.58% | 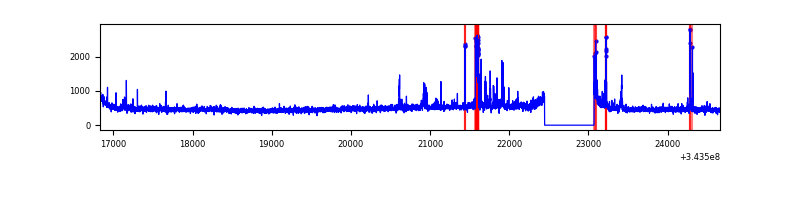 |
| C | 7832 | 7208 | 13 | 13 | 0.17% | 0.18% | 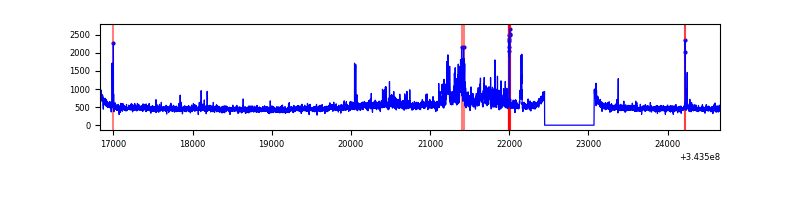 |
| D | 7832 | 7208 | 348 | 348 | 4.44% | 4.83% | 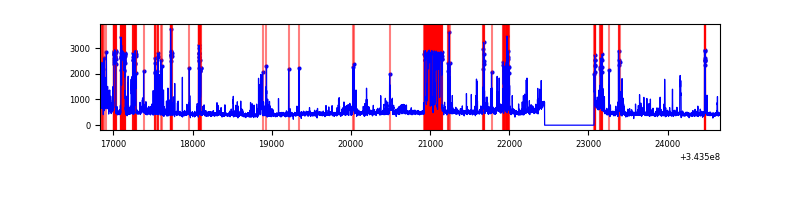 |
Top three noisy pixels from each quadrant. If the there are fewer than three noisy pixels in the level2.evt file, extra rows are filled as -1
| Pixel properties | Quadrant properties | ||||||
|---|---|---|---|---|---|---|---|
| Quadrant | DetID | PixID | Counts | Sigma | Mean | Median | Sigma |
| A | 13 | 254 | 12817 | 67.45 | 872 | 854 | 177.4 |
| A | 3 | 137 | 8293 | 41.94 | 872 | 854 | 177.4 |
| A | 0 | 226 | 7490 | 37.42 | 872 | 854 | 177.4 |
| B | 5 | 172 | 84272 | 497.29 | 867 | 844 | 167.8 |
| B | 10 | 245 | 81932 | 483.34 | 867 | 844 | 167.8 |
| B | 0 | 230 | 30950 | 179.45 | 867 | 844 | 167.8 |
| C | 3 | 233 | 491163 | 2496.29 | 833 | 838 | 196.4 |
| C | 14 | 238 | 132197 | 668.76 | 833 | 838 | 196.4 |
| C | 13 | 61 | 5755 | 25.03 | 833 | 838 | 196.4 |
| D | 1 | 52 | 1274856 | 6394.62 | 814 | 791 | 199.2 |
| D | 2 | 250 | 233705 | 1169.01 | 814 | 791 | 199.2 |
| D | 12 | 233 | 72632 | 360.57 | 814 | 791 | 199.2 |
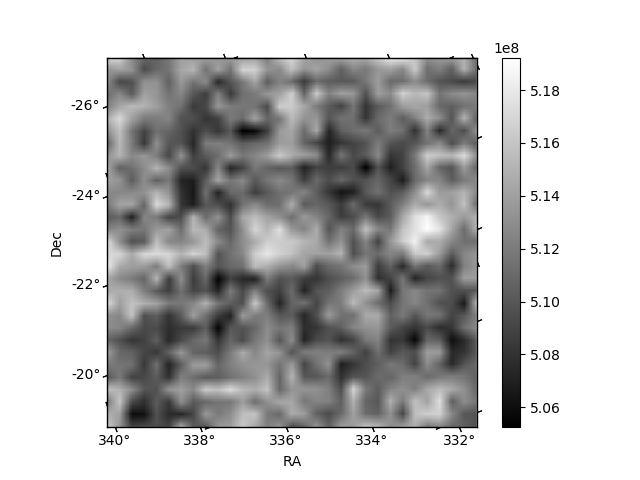
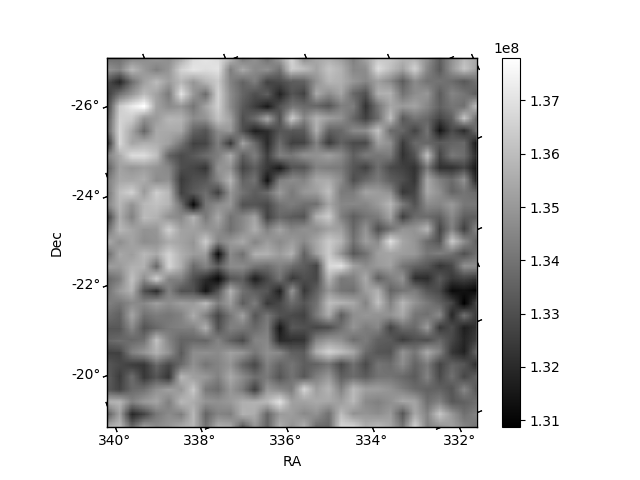
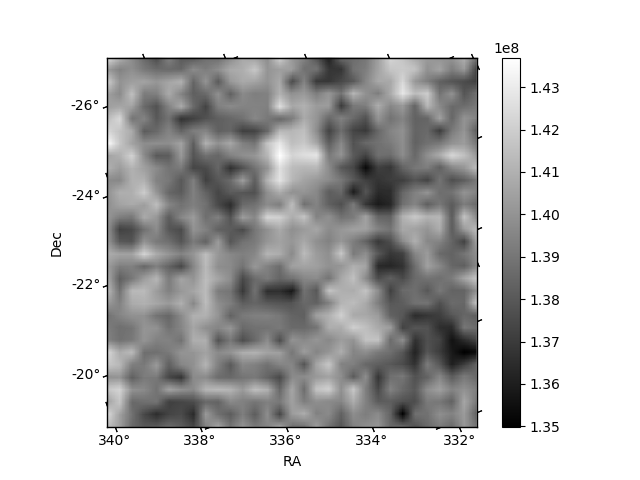
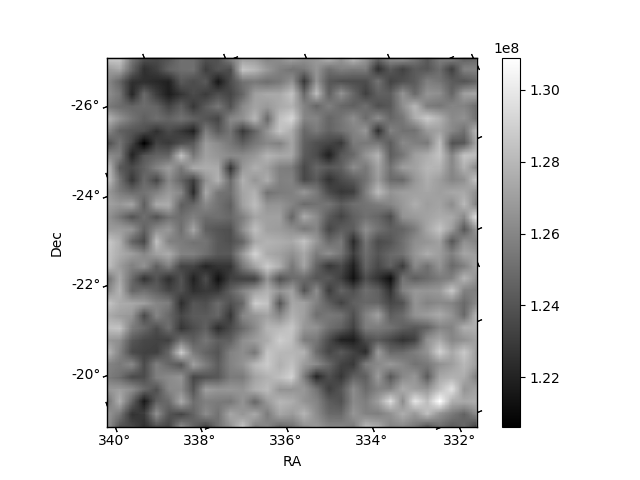
Histogram calculated using DETX and DETY for each event in the final _common_clean file
| Quadrant A | 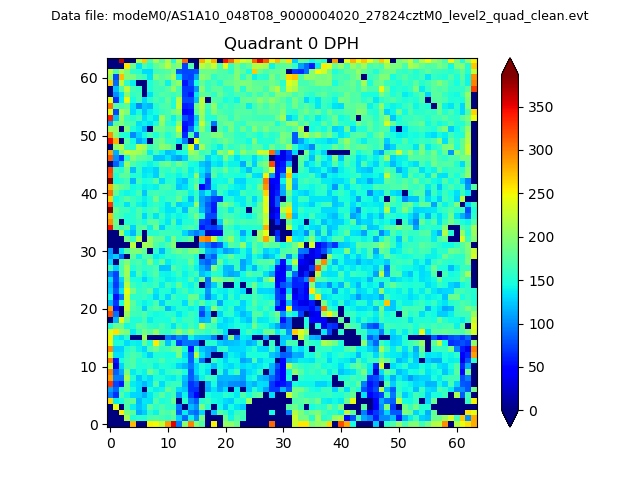 |
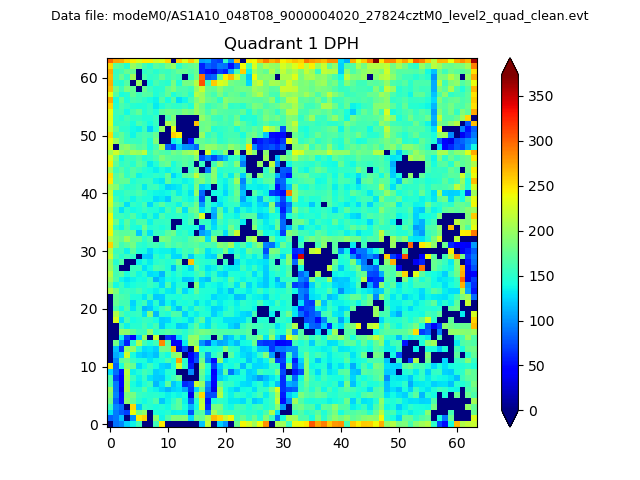 |
Quadrant B |
|---|---|---|---|
| Quadrant D | 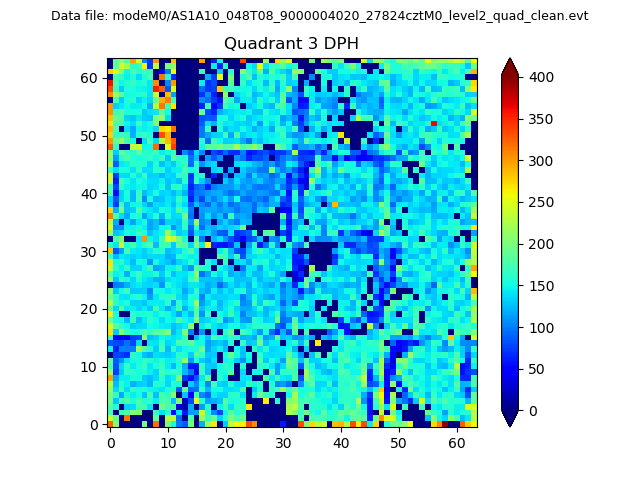 |
 |
Quadrant C |
| Plot type | Count rate plots | Images |
|---|---|---|
| Comparison with Poisson distribution Blue bars denote a histogram of data divided into 1 sec bins. Red curve is a Poisson curve with rate = median count rate of data. |
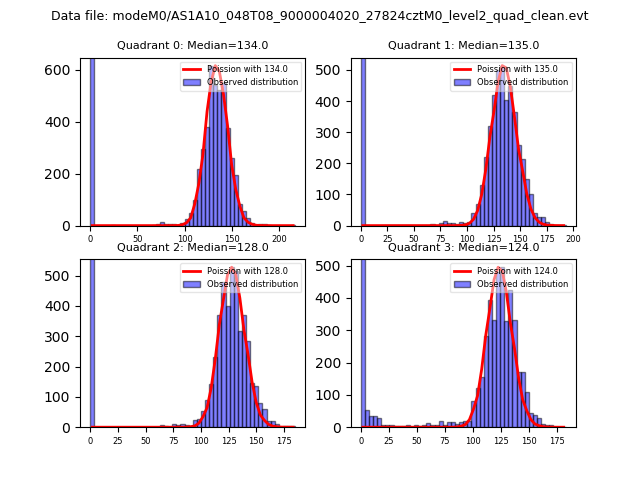 |
 |
| Quadrant-wise count rates Data is divided into 100 sec bins |
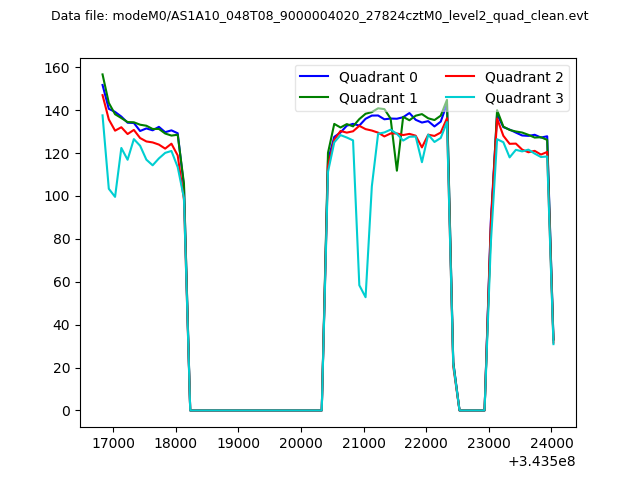 |
|
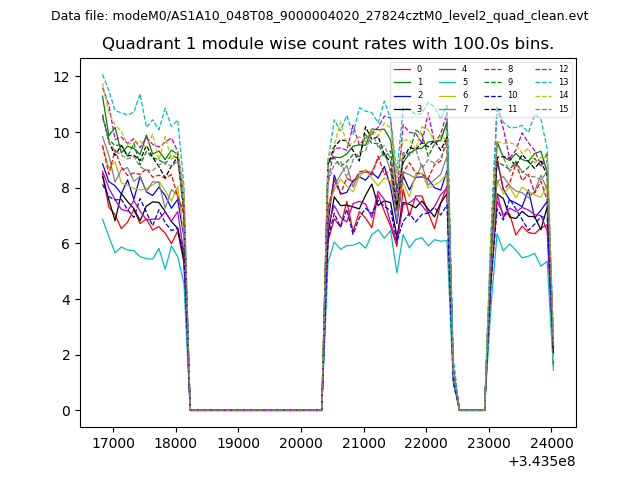
| Module-wise count rates for Quadrant A Data is divided into 100 sec bins |
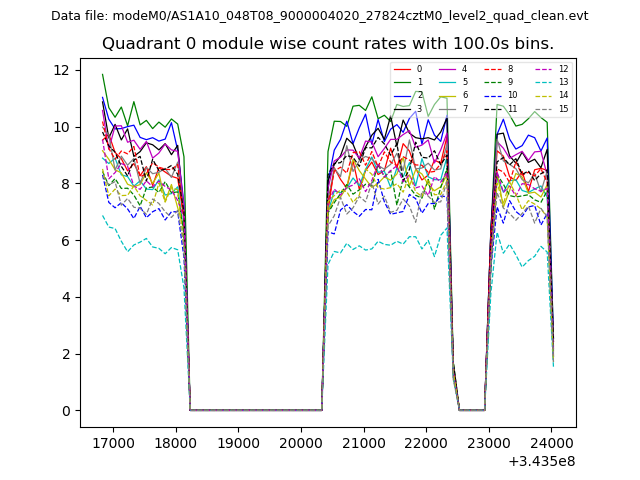 |
 |
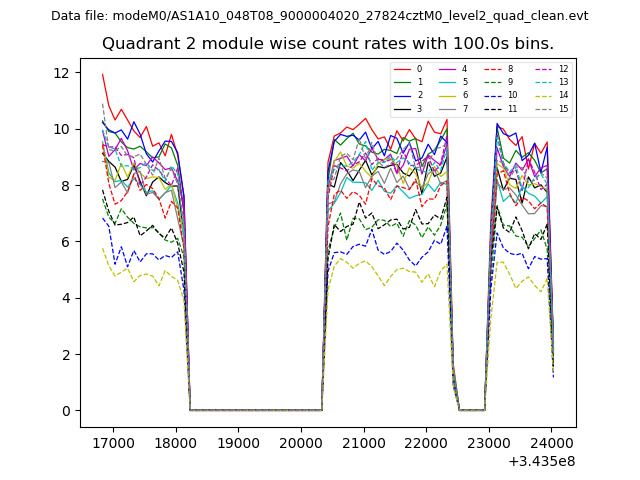
| Module-wise count rates for Quadrant B Data is divided into 100 sec bins |
 |
 |
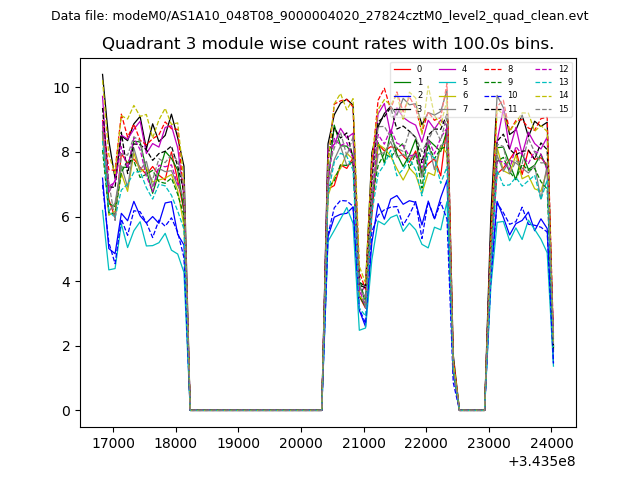
| Module-wise count rates for Quadrant C Data is divided into 100 sec bins |
 |
 |
| Module-wise count rates for Quadrant D Data is divided into 100 sec bins |
 |
 |
| Parameter | Plot |
|---|---|
| CZT HV Monitor | 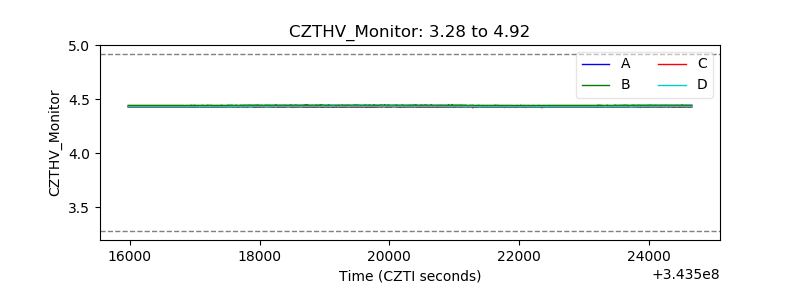 |
| D_VDD | 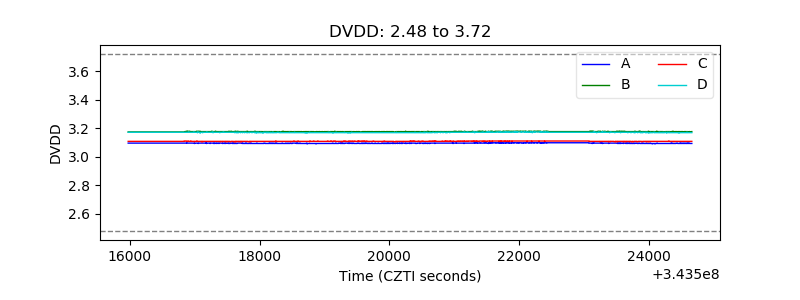 |
| Temperature 1 | 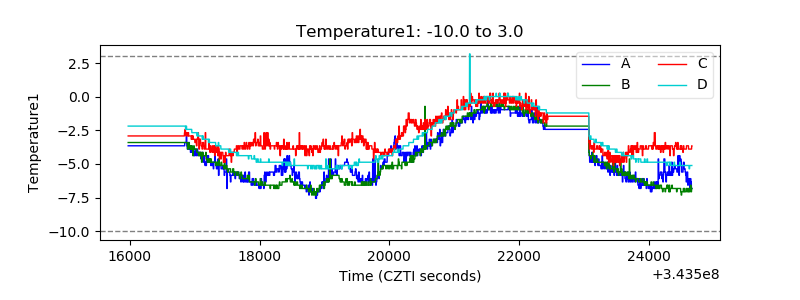 |
| Veto HV Monitor | 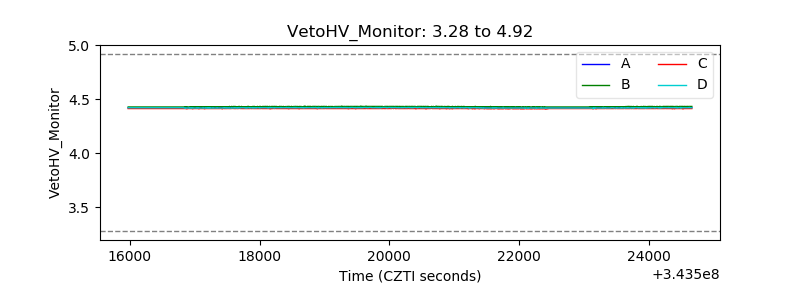 |
| Veto LLD | 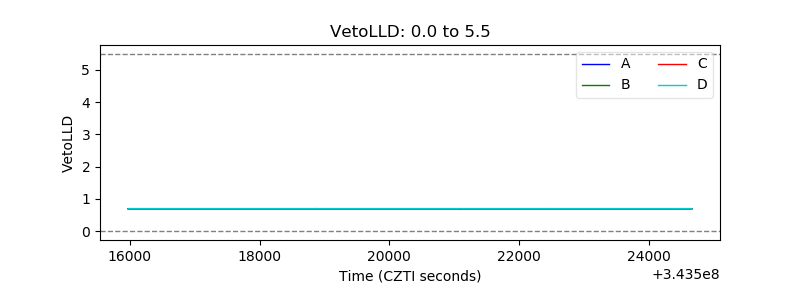 |
| Alpha Counter | 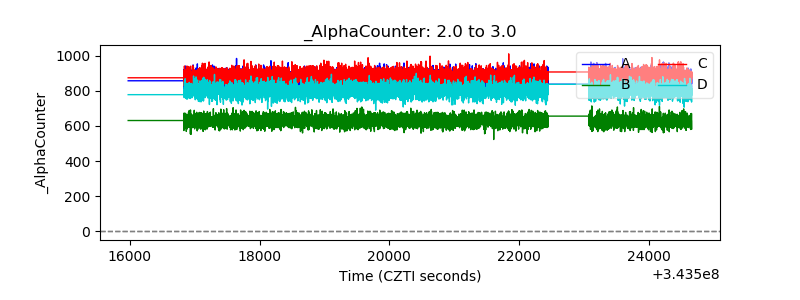 |
| _CPM_Rate | 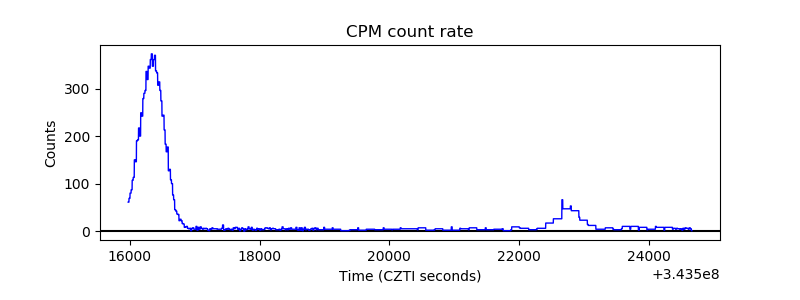 |
| CZT Counter | 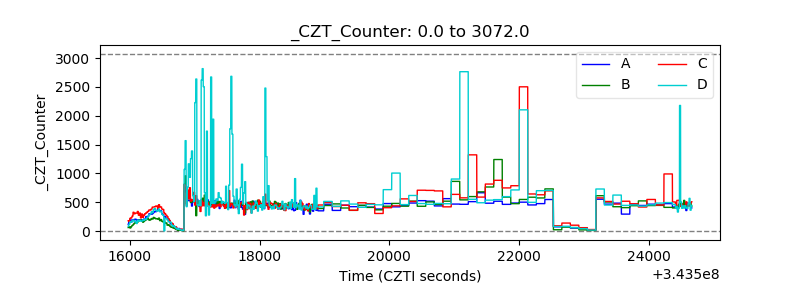 |
| +2.5 Volts monitor |  |
| +5 Volts monitor |  |
| _ROLL_ROT | 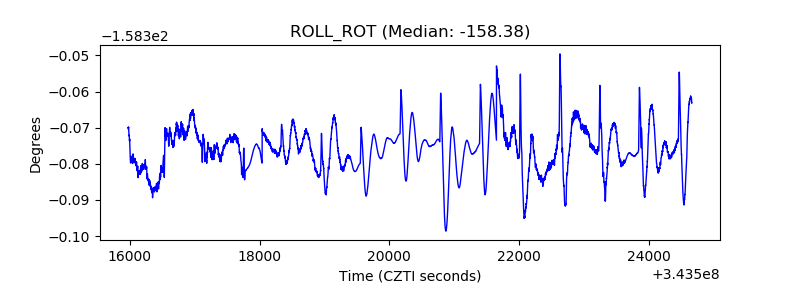 |
| _Roll_DEC | 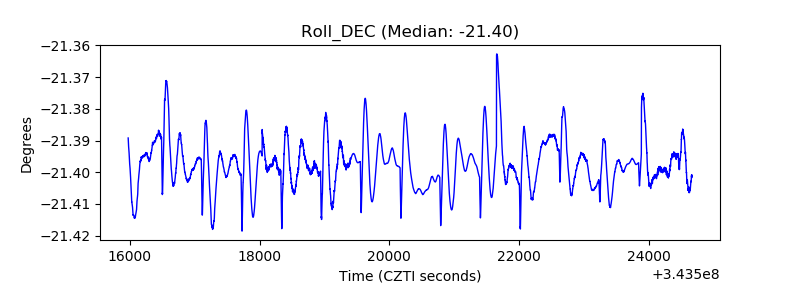 |
| _Roll_RA | 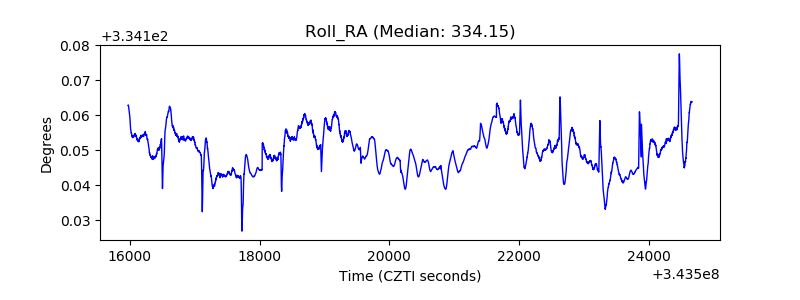 |
| Veto Counter | 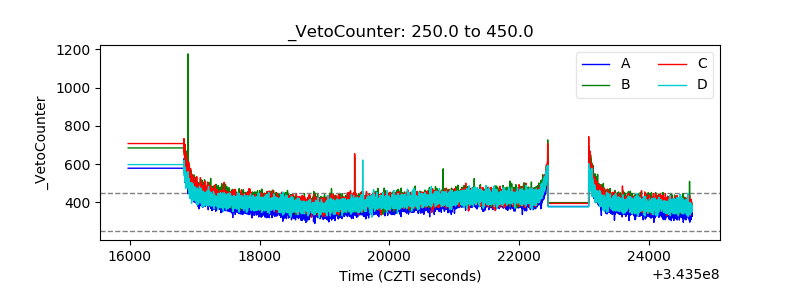 |