| Param | Original file | Final file |
|---|---|---|
| Filename | modeM0/AS1A10_048T08_9000004020_27825cztM0_level2.evt | modeM0/AS1A10_048T08_9000004020_27825cztM0_level2_quad_clean.evt |
| Size (bytes) | 577,082,880 | 90,072,000 |
| Size | 550.3 MB | 85.9 MB |
| Events in quadrant A | 3,568,217 | 565,060 |
| Events in quadrant B | 3,921,796 | 566,827 |
| Events in quadrant C | 4,091,026 | 539,906 |
| Events in quadrant D | 5,381,829 | 528,326 |
| Mode M0 | |||
|---|---|---|---|
| Quadrant | BADHDUFLAG | Total packets | Discarded packets |
| A | 0 | 15639 | 0 |
| B | 0 | 16501 | 0 |
| C | 0 | 17035 | 0 |
| D | 0 | 21162 | 0 |
| Mode M9 | |||
|---|---|---|---|
| Quadrant | BADHDUFLAG | Total packets | Discarded packets |
| A | 0 | 4 | 0 |
| B | 0 | 4 | 0 |
| C | 0 | 4 | 0 |
| D | 0 | 4 | 0 |
| Quadrant | Total seconds | Saturated seconds | Saturation percentage |
|---|---|---|---|
| A | 7586 | 43 | 0.566834% |
| B | 7587 | 159 | 2.095690% |
| C | 7587 | 171 | 2.253855% |
| D | 7587 | 515 | 6.787927% |
Noise dominated data is calculated using 1-second bins in cleaned event files. If a bin has >2000 counts, and if more than 50% of those come from <1% of pixels, then it is considered to be noise-dominated and hence unusable.
| Quadrant | # 1 sec bins | Bins with >0 counts | Bins with >2000 counts | High rate bins dominated by noise | Noise dominated (total time) | Noise dominated (detector-on time) | Marked lightcurve |
|---|---|---|---|---|---|---|---|
| A | 7886 | 7586 | 0 | 0 | 0.00% | 0.00% | 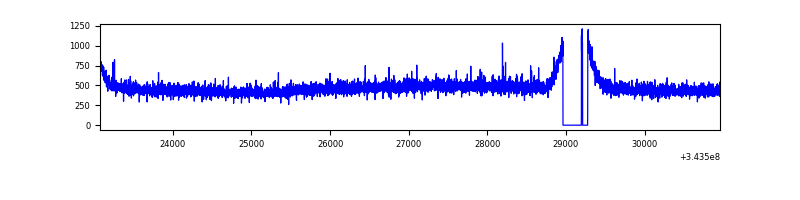 |
| B | 7887 | 7587 | 72 | 72 | 0.91% | 0.95% | 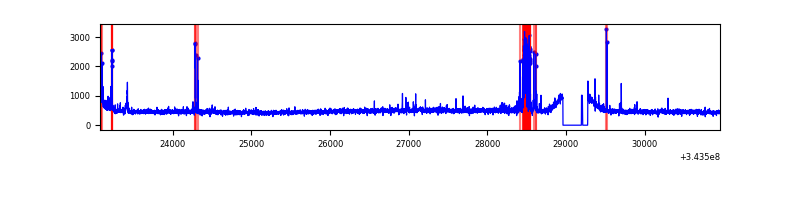 |
| C | 7887 | 7587 | 27 | 27 | 0.34% | 0.36% | 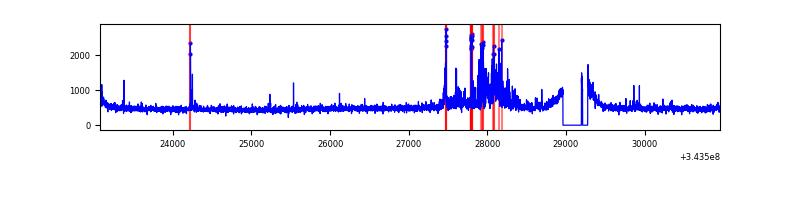 |
| D | 7887 | 7588 | 483 | 483 | 6.12% | 6.37% |  |
Top three noisy pixels from each quadrant. If the there are fewer than three noisy pixels in the level2.evt file, extra rows are filled as -1
| Pixel properties | Quadrant properties | ||||||
|---|---|---|---|---|---|---|---|
| Quadrant | DetID | PixID | Counts | Sigma | Mean | Median | Sigma |
| A | 13 | 254 | 12957 | 64.46 | 921 | 899 | 187.1 |
| A | 3 | 137 | 9032 | 43.47 | 921 | 899 | 187.1 |
| A | 0 | 226 | 7875 | 37.29 | 921 | 899 | 187.1 |
| B | 10 | 245 | 244984 | 1374.08 | 915 | 891 | 177.6 |
| B | 0 | 229 | 25067 | 136.09 | 915 | 891 | 177.6 |
| B | 12 | 111 | 22050 | 119.11 | 915 | 891 | 177.6 |
| C | 3 | 233 | 499361 | 2393.87 | 879 | 885 | 208.2 |
| C | 14 | 238 | 141233 | 674.0 | 879 | 885 | 208.2 |
| C | 6 | 112 | 9073 | 39.32 | 879 | 885 | 208.2 |
| D | 1 | 52 | 1938569 | 9220.28 | 871 | 846 | 210.2 |
| D | 2 | 250 | 82443 | 388.26 | 871 | 846 | 210.2 |
| D | 2 | 234 | 32437 | 150.32 | 871 | 846 | 210.2 |
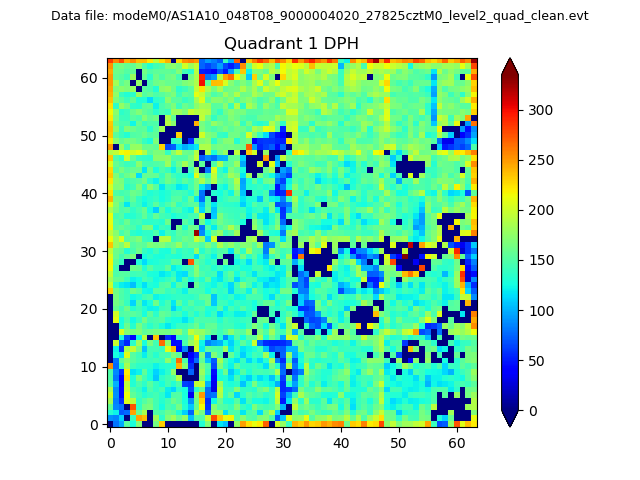
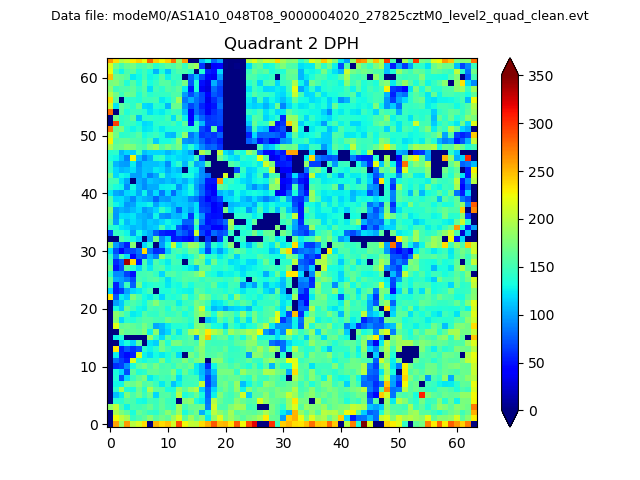
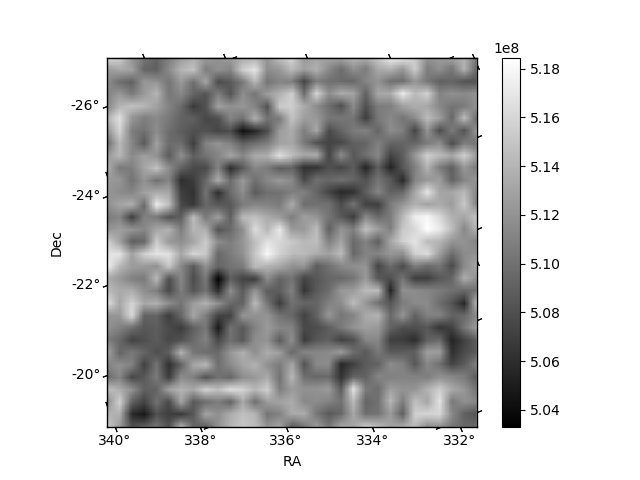
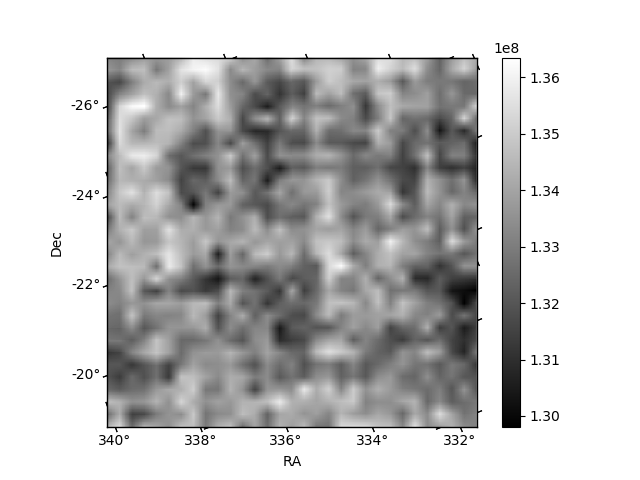
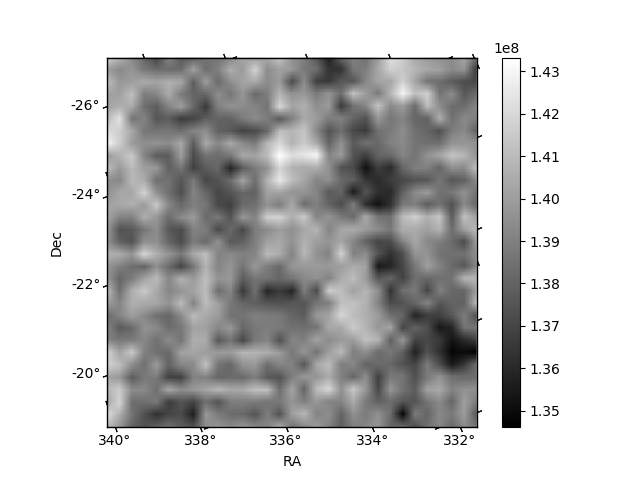
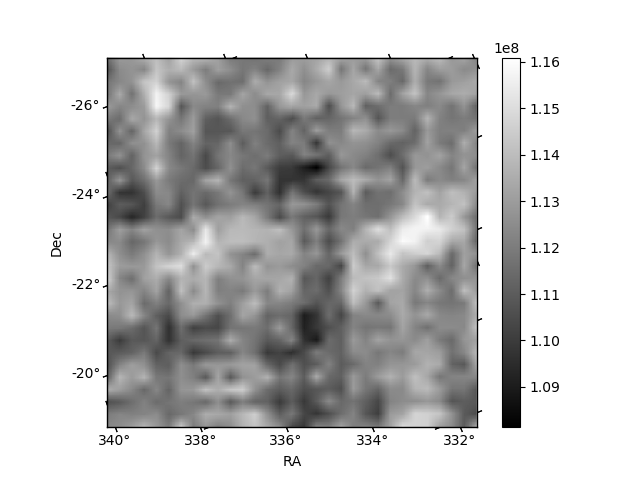
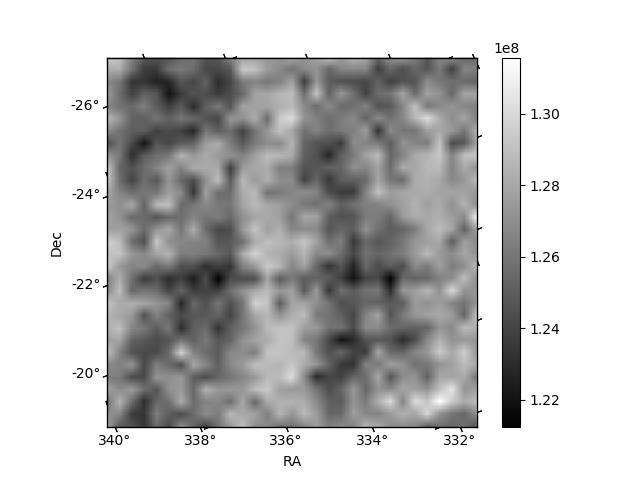
Histogram calculated using DETX and DETY for each event in the final _common_clean file
| Quadrant A | 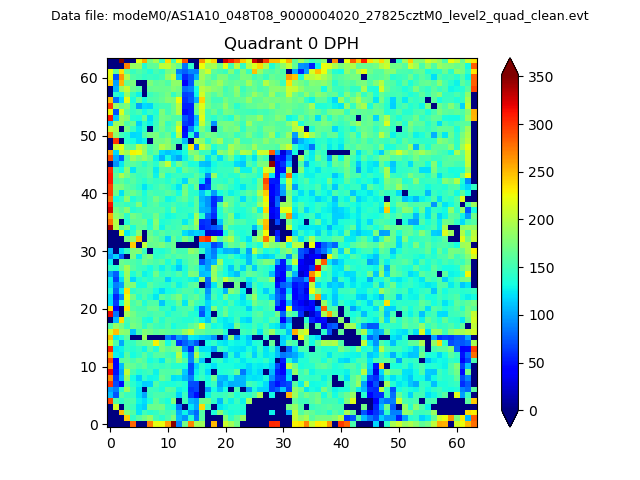 |
 |
Quadrant B |
|---|---|---|---|
| Quadrant D | 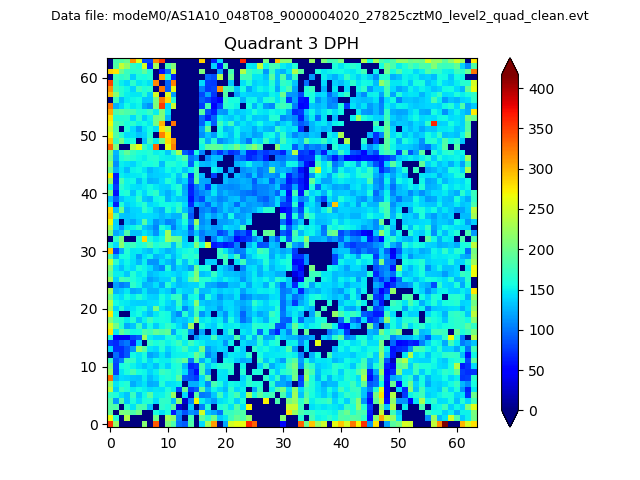 |
 |
Quadrant C |
| Plot type | Count rate plots | Images |
|---|---|---|
| Comparison with Poisson distribution Blue bars denote a histogram of data divided into 1 sec bins. Red curve is a Poisson curve with rate = median count rate of data. |
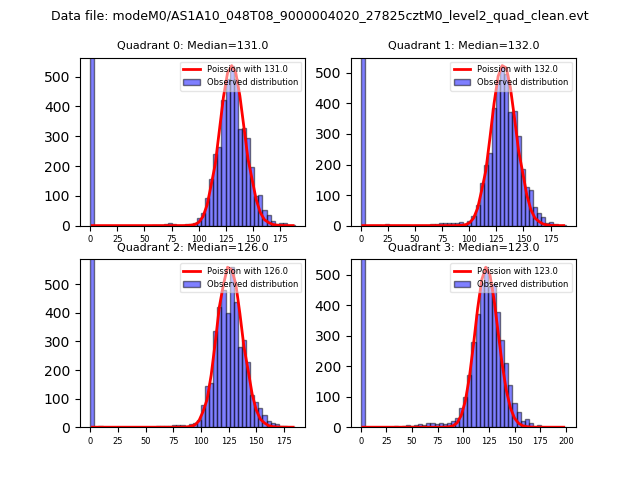 |
 |
| Quadrant-wise count rates Data is divided into 100 sec bins |
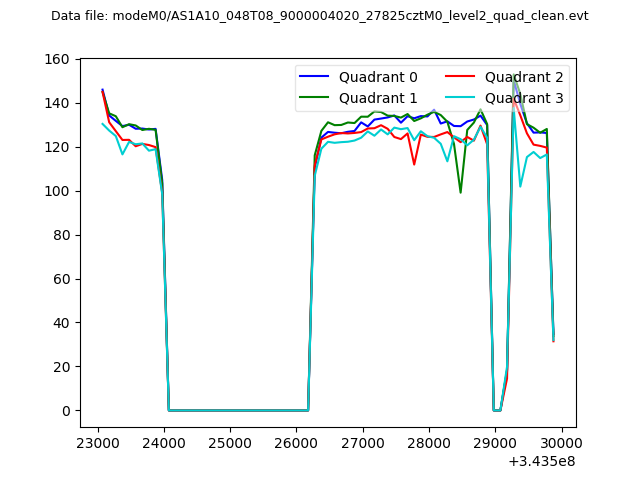 |
|
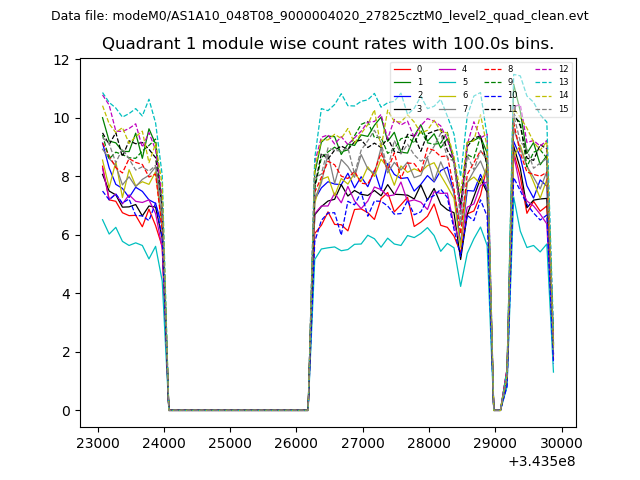
| Module-wise count rates for Quadrant A Data is divided into 100 sec bins |
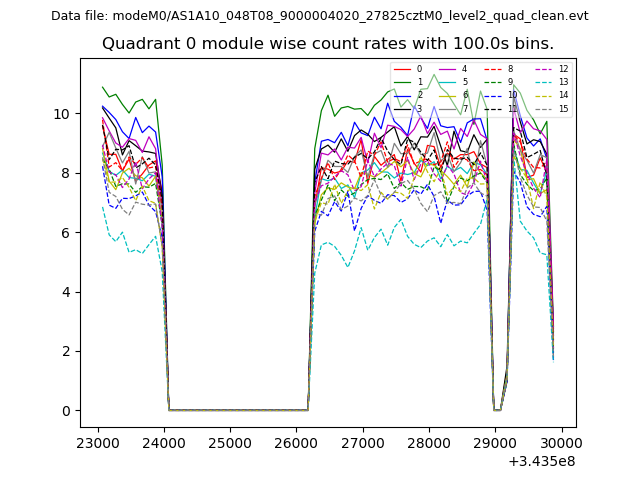 |
 |
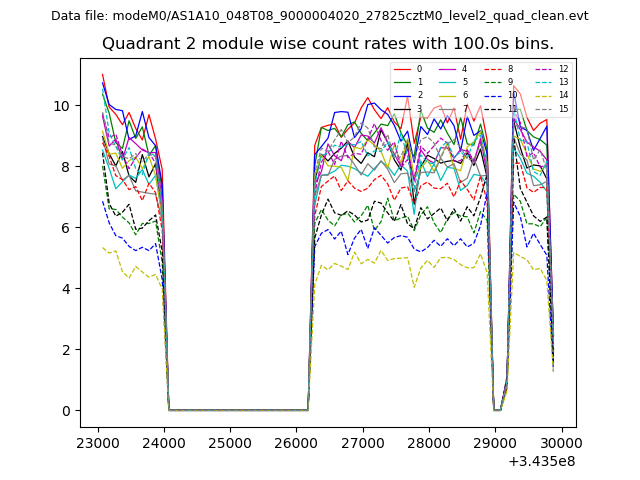
| Module-wise count rates for Quadrant B Data is divided into 100 sec bins |
 |
 |
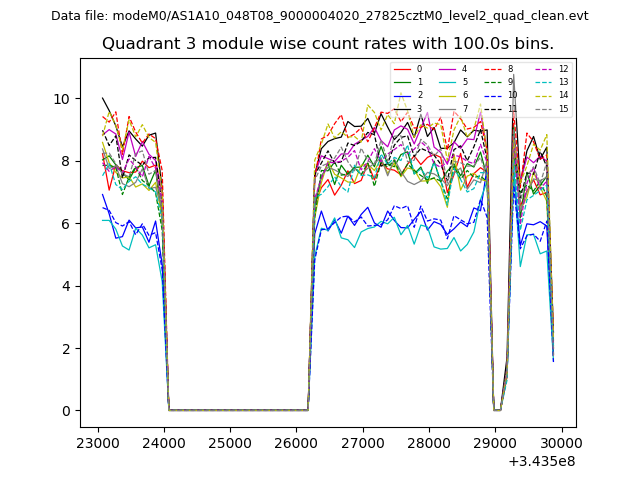
| Module-wise count rates for Quadrant C Data is divided into 100 sec bins |
 |
 |
| Module-wise count rates for Quadrant D Data is divided into 100 sec bins |
 |
 |
| Parameter | Plot |
|---|---|
| CZT HV Monitor | 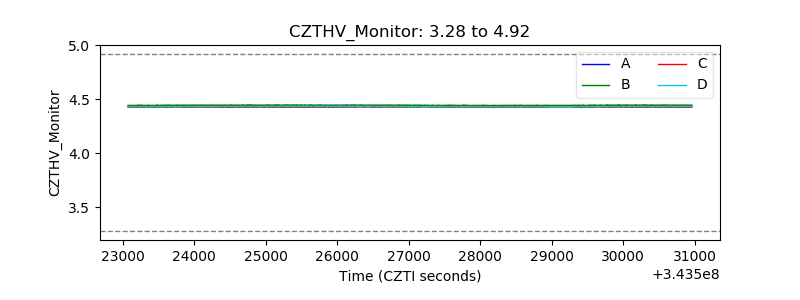 |
| D_VDD |  |
| Temperature 1 | 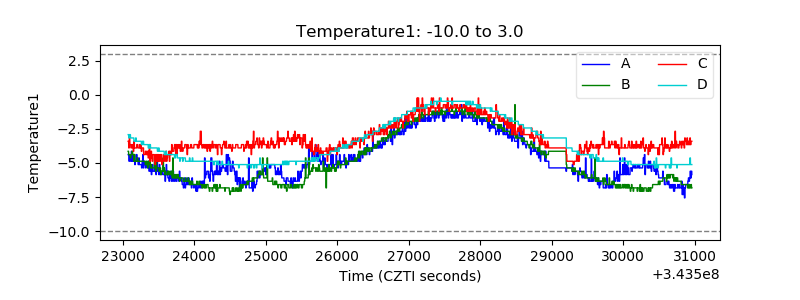 |
| Veto HV Monitor | 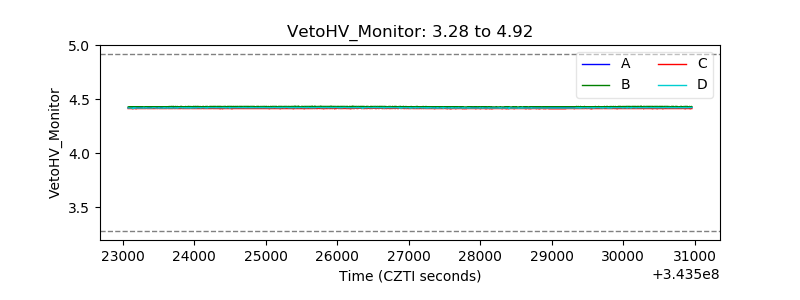 |
| Veto LLD | 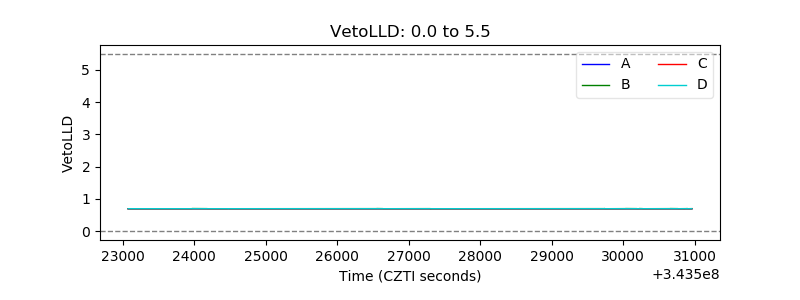 |
| Alpha Counter | 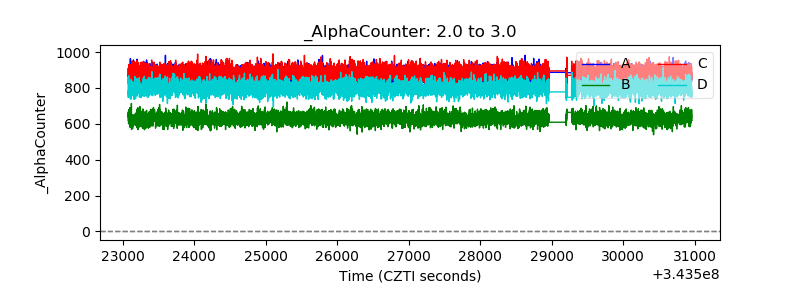 |
| _CPM_Rate | 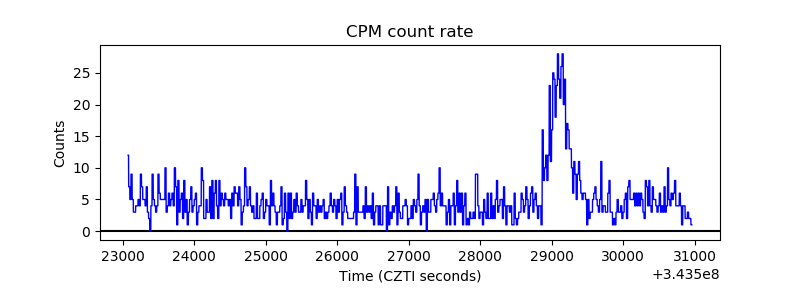 |
| CZT Counter | 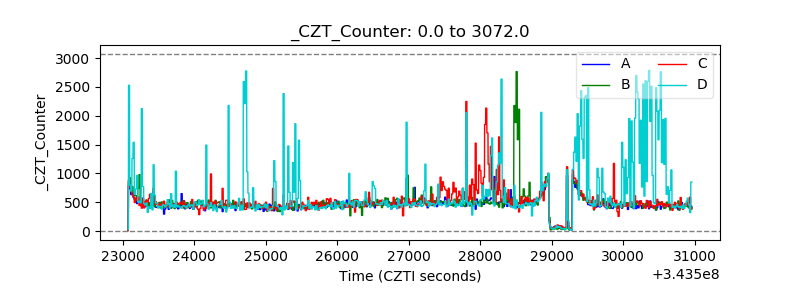 |
| +2.5 Volts monitor |  |
| +5 Volts monitor |  |
| _ROLL_ROT | 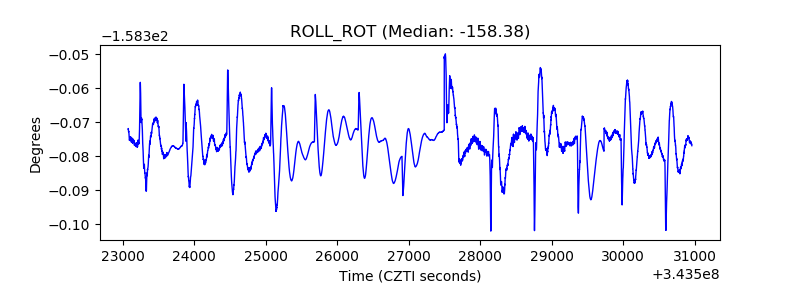 |
| _Roll_DEC | 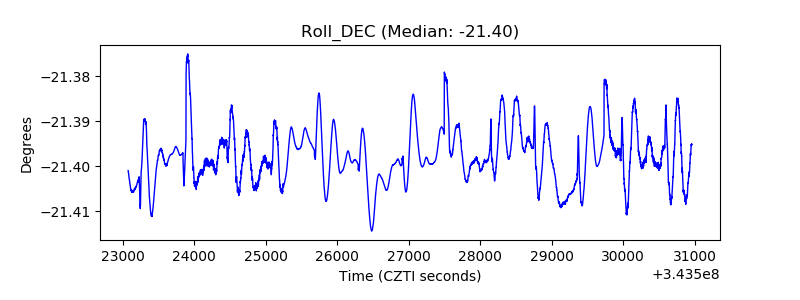 |
| _Roll_RA |  |
| Veto Counter | 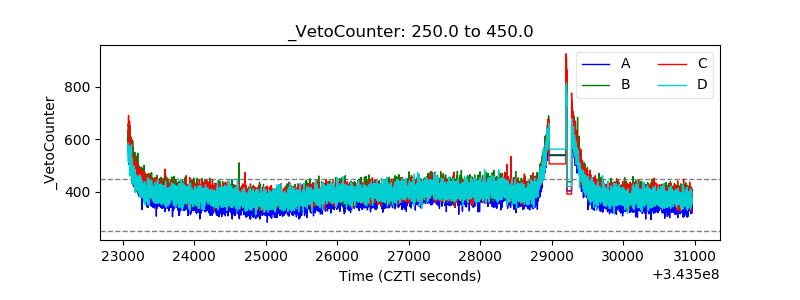 |