| Param | Original file | Final file |
|---|---|---|
| Filename | modeM0/AS1A10_048T08_9000004020_27826cztM0_level2.evt | modeM0/AS1A10_048T08_9000004020_27826cztM0_level2_quad_clean.evt |
| Size (bytes) | 634,147,200 | 93,263,040 |
| Size | 604.8 MB | 88.9 MB |
| Events in quadrant A | 3,878,720 | 582,772 |
| Events in quadrant B | 4,212,802 | 587,441 |
| Events in quadrant C | 4,043,018 | 561,497 |
| Events in quadrant D | 6,521,027 | 528,745 |
| Mode M0 | |||
|---|---|---|---|
| Quadrant | BADHDUFLAG | Total packets | Discarded packets |
| A | 0 | 16877 | 0 |
| B | 0 | 17699 | 0 |
| C | 0 | 17138 | 0 |
| D | 0 | 24836 | 0 |
| Mode M9 | |||
|---|---|---|---|
| Quadrant | BADHDUFLAG | Total packets | Discarded packets |
| A | 0 | 8 | 0 |
| B | 0 | 8 | 0 |
| C | 0 | 8 | 0 |
| D | 0 | 8 | 0 |
| Quadrant | Total seconds | Saturated seconds | Saturation percentage |
|---|---|---|---|
| A | 8121 | 94 | 1.157493% |
| B | 8122 | 223 | 2.745629% |
| C | 8122 | 202 | 2.487072% |
| D | 8122 | 783 | 9.640483% |
Noise dominated data is calculated using 1-second bins in cleaned event files. If a bin has >2000 counts, and if more than 50% of those come from <1% of pixels, then it is considered to be noise-dominated and hence unusable.
| Quadrant | # 1 sec bins | Bins with >0 counts | Bins with >2000 counts | High rate bins dominated by noise | Noise dominated (total time) | Noise dominated (detector-on time) | Marked lightcurve |
|---|---|---|---|---|---|---|---|
| A | 8756 | 8121 | 0 | 0 | 0.00% | 0.00% | 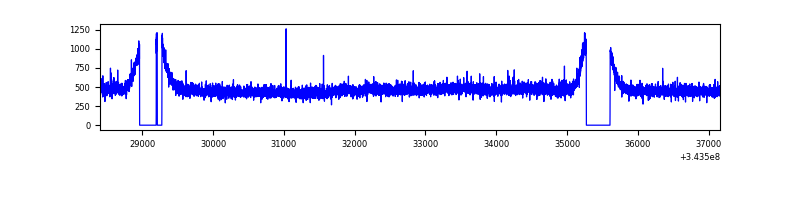 |
| B | 8757 | 8122 | 62 | 62 | 0.71% | 0.76% | 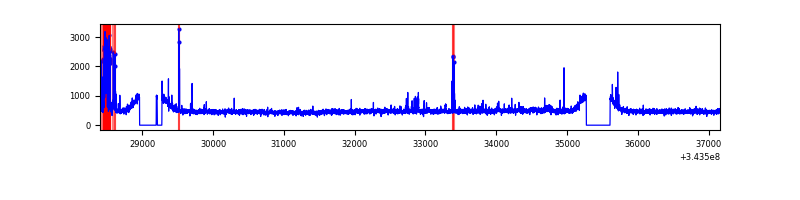 |
| C | 8757 | 8122 | 0 | 0 | 0.00% | 0.00% | 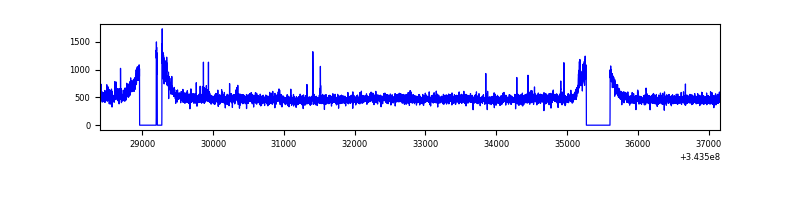 |
| D | 8757 | 8123 | 676 | 676 | 7.72% | 8.32% | 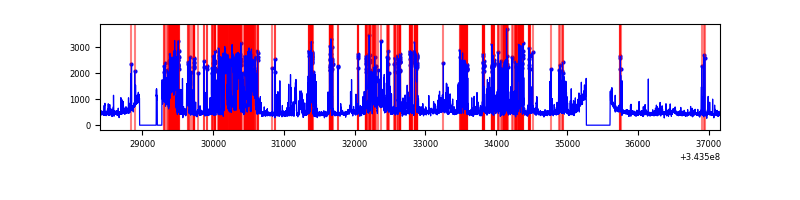 |
Top three noisy pixels from each quadrant. If the there are fewer than three noisy pixels in the level2.evt file, extra rows are filled as -1
| Pixel properties | Quadrant properties | ||||||
|---|---|---|---|---|---|---|---|
| Quadrant | DetID | PixID | Counts | Sigma | Mean | Median | Sigma |
| A | 13 | 254 | 12570 | 56.55 | 1003 | 979 | 205.0 |
| A | 3 | 137 | 10065 | 44.33 | 1003 | 979 | 205.0 |
| A | 0 | 226 | 8489 | 36.64 | 1003 | 979 | 205.0 |
| B | 10 | 245 | 202773 | 1044.18 | 995 | 968 | 193.3 |
| B | 0 | 229 | 37960 | 191.4 | 995 | 968 | 193.3 |
| B | 12 | 111 | 24260 | 120.52 | 995 | 968 | 193.3 |
| C | 14 | 238 | 151522 | 657.5 | 959 | 963 | 229.0 |
| C | 3 | 233 | 110857 | 479.91 | 959 | 963 | 229.0 |
| C | 6 | 112 | 15716 | 64.43 | 959 | 963 | 229.0 |
| D | 1 | 52 | 2765500 | 12193.97 | 939 | 911 | 226.7 |
| D | 2 | 250 | 104644 | 457.54 | 939 | 911 | 226.7 |
| D | 13 | 104 | 54712 | 237.3 | 939 | 911 | 226.7 |
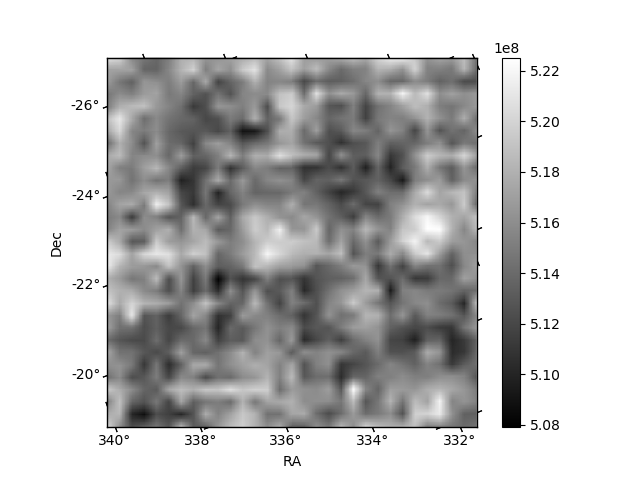
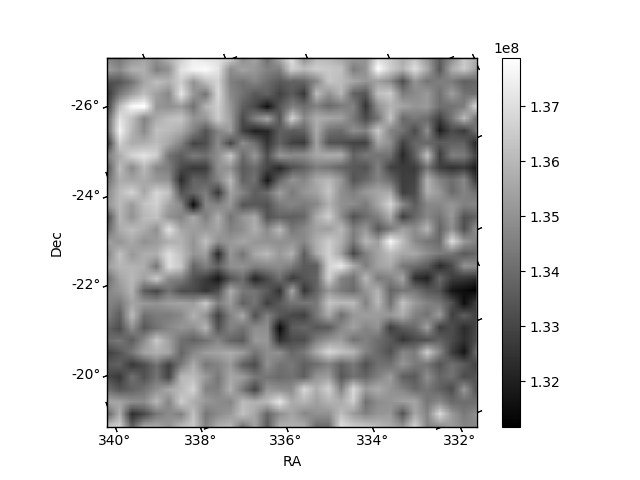
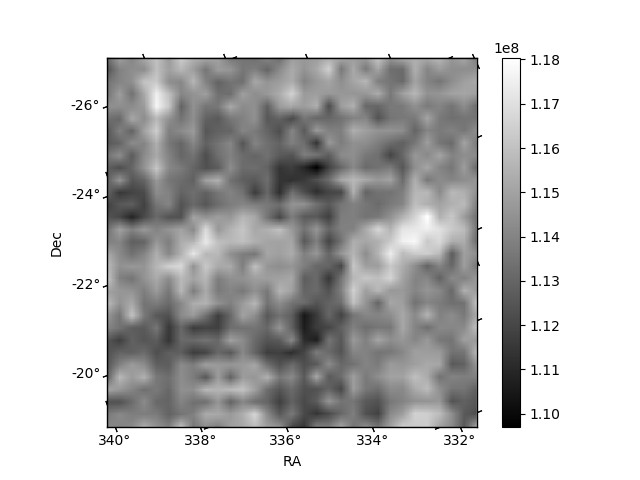
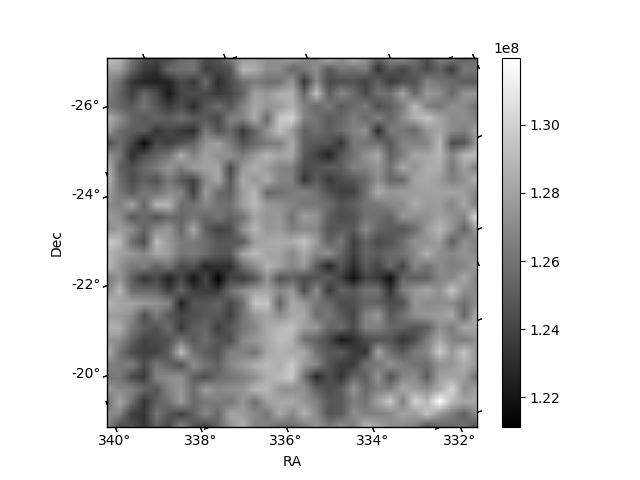
Histogram calculated using DETX and DETY for each event in the final _common_clean file
| Quadrant A | 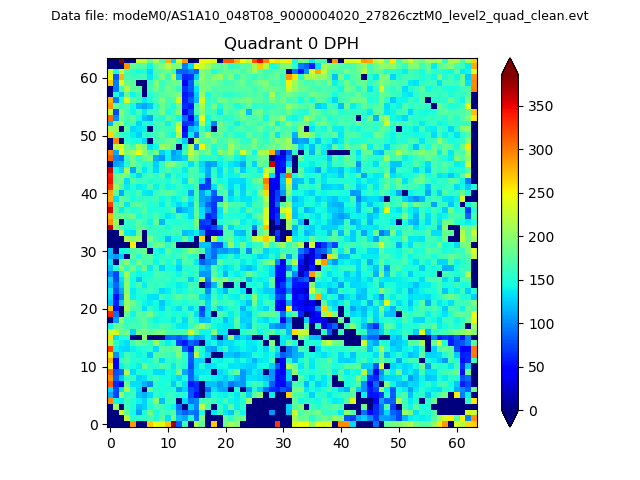 |
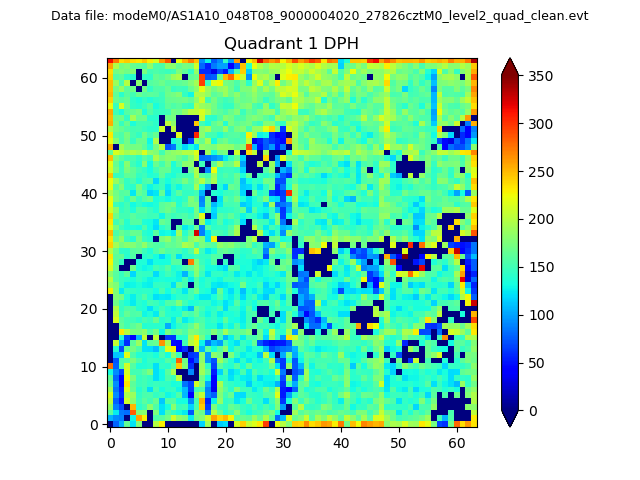 |
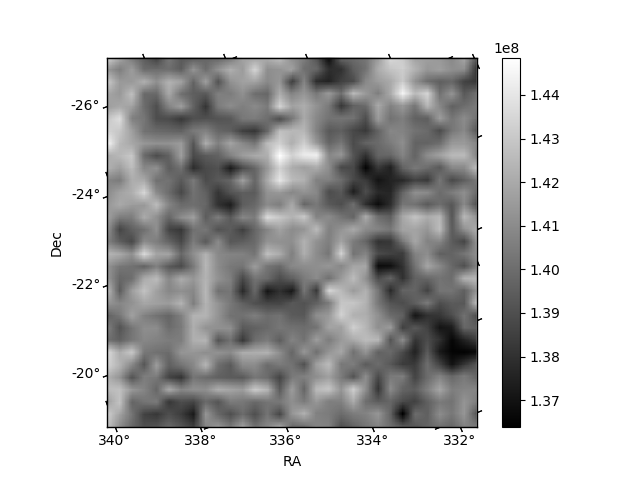
Quadrant B |
|---|---|---|---|
| Quadrant D | 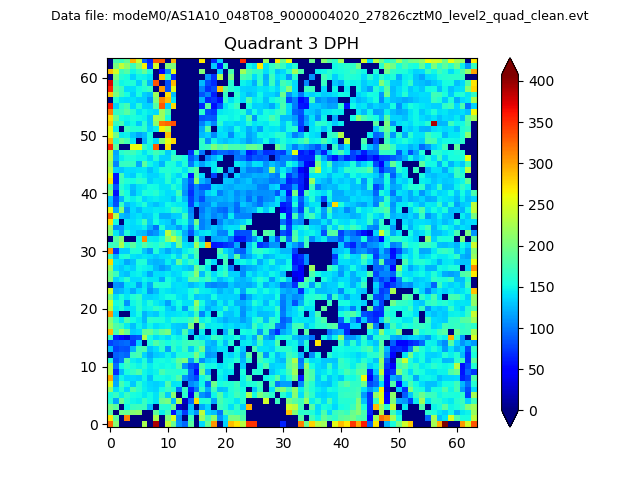 |
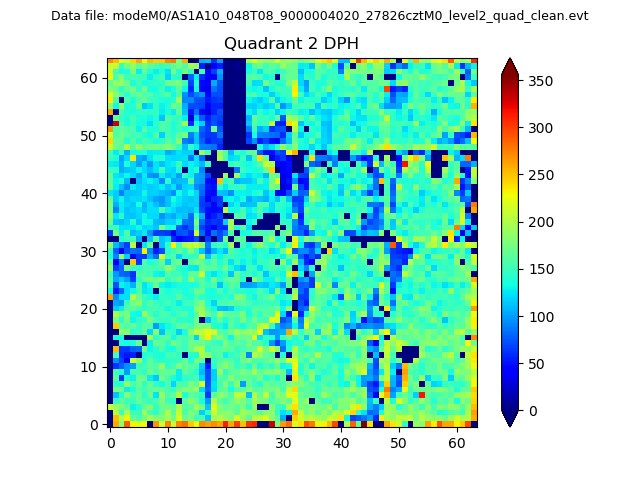 |
Quadrant C |
| Plot type | Count rate plots | Images |
|---|---|---|
| Comparison with Poisson distribution Blue bars denote a histogram of data divided into 1 sec bins. Red curve is a Poisson curve with rate = median count rate of data. |
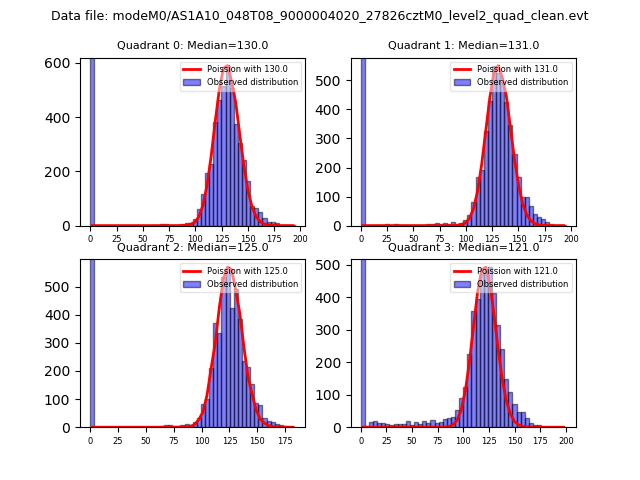 |
 |
| Quadrant-wise count rates Data is divided into 100 sec bins |
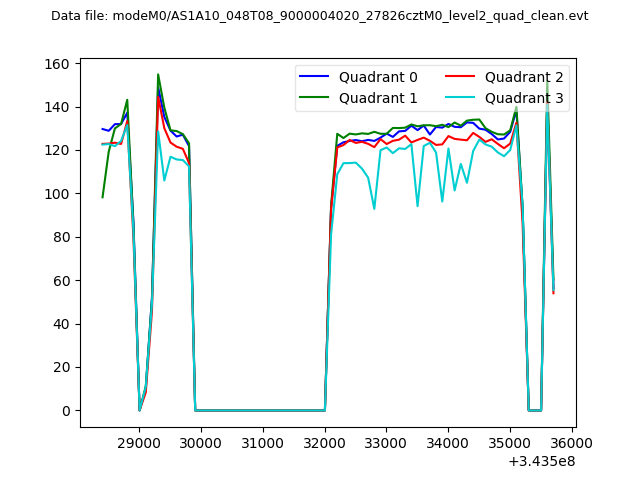 |
|
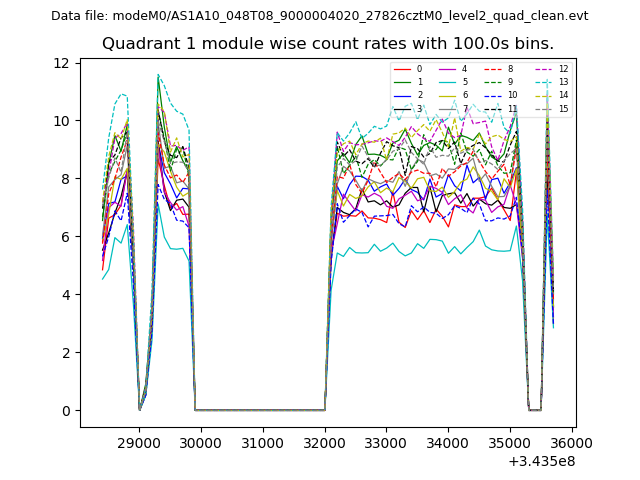
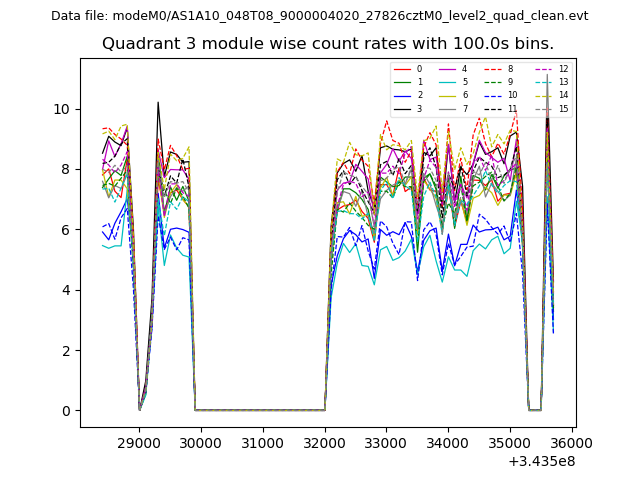
| Module-wise count rates for Quadrant A Data is divided into 100 sec bins |
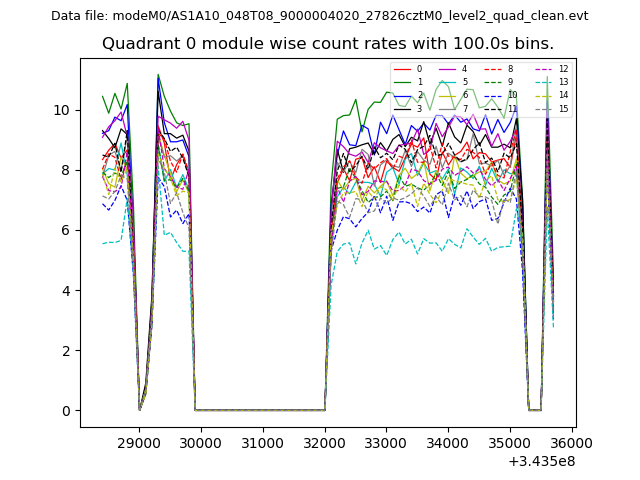 |
 |
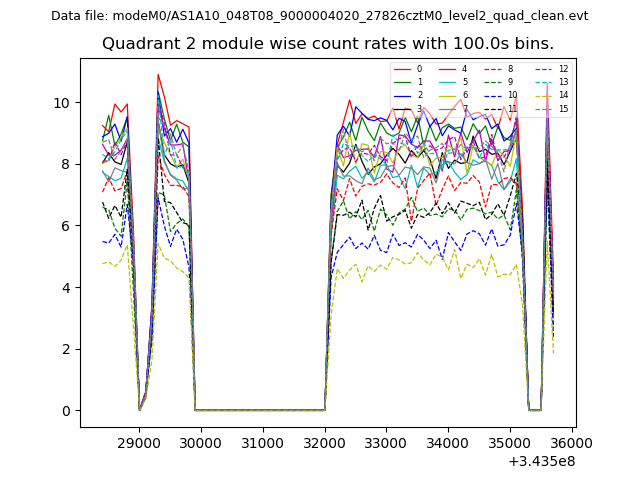
| Module-wise count rates for Quadrant B Data is divided into 100 sec bins |
 |
 |
| Module-wise count rates for Quadrant C Data is divided into 100 sec bins |
 |
 |
| Module-wise count rates for Quadrant D Data is divided into 100 sec bins |
 |
 |
| Parameter | Plot |
|---|---|
| CZT HV Monitor | 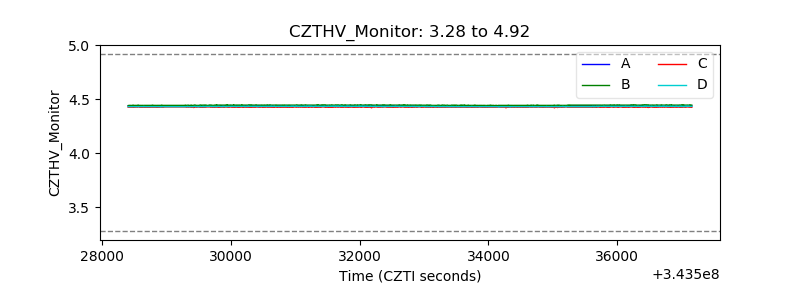 |
| D_VDD | 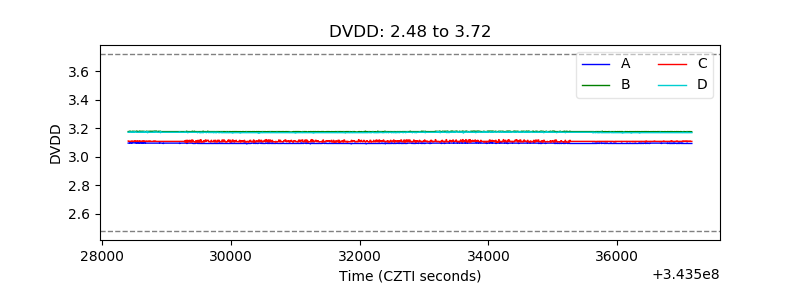 |
| Temperature 1 | 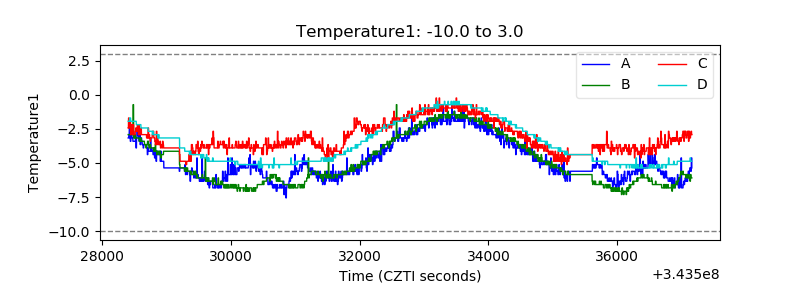 |
| Veto HV Monitor | 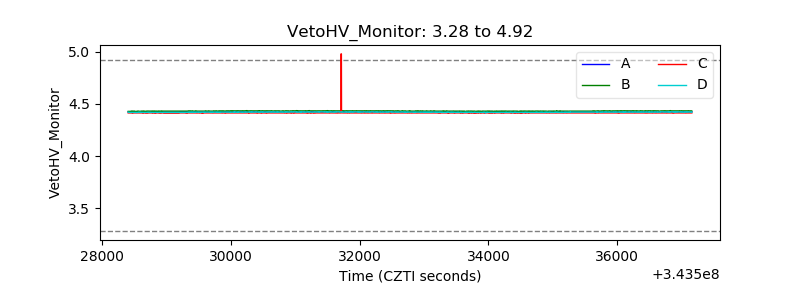 |
| Veto LLD | 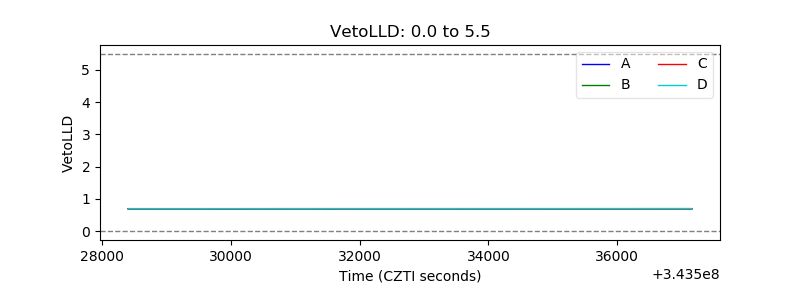 |
| Alpha Counter | 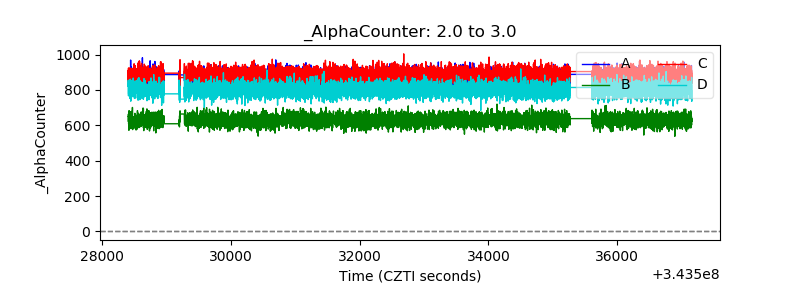 |
| _CPM_Rate | 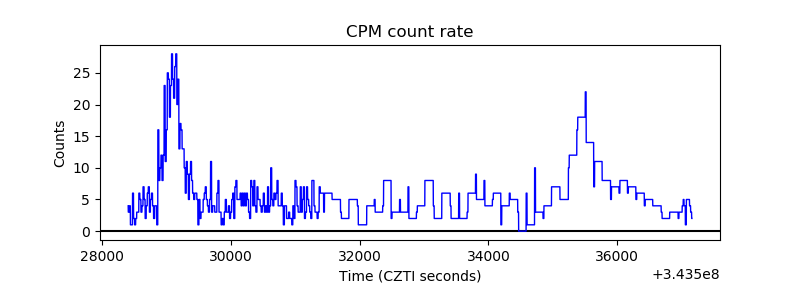 |
| CZT Counter | 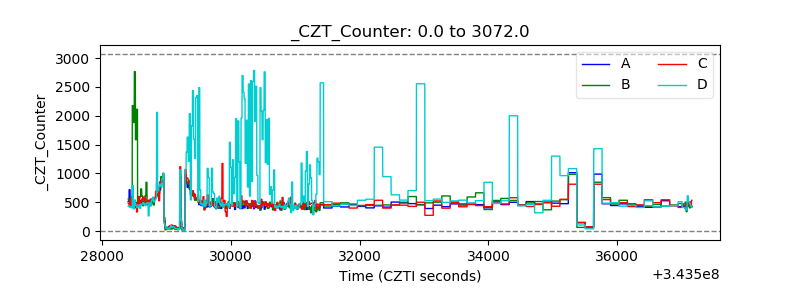 |
| +2.5 Volts monitor |  |
| +5 Volts monitor |  |
| _ROLL_ROT | 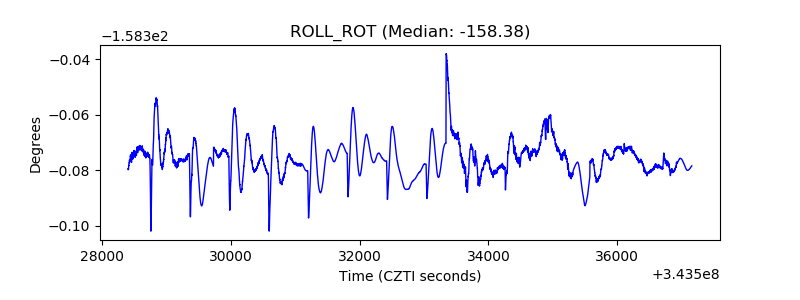 |
| _Roll_DEC | 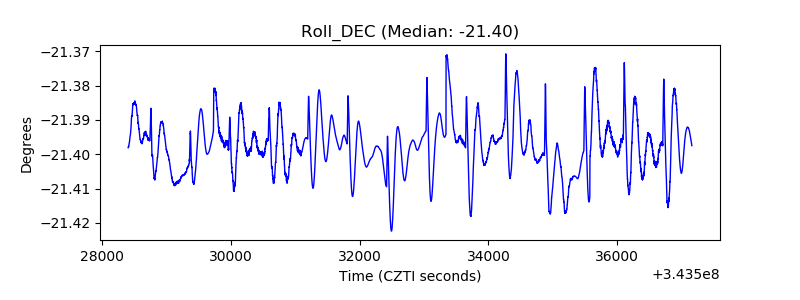 |
| _Roll_RA | 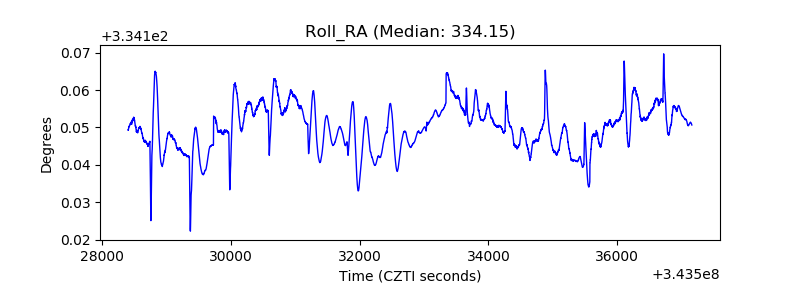 |
| Veto Counter | 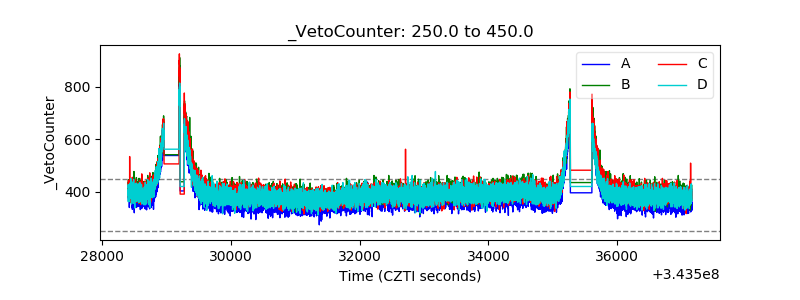 |