| Param | Original file | Final file |
|---|---|---|
| Filename | modeM0/AS1A10_048T08_9000004020_27829cztM0_level2.evt | modeM0/AS1A10_048T08_9000004020_27829cztM0_level2_quad_clean.evt |
| Size (bytes) | 1,322,536,320 | 226,909,440 |
| Size | 1.2 GB | 216.4 MB |
| Events in quadrant A | 8,686,757 | 1,429,385 |
| Events in quadrant B | 8,956,961 | 1,443,099 |
| Events in quadrant C | 9,388,773 | 1,380,860 |
| Events in quadrant D | 11,770,067 | 1,343,898 |
| Mode M0 | |||
|---|---|---|---|
| Quadrant | BADHDUFLAG | Total packets | Discarded packets |
| A | 0 | 37762 | 0 |
| B | 0 | 38156 | 0 |
| C | 0 | 39522 | 0 |
| D | 0 | 47431 | 0 |
| Mode M9 | |||
|---|---|---|---|
| Quadrant | BADHDUFLAG | Total packets | Discarded packets |
| A | 0 | 21 | 0 |
| B | 0 | 22 | 0 |
| C | 0 | 22 | 0 |
| D | 0 | 22 | 0 |
| Quadrant | Total seconds | Saturated seconds | Saturation percentage |
|---|---|---|---|
| A | 18507 | 183 | 0.988815% |
| B | 18506 | 223 | 1.205015% |
| C | 18506 | 324 | 1.750784% |
| D | 18506 | 576 | 3.112504% |
Noise dominated data is calculated using 1-second bins in cleaned event files. If a bin has >2000 counts, and if more than 50% of those come from <1% of pixels, then it is considered to be noise-dominated and hence unusable.
| Quadrant | # 1 sec bins | Bins with >0 counts | Bins with >2000 counts | High rate bins dominated by noise | Noise dominated (total time) | Noise dominated (detector-on time) | Marked lightcurve |
|---|---|---|---|---|---|---|---|
| A | 20432 | 18507 | 0 | 0 | 0.00% | 0.00% | 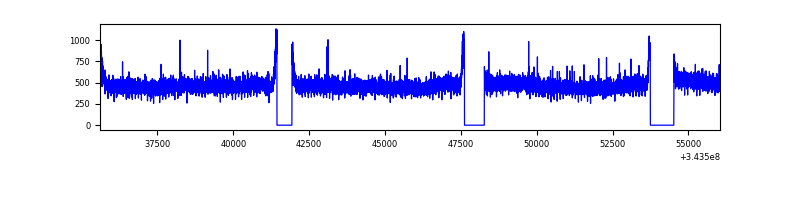 |
| B | 20431 | 18506 | 3 | 3 | 0.01% | 0.02% | 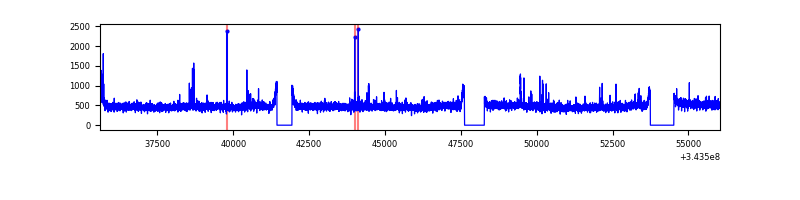 |
| C | 20431 | 18506 | 31 | 31 | 0.15% | 0.17% | 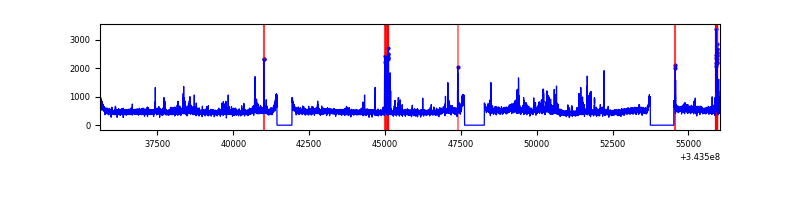 |
| D | 20431 | 18506 | 401 | 401 | 1.96% | 2.17% | 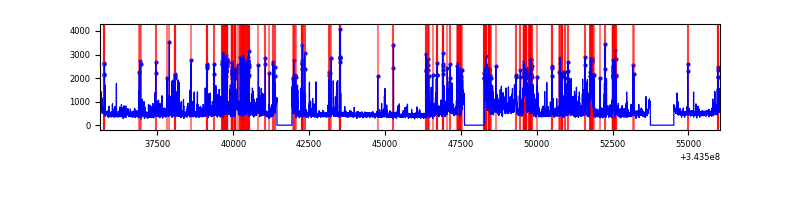 |
Top three noisy pixels from each quadrant. If the there are fewer than three noisy pixels in the level2.evt file, extra rows are filled as -1
| Pixel properties | Quadrant properties | ||||||
|---|---|---|---|---|---|---|---|
| Quadrant | DetID | PixID | Counts | Sigma | Mean | Median | Sigma |
| A | 13 | 254 | 29521 | 60.0 | 2252 | 2206 | 455.2 |
| A | 3 | 137 | 21907 | 43.28 | 2252 | 2206 | 455.2 |
| A | 0 | 226 | 18918 | 36.71 | 2252 | 2206 | 455.2 |
| B | 0 | 229 | 60442 | 136.11 | 2235 | 2178 | 428.1 |
| B | 12 | 111 | 54296 | 121.75 | 2235 | 2178 | 428.1 |
| B | 0 | 190 | 54269 | 121.69 | 2235 | 2178 | 428.1 |
| C | 3 | 233 | 579226 | 1144.91 | 2148 | 2161 | 504.0 |
| C | 14 | 238 | 343753 | 677.72 | 2148 | 2161 | 504.0 |
| C | 2 | 16 | 65471 | 125.61 | 2148 | 2161 | 504.0 |
| D | 1 | 52 | 3309827 | 6332.49 | 2163 | 2098 | 522.3 |
| D | 2 | 250 | 170935 | 323.23 | 2163 | 2098 | 522.3 |
| D | 2 | 234 | 75243 | 140.03 | 2163 | 2098 | 522.3 |
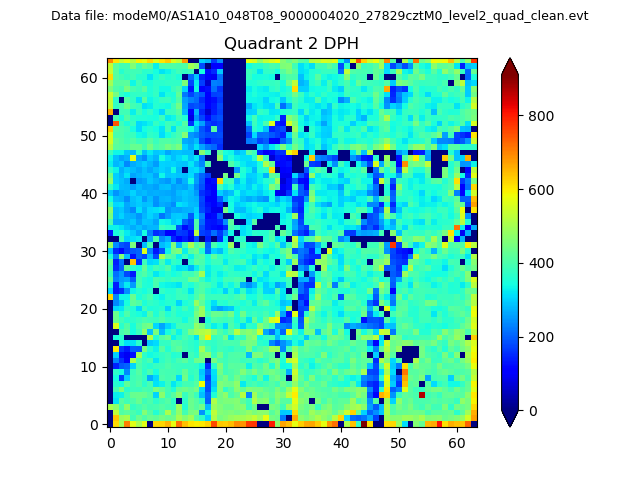
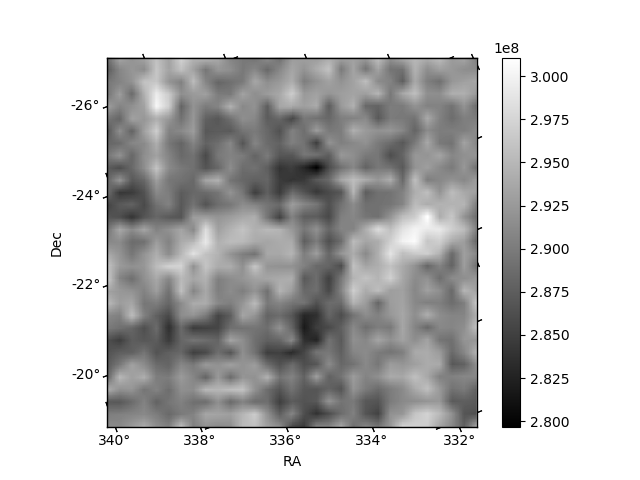
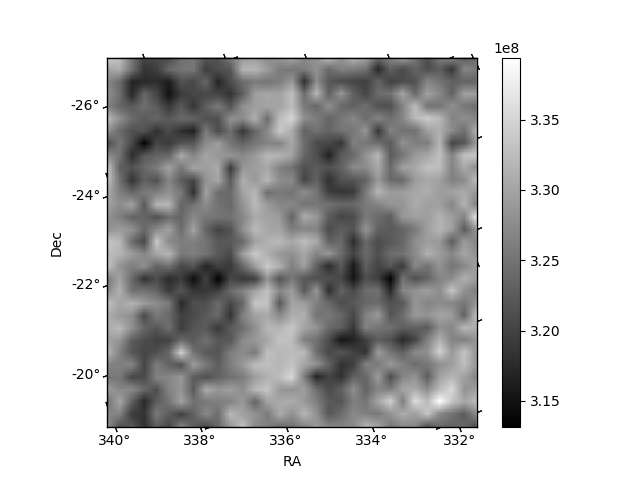
Histogram calculated using DETX and DETY for each event in the final _common_clean file
| Quadrant A | 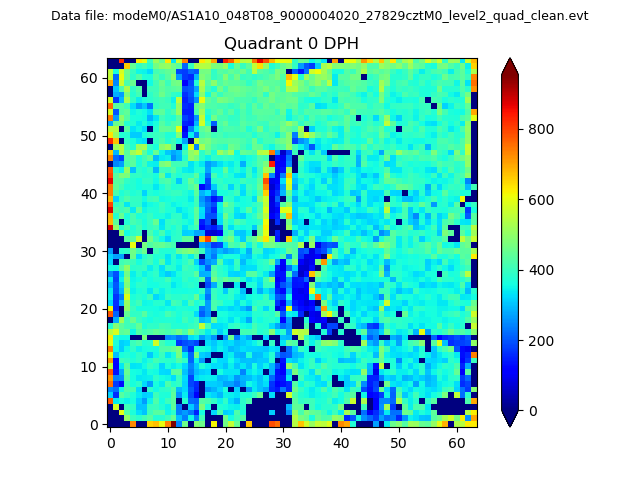 |
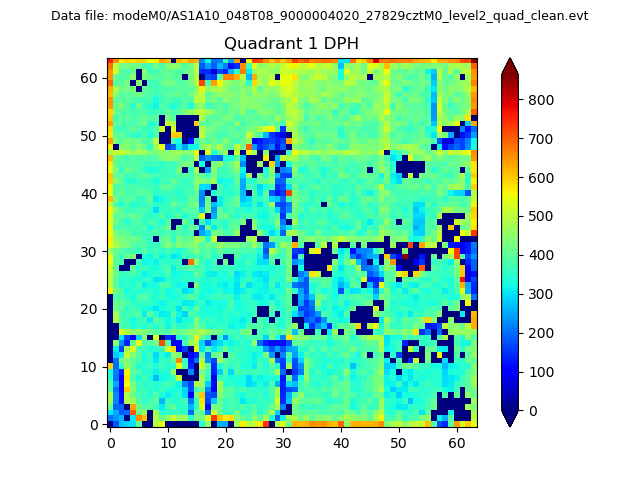 |
Quadrant B |
|---|---|---|---|
| Quadrant D | 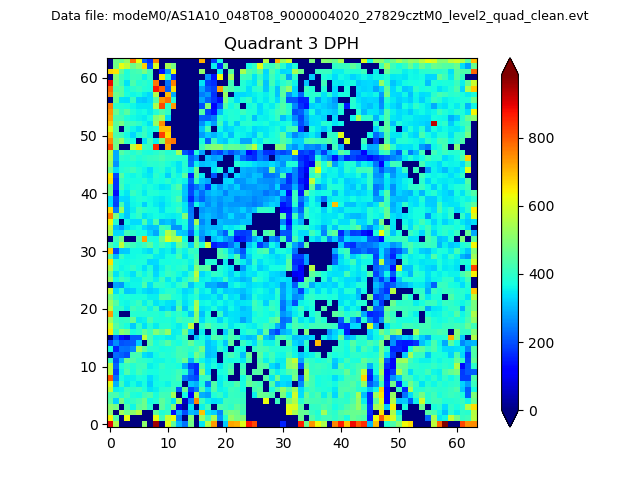 |
 |
Quadrant C |
| Plot type | Count rate plots | Images |
|---|---|---|
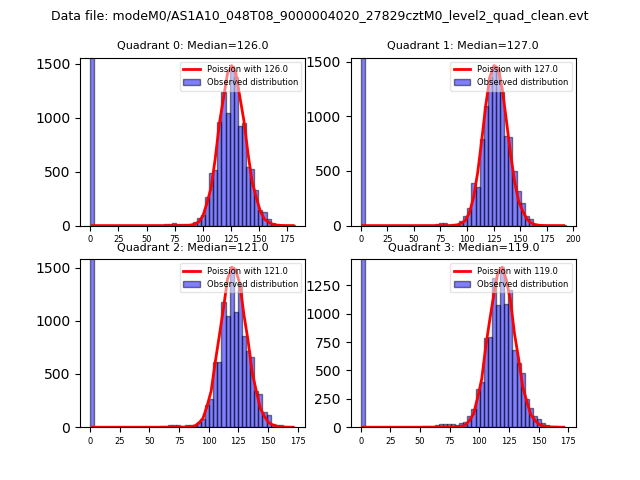
| Comparison with Poisson distribution Blue bars denote a histogram of data divided into 1 sec bins. Red curve is a Poisson curve with rate = median count rate of data. |
 |
 |
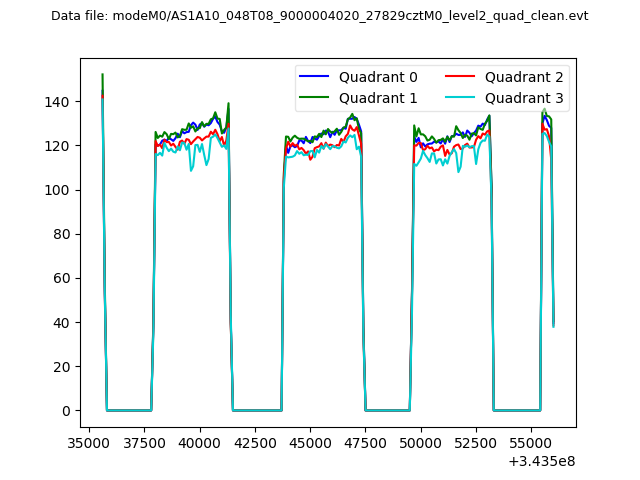
| Quadrant-wise count rates Data is divided into 100 sec bins |
 |
|
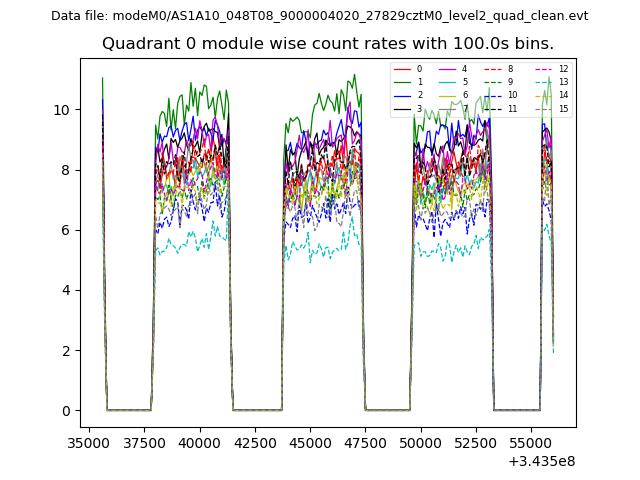
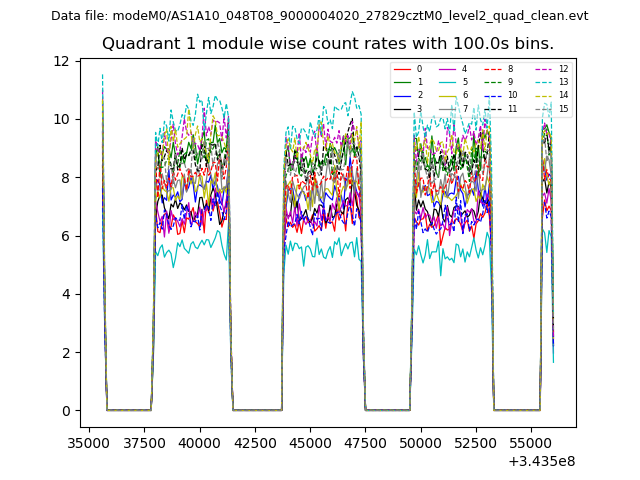
| Module-wise count rates for Quadrant A Data is divided into 100 sec bins |
 |
 |
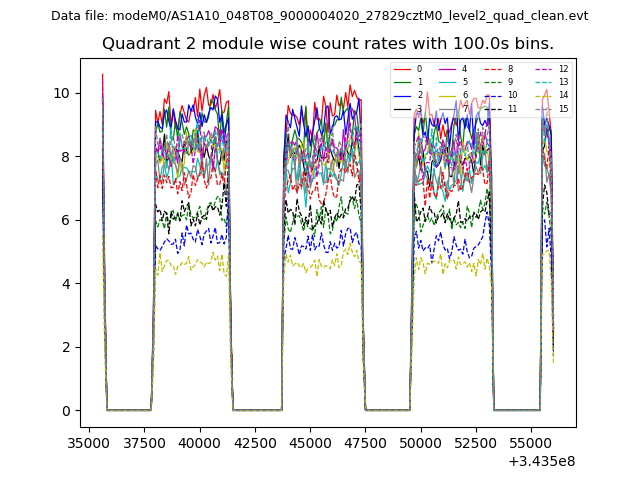
| Module-wise count rates for Quadrant B Data is divided into 100 sec bins |
 |
 |
| Module-wise count rates for Quadrant C Data is divided into 100 sec bins |
 |
 |
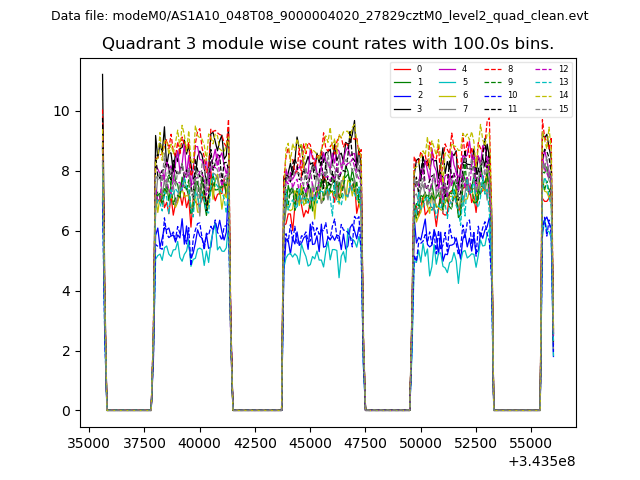
| Module-wise count rates for Quadrant D Data is divided into 100 sec bins |
 |
 |
| Parameter | Plot |
|---|---|
| CZT HV Monitor | 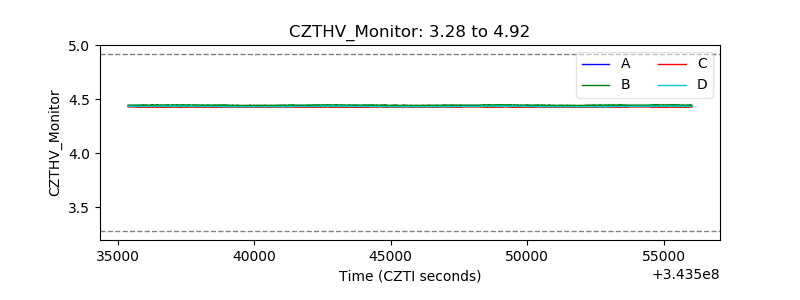 |
| D_VDD | 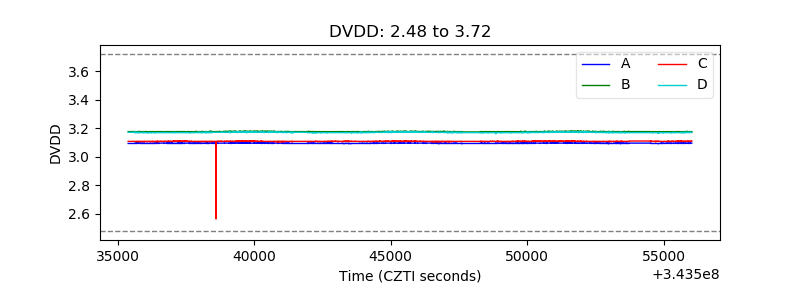 |
| Temperature 1 | 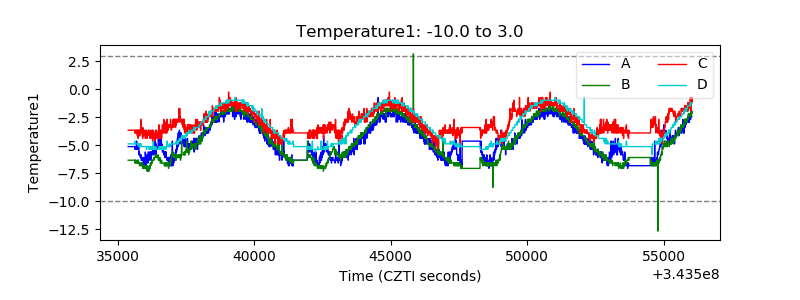 |
| Veto HV Monitor | 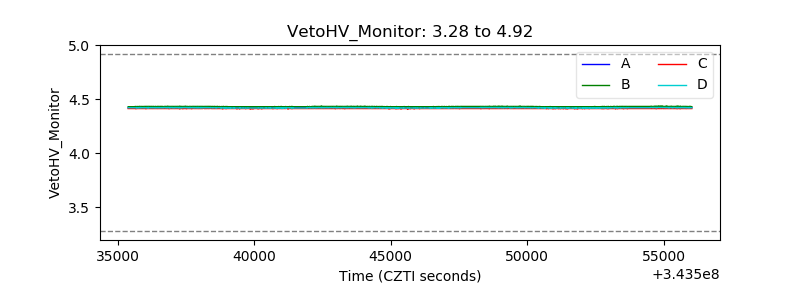 |
| Veto LLD | 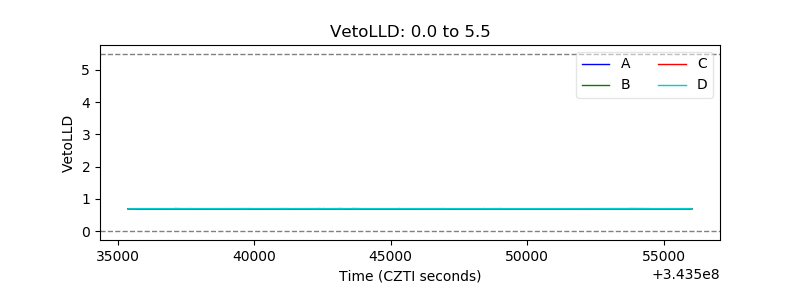 |
| Alpha Counter | 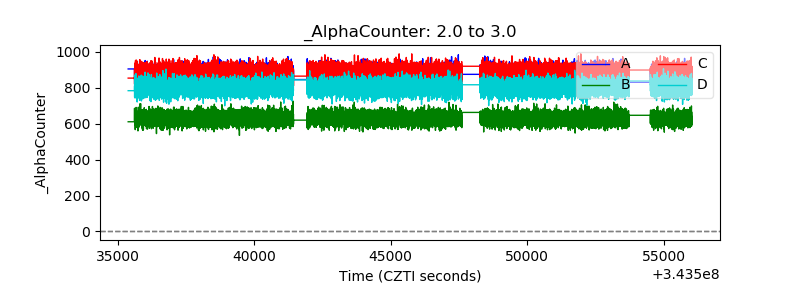 |
| _CPM_Rate | 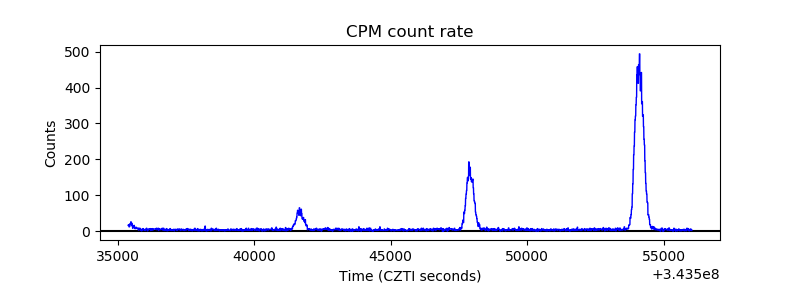 |
| CZT Counter | 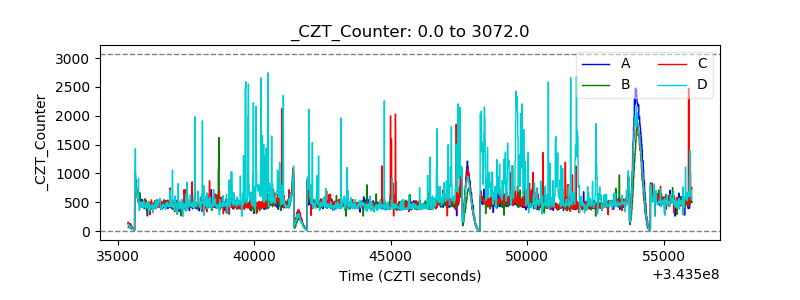 |
| +2.5 Volts monitor |  |
| +5 Volts monitor |  |
| _ROLL_ROT | 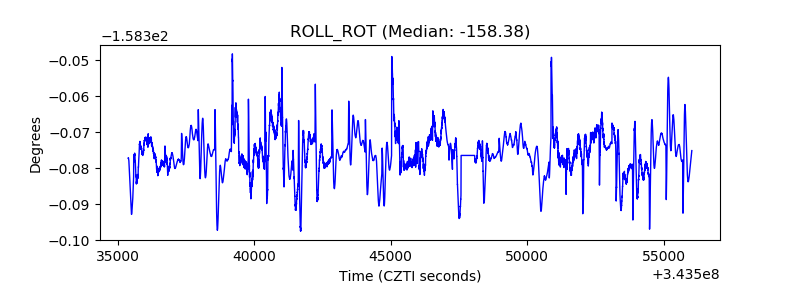 |
| _Roll_DEC |  |
| _Roll_RA | 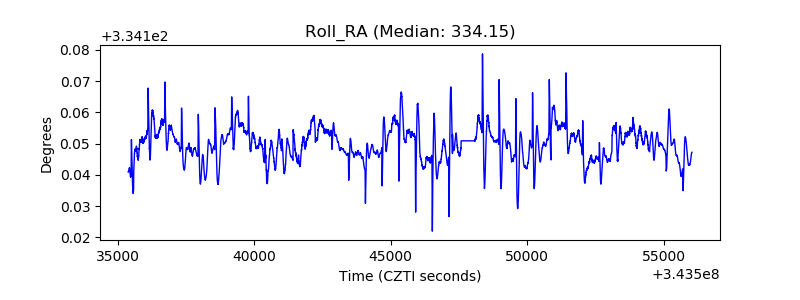 |
| Veto Counter | 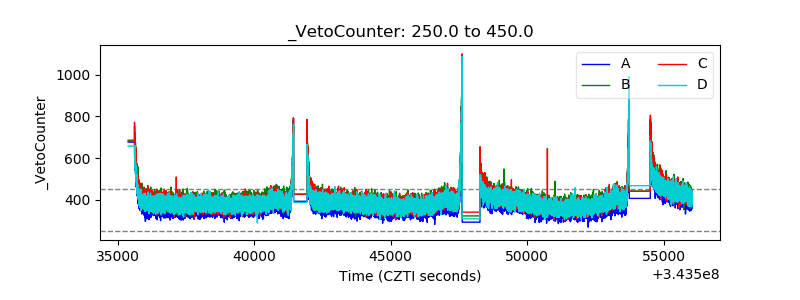 |