| Param | Original file | Final file |
|---|---|---|
| Filename | modeM0/AS1A10_048T08_9000004020_27832cztM0_level2.evt | modeM0/AS1A10_048T08_9000004020_27832cztM0_level2_quad_clean.evt |
| Size (bytes) | 481,654,080 | 103,867,200 |
| Size | 459.3 MB | 99.1 MB |
| Events in quadrant A | 3,270,130 | 693,058 |
| Events in quadrant B | 3,396,595 | 699,730 |
| Events in quadrant C | 3,297,401 | 656,888 |
| Events in quadrant D | 4,184,589 | 645,723 |
| Mode M0 | |||
|---|---|---|---|
| Quadrant | BADHDUFLAG | Total packets | Discarded packets |
| A | 0 | 13942 | 0 |
| B | 0 | 14362 | 0 |
| C | 0 | 13986 | 0 |
| D | 0 | 16921 | 0 |
| Mode M9 | |||
|---|---|---|---|
| Quadrant | BADHDUFLAG | Total packets | Discarded packets |
| A | 0 | 11 | 0 |
| B | 0 | 11 | 0 |
| C | 0 | 11 | 0 |
| D | 0 | 11 | 0 |
| Quadrant | Total seconds | Saturated seconds | Saturation percentage |
|---|---|---|---|
| A | 6454 | 50 | 0.774713% |
| B | 6453 | 59 | 0.914303% |
| C | 6453 | 100 | 1.549667% |
| D | 6454 | 86 | 1.332507% |
Noise dominated data is calculated using 1-second bins in cleaned event files. If a bin has >2000 counts, and if more than 50% of those come from <1% of pixels, then it is considered to be noise-dominated and hence unusable.
| Quadrant | # 1 sec bins | Bins with >0 counts | Bins with >2000 counts | High rate bins dominated by noise | Noise dominated (total time) | Noise dominated (detector-on time) | Marked lightcurve |
|---|---|---|---|---|---|---|---|
| A | 7534 | 6454 | 0 | 0 | 0.00% | 0.00% | 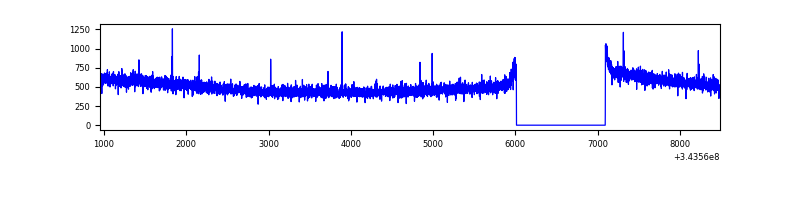 |
| B | 7533 | 6453 | 0 | 0 | 0.00% | 0.00% | 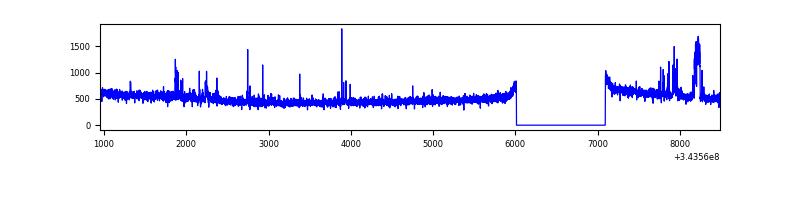 |
| C | 7533 | 6453 | 0 | 0 | 0.00% | 0.00% | 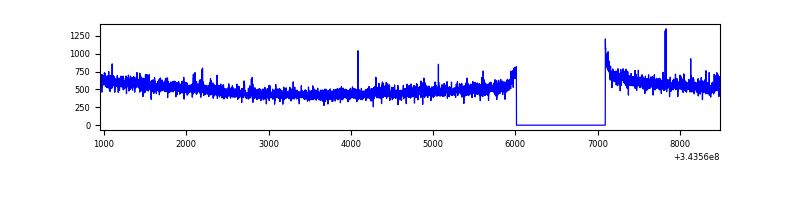 |
| D | 7534 | 6454 | 50 | 50 | 0.66% | 0.77% | 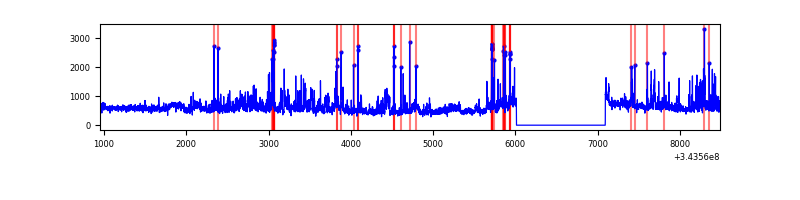 |
Top three noisy pixels from each quadrant. If the there are fewer than three noisy pixels in the level2.evt file, extra rows are filled as -1
| Pixel properties | Quadrant properties | ||||||
|---|---|---|---|---|---|---|---|
| Quadrant | DetID | PixID | Counts | Sigma | Mean | Median | Sigma |
| A | 13 | 254 | 11939 | 65.45 | 846 | 831 | 169.7 |
| A | 3 | 137 | 7934 | 41.85 | 846 | 831 | 169.7 |
| A | 0 | 226 | 7356 | 38.44 | 846 | 831 | 169.7 |
| B | 15 | 32 | 64024 | 400.0 | 831 | 814 | 158.0 |
| B | 0 | 190 | 36550 | 226.14 | 831 | 814 | 158.0 |
| B | 12 | 111 | 19064 | 115.49 | 831 | 814 | 158.0 |
| C | 14 | 238 | 127758 | 688.06 | 791 | 798 | 184.5 |
| C | 3 | 233 | 75309 | 403.81 | 791 | 798 | 184.5 |
| C | 4 | 175 | 11399 | 57.45 | 791 | 798 | 184.5 |
| D | 1 | 52 | 996186 | 5213.33 | 806 | 786 | 190.9 |
| D | 2 | 250 | 79275 | 411.08 | 806 | 786 | 190.9 |
| D | 2 | 234 | 27272 | 138.72 | 806 | 786 | 190.9 |
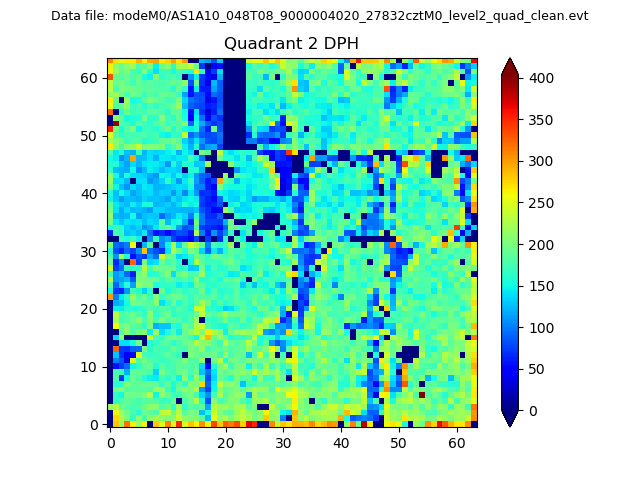
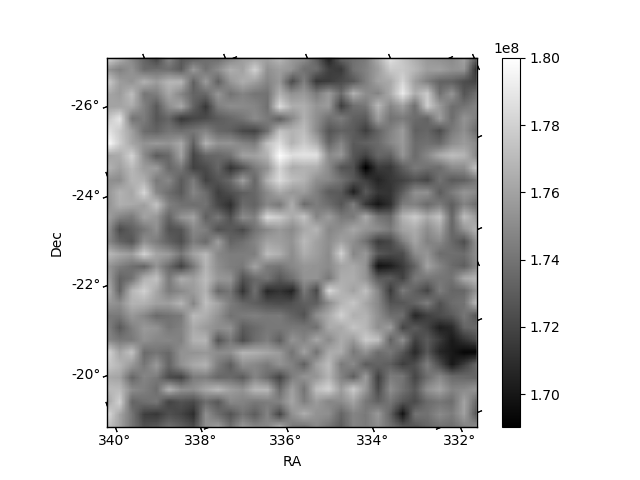
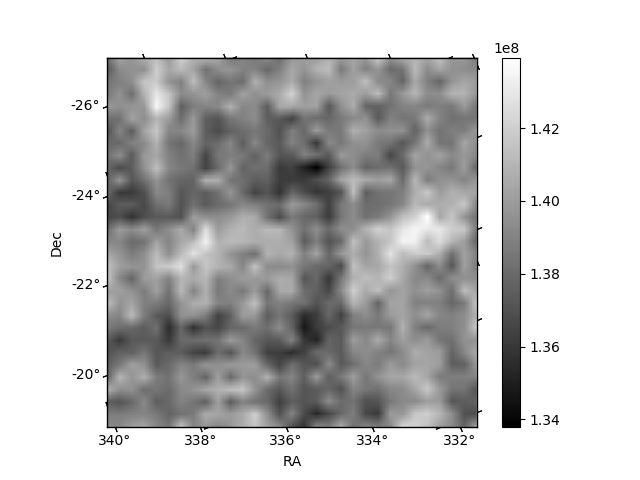
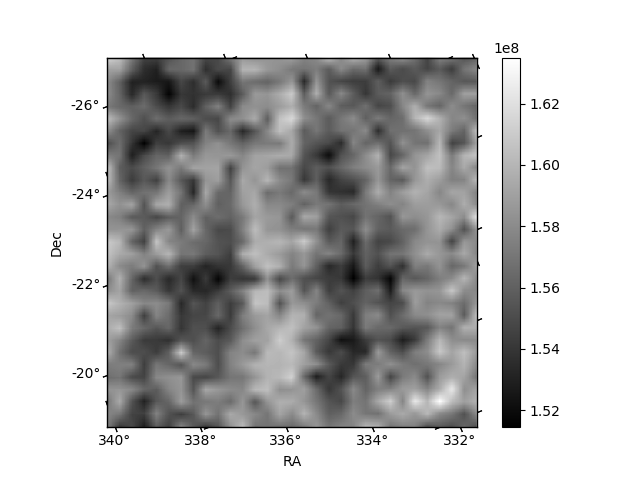
Histogram calculated using DETX and DETY for each event in the final _common_clean file
| Quadrant A | 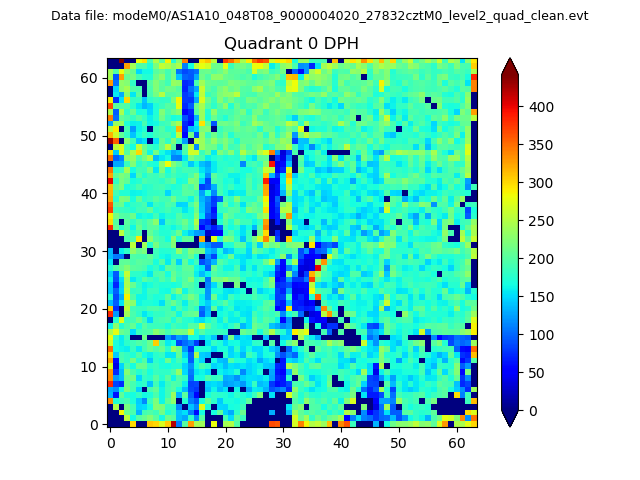 |
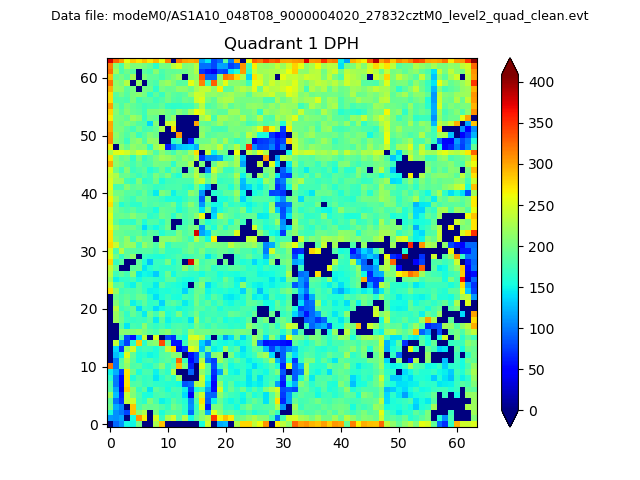 |
Quadrant B |
|---|---|---|---|
| Quadrant D | 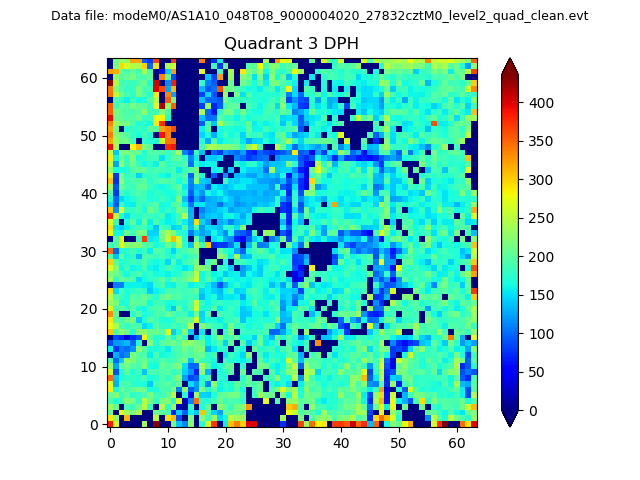 |
 |
Quadrant C |
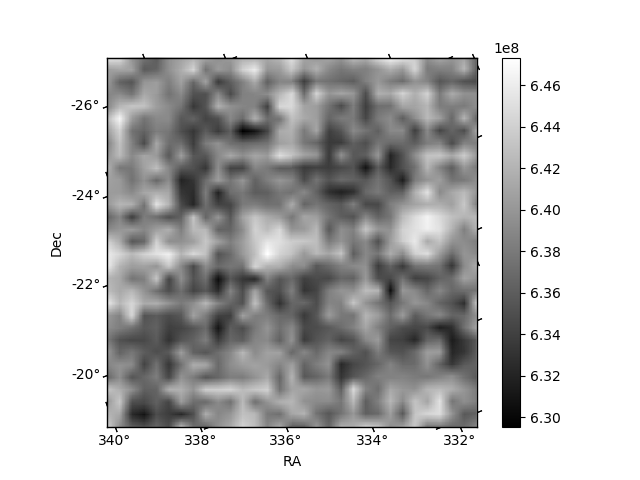
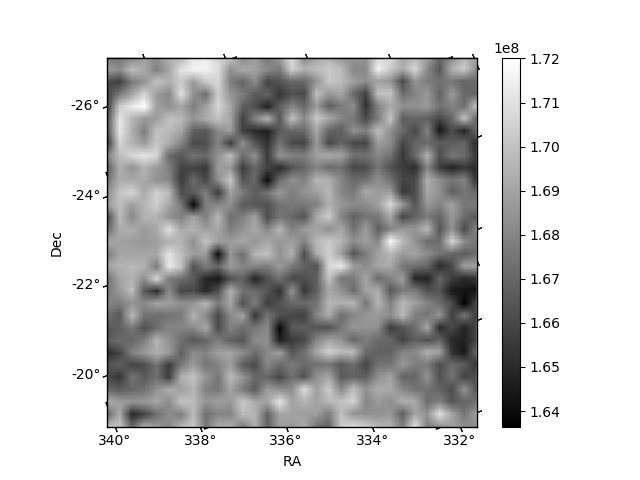
| Plot type | Count rate plots | Images |
|---|---|---|
| Comparison with Poisson distribution Blue bars denote a histogram of data divided into 1 sec bins. Red curve is a Poisson curve with rate = median count rate of data. |
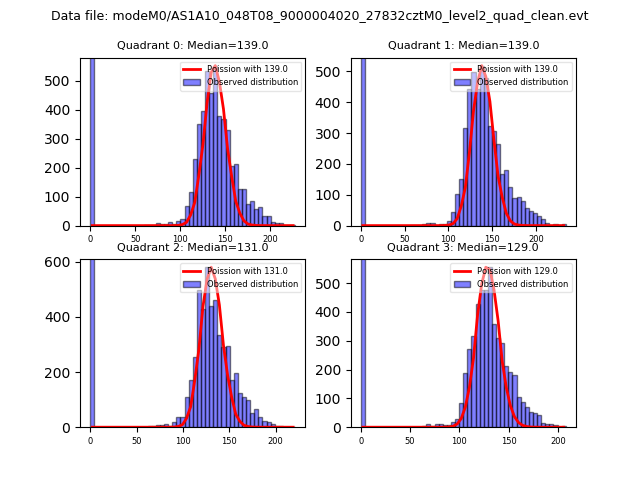 |
 |
| Quadrant-wise count rates Data is divided into 100 sec bins |
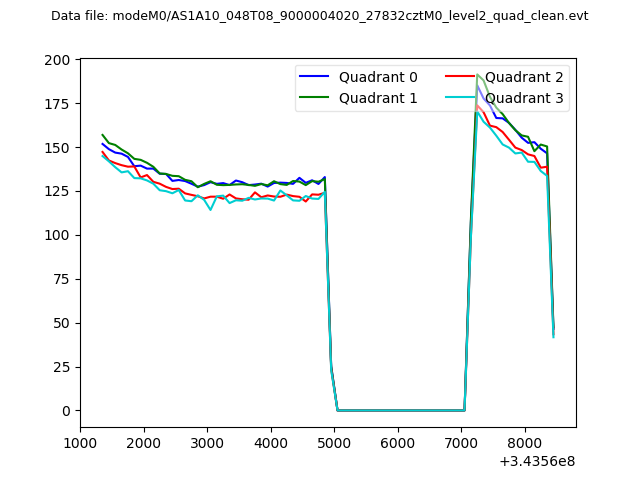 |
|
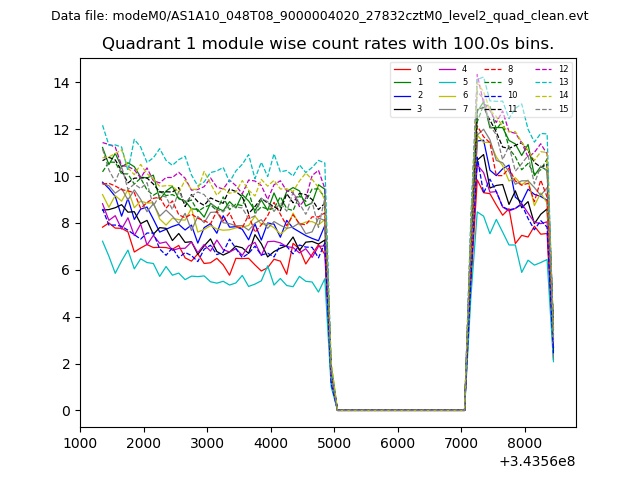
| Module-wise count rates for Quadrant A Data is divided into 100 sec bins |
 |
 |
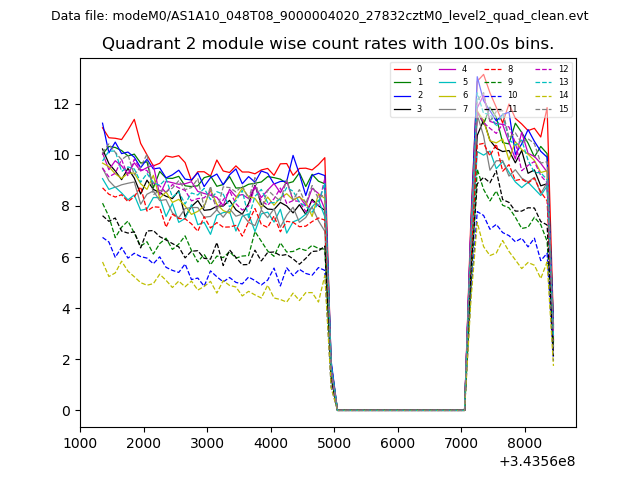
| Module-wise count rates for Quadrant B Data is divided into 100 sec bins |
 |
 |
| Module-wise count rates for Quadrant C Data is divided into 100 sec bins |
 |
 |
| Module-wise count rates for Quadrant D Data is divided into 100 sec bins |
 |
 |
| Parameter | Plot |
|---|---|
| CZT HV Monitor | 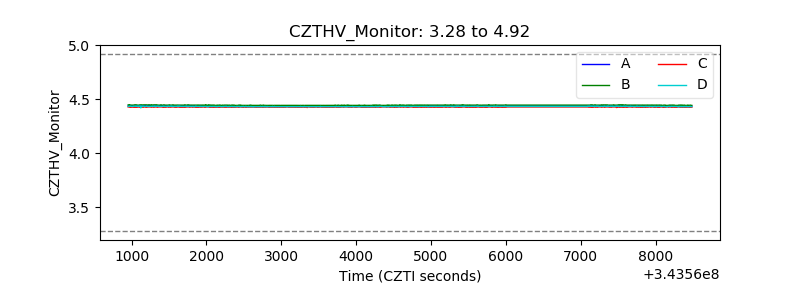 |
| D_VDD | 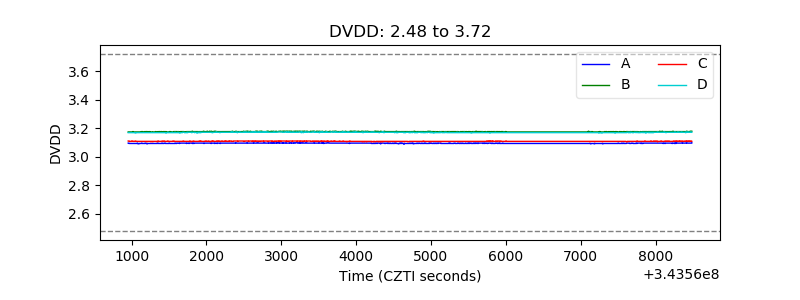 |
| Temperature 1 |  |
| Veto HV Monitor | 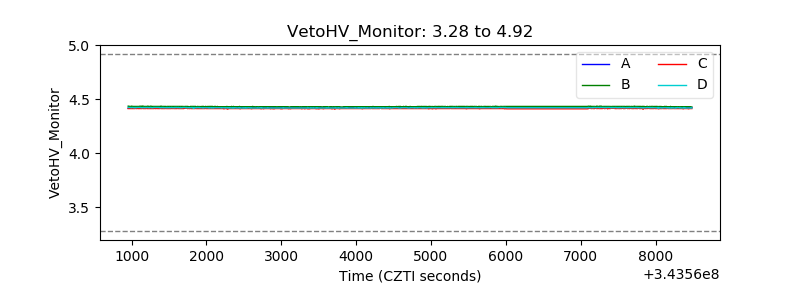 |
| Veto LLD | 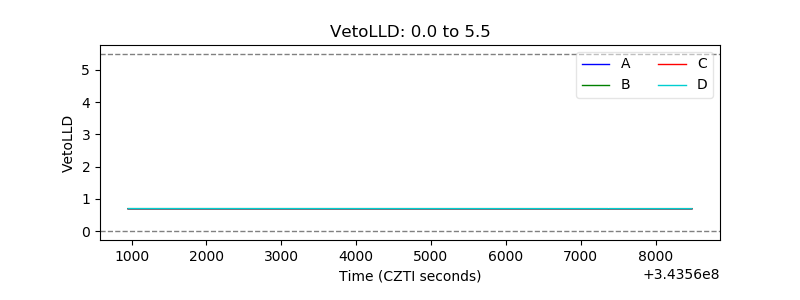 |
| Alpha Counter | 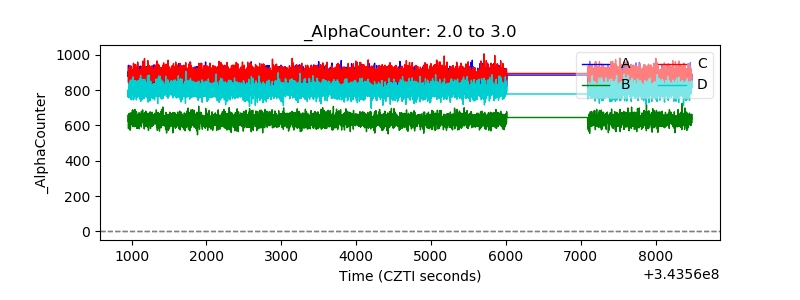 |
| _CPM_Rate | 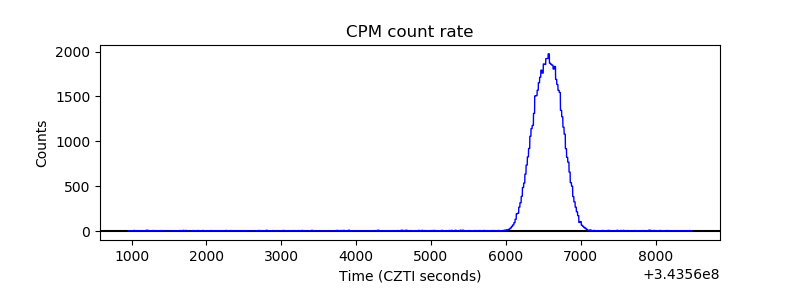 |
| CZT Counter | 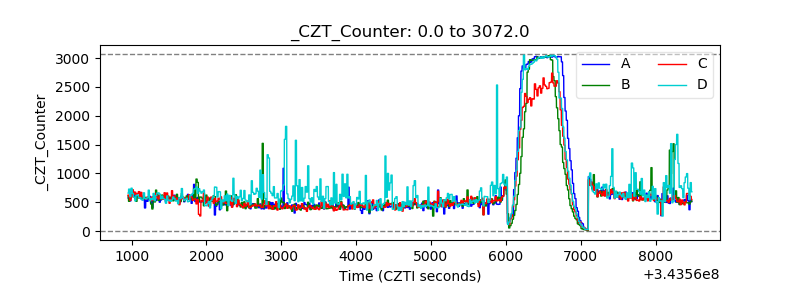 |
| +2.5 Volts monitor |  |
| +5 Volts monitor | 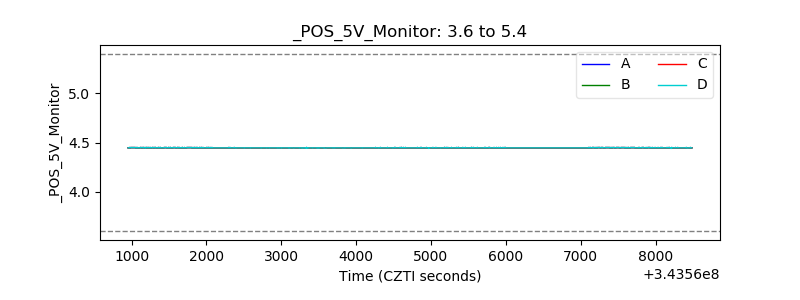 |
| _ROLL_ROT | 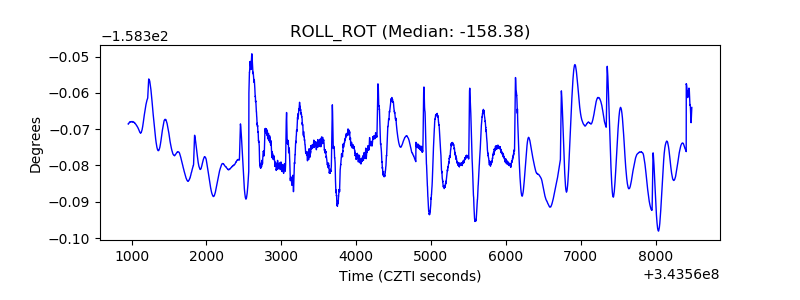 |
| _Roll_DEC | 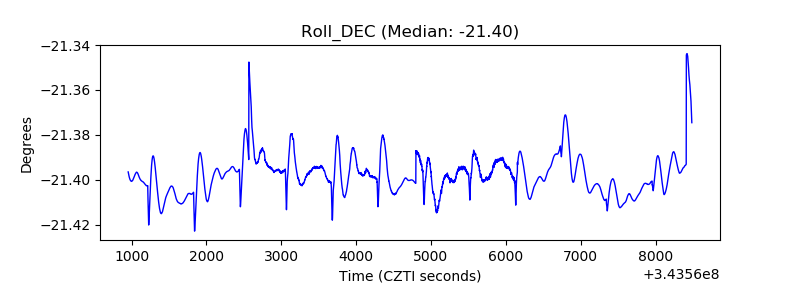 |
| _Roll_RA | 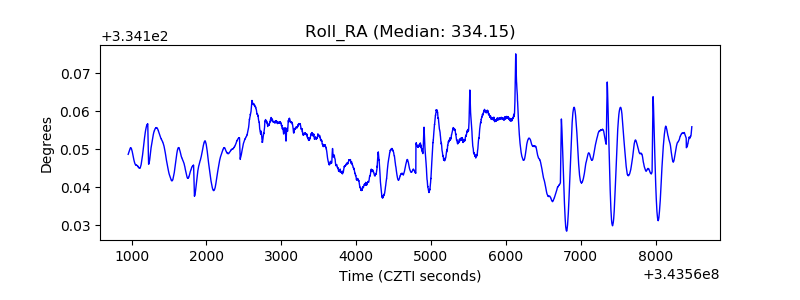 |
| Veto Counter |  |