| Param | Original file | Final file |
|---|---|---|
| Filename | modeM0/AS1A10_002T04_9000004022_27833cztM0_level2.evt | modeM0/AS1A10_002T04_9000004022_27833cztM0_level2_quad_clean.evt |
| Size (bytes) | 230,106,240 | 45,610,560 |
| Size | 219.4 MB | 43.5 MB |
| Events in quadrant A | 1,572,870 | 306,842 |
| Events in quadrant B | 1,632,122 | 303,795 |
| Events in quadrant C | 1,678,557 | 285,040 |
| Events in quadrant D | 1,889,822 | 281,643 |
| Mode M9 | |||
|---|---|---|---|
| Quadrant | BADHDUFLAG | Total packets | Discarded packets |
| A | 0 | 11 | 0 |
| B | 0 | 11 | 0 |
| C | 0 | 11 | 0 |
| D | 0 | 11 | 0 |
| Mode M0 | |||
|---|---|---|---|
| Quadrant | BADHDUFLAG | Total packets | Discarded packets |
| A | 0 | 6549 | 0 |
| B | 0 | 6779 | 0 |
| C | 0 | 6957 | 0 |
| D | 0 | 7611 | 0 |
| Quadrant | Total seconds | Saturated seconds | Saturation percentage |
|---|---|---|---|
| A | 2846 | 53 | 1.862263% |
| B | 2846 | 77 | 2.705552% |
| C | 2846 | 87 | 3.056922% |
| D | 2846 | 93 | 3.267744% |
Noise dominated data is calculated using 1-second bins in cleaned event files. If a bin has >2000 counts, and if more than 50% of those come from <1% of pixels, then it is considered to be noise-dominated and hence unusable.
| Quadrant | # 1 sec bins | Bins with >0 counts | Bins with >2000 counts | High rate bins dominated by noise | Noise dominated (total time) | Noise dominated (detector-on time) | Marked lightcurve |
|---|---|---|---|---|---|---|---|
| A | 4036 | 2846 | 0 | 0 | 0.00% | 0.00% | 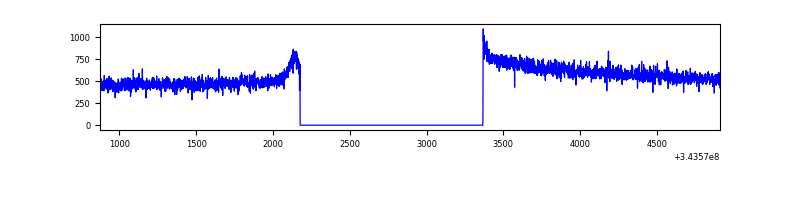 |
| B | 4036 | 2846 | 0 | 0 | 0.00% | 0.00% | 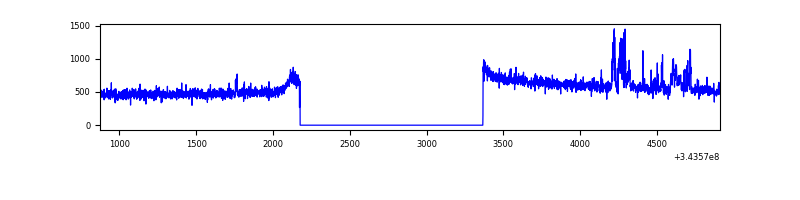 |
| C | 4036 | 2846 | 0 | 0 | 0.00% | 0.00% | 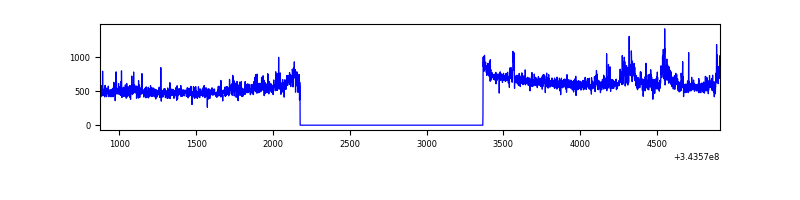 |
| D | 4036 | 2846 | 46 | 46 | 1.14% | 1.62% | 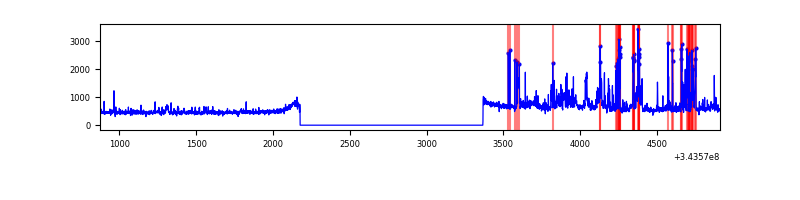 |
Top three noisy pixels from each quadrant. If the there are fewer than three noisy pixels in the level2.evt file, extra rows are filled as -1
| Pixel properties | Quadrant properties | ||||||
|---|---|---|---|---|---|---|---|
| Quadrant | DetID | PixID | Counts | Sigma | Mean | Median | Sigma |
| A | 13 | 254 | 5161 | 58.26 | 407 | 399 | 81.7 |
| A | 3 | 137 | 3623 | 39.45 | 407 | 399 | 81.7 |
| A | 0 | 226 | 3398 | 36.69 | 407 | 399 | 81.7 |
| B | 0 | 190 | 49026 | 650.32 | 395 | 386 | 74.8 |
| B | 15 | 32 | 23943 | 314.96 | 395 | 386 | 74.8 |
| B | 12 | 111 | 8877 | 113.53 | 395 | 386 | 74.8 |
| C | 3 | 233 | 135916 | 1538.27 | 379 | 381 | 88.1 |
| C | 14 | 238 | 61877 | 697.96 | 379 | 381 | 88.1 |
| C | 13 | 61 | 2683 | 26.13 | 379 | 381 | 88.1 |
| D | 1 | 52 | 414553 | 4470.2 | 387 | 378 | 92.7 |
| D | 2 | 234 | 9963 | 103.45 | 387 | 378 | 92.7 |
| D | 14 | 35 | 5095 | 50.91 | 387 | 378 | 92.7 |
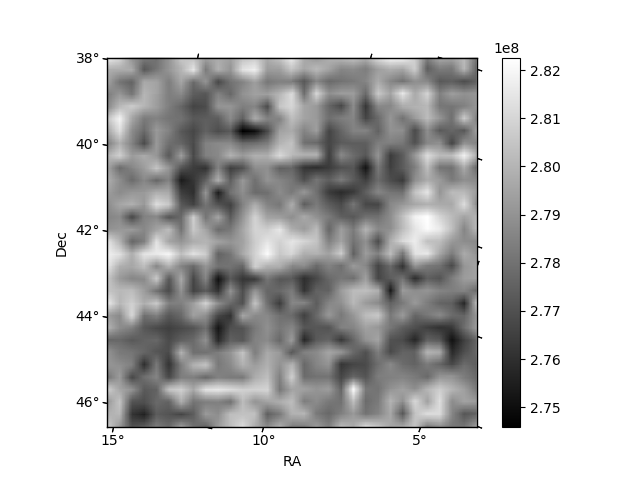
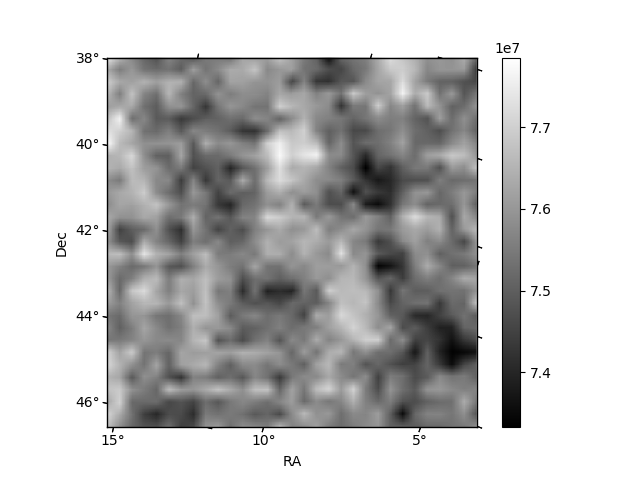
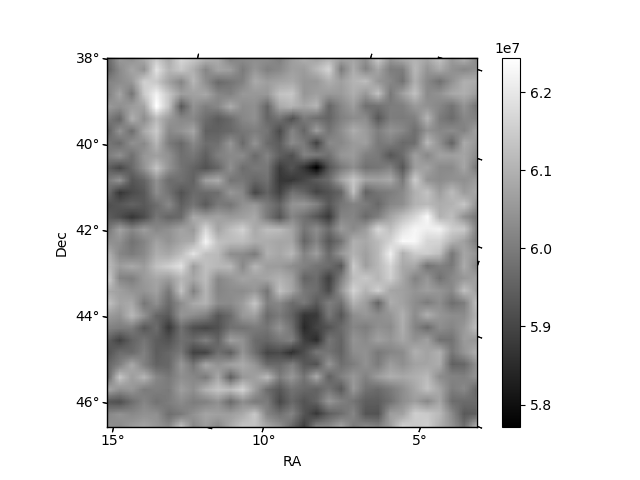
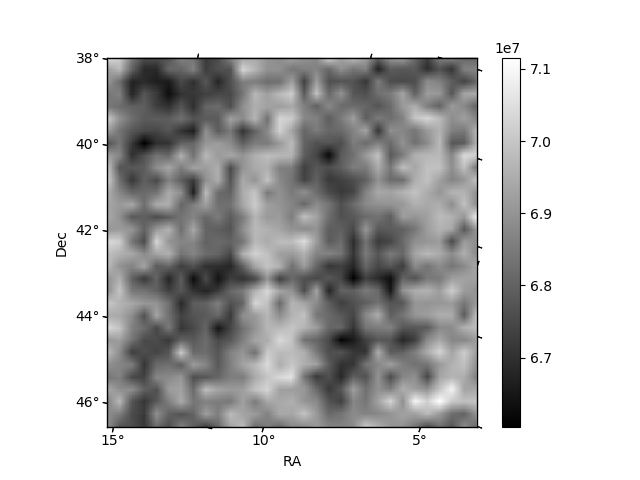
Histogram calculated using DETX and DETY for each event in the final _common_clean file
| Quadrant A | 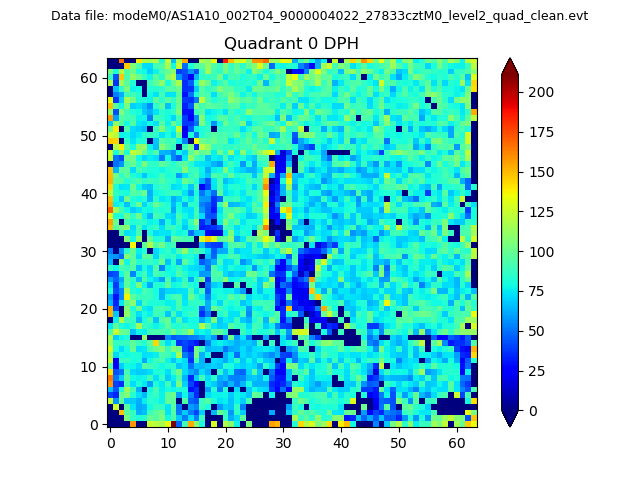 |
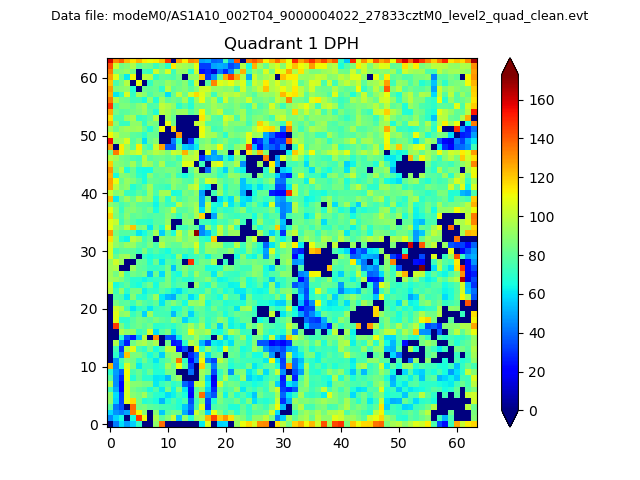 |
Quadrant B |
|---|---|---|---|
| Quadrant D | 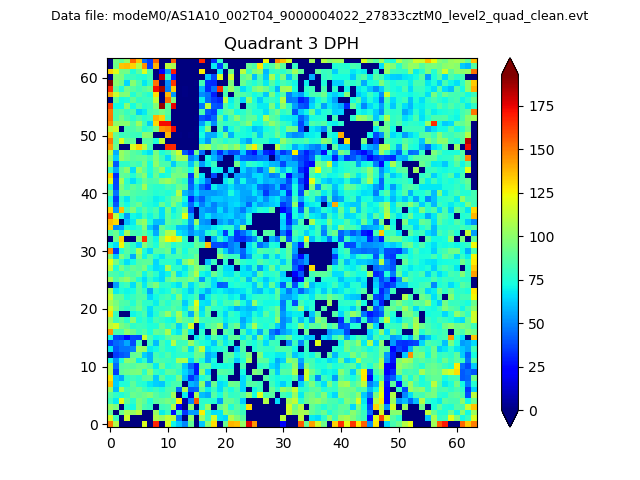 |
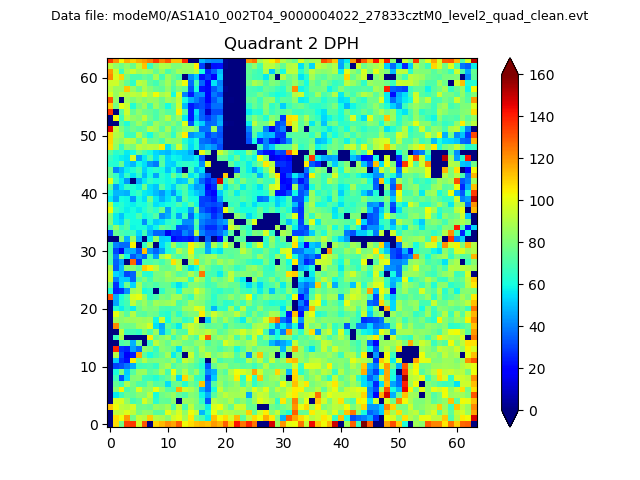 |
Quadrant C |
| Plot type | Count rate plots | Images |
|---|---|---|
| Comparison with Poisson distribution Blue bars denote a histogram of data divided into 1 sec bins. Red curve is a Poisson curve with rate = median count rate of data. |
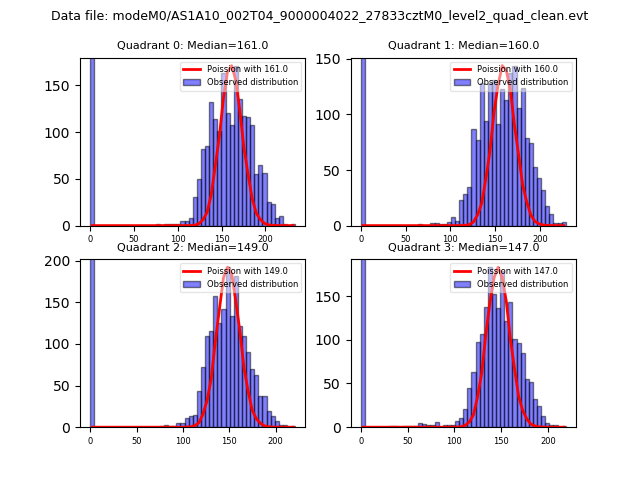 |
 |
| Quadrant-wise count rates Data is divided into 100 sec bins |
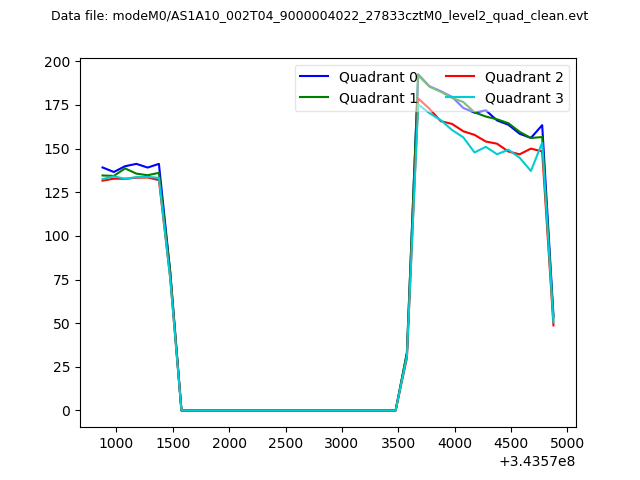 |
|
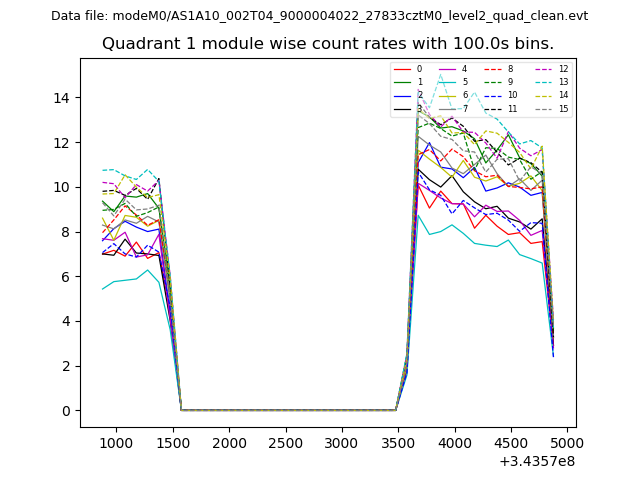
| Module-wise count rates for Quadrant A Data is divided into 100 sec bins |
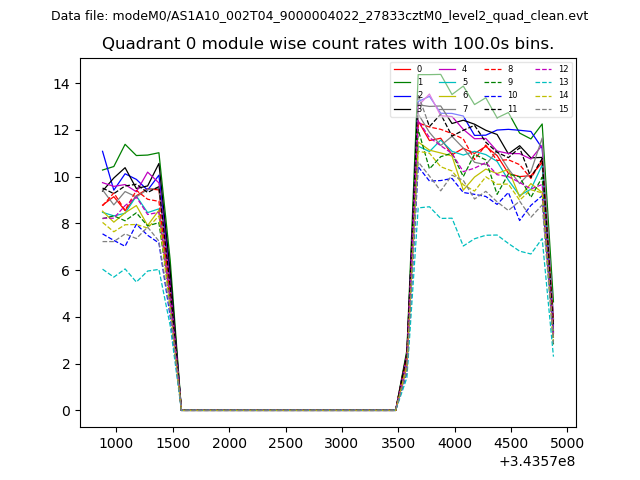 |
 |
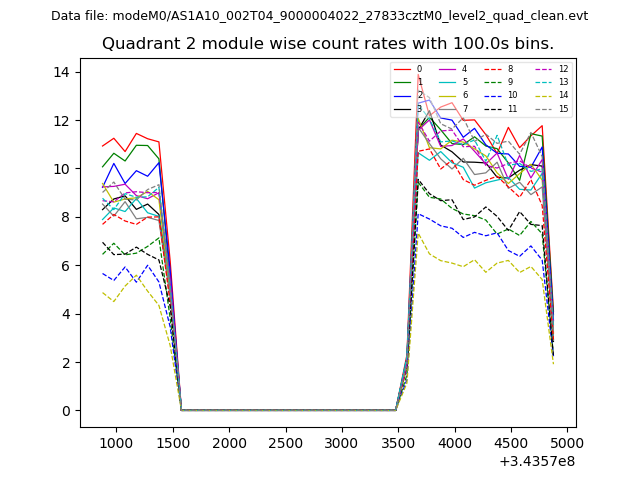
| Module-wise count rates for Quadrant B Data is divided into 100 sec bins |
 |
 |
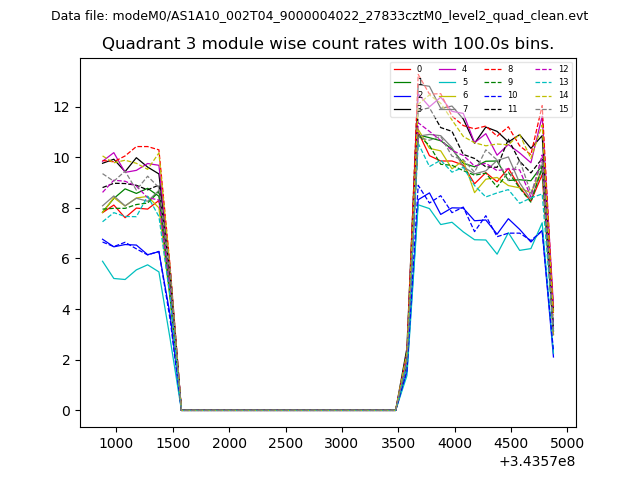
| Module-wise count rates for Quadrant C Data is divided into 100 sec bins |
 |
 |
| Module-wise count rates for Quadrant D Data is divided into 100 sec bins |
 |
 |
| Parameter | Plot |
|---|---|
| CZT HV Monitor | 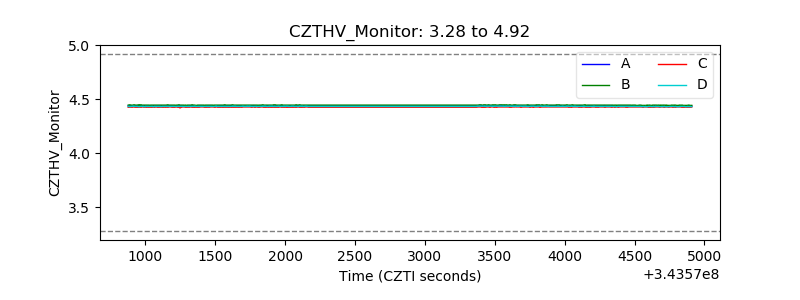 |
| D_VDD | 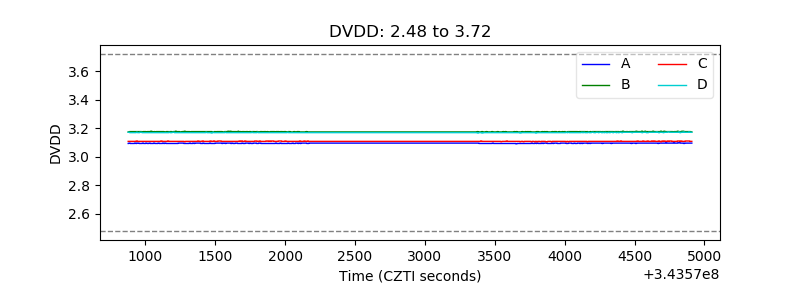 |
| Temperature 1 | 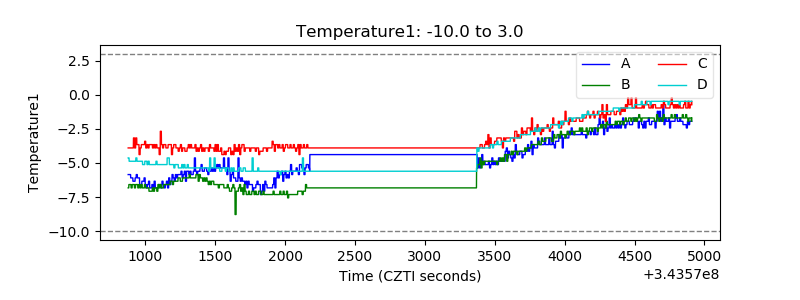 |
| Veto HV Monitor |  |
| Veto LLD | 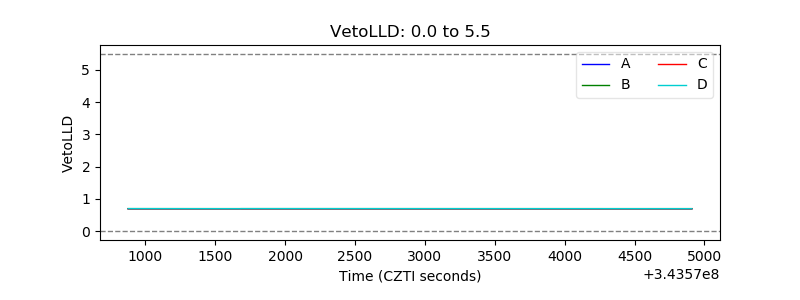 |
| Alpha Counter | 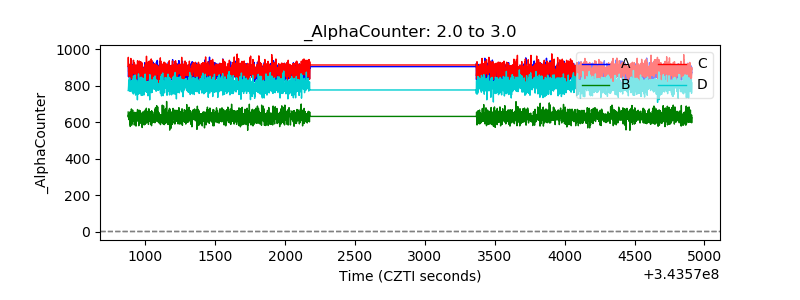 |
| _CPM_Rate | 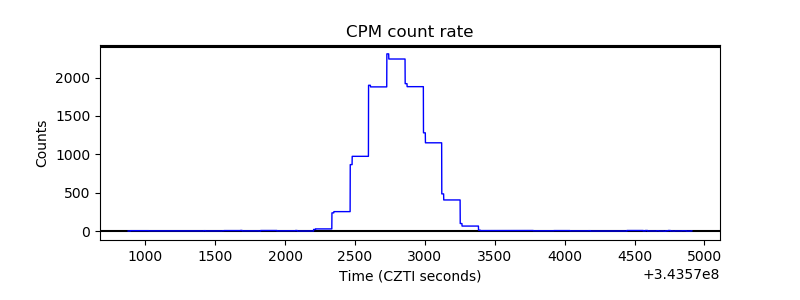 |
| CZT Counter | 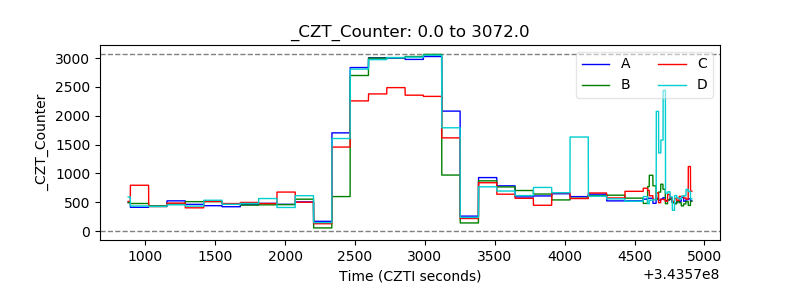 |
| +2.5 Volts monitor |  |
| +5 Volts monitor |  |
| _ROLL_ROT | 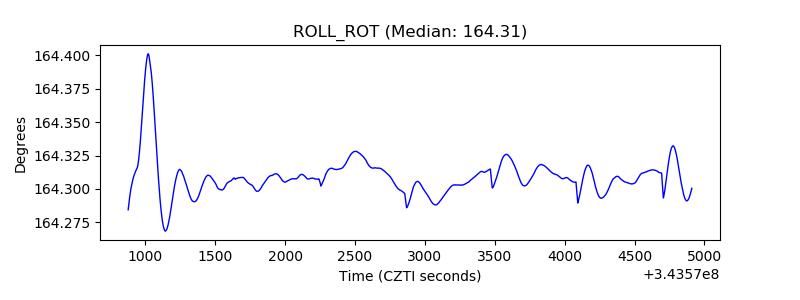 |
| _Roll_DEC | 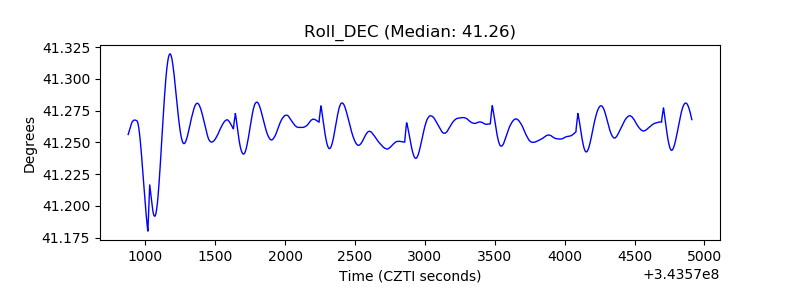 |
| _Roll_RA | 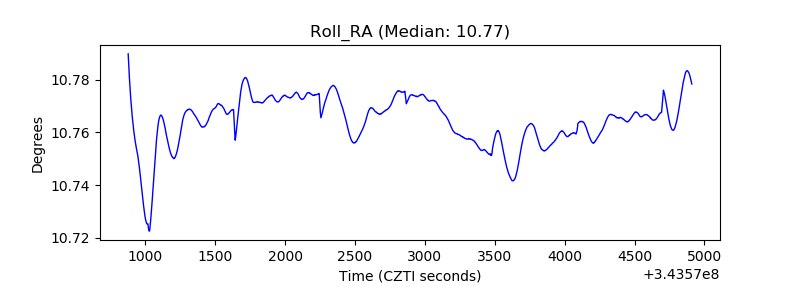 |
| Veto Counter | 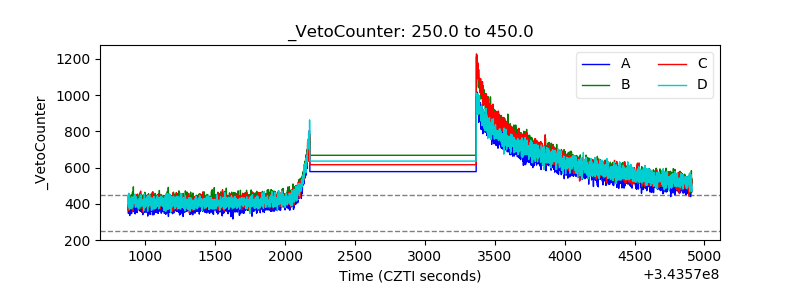 |