| Param | Original file | Final file |
|---|---|---|
| Filename | modeM0/AS1A10_002T04_9000004022_27834cztM0_level2.evt | modeM0/AS1A10_002T04_9000004022_27834cztM0_level2_quad_clean.evt |
| Size (bytes) | 641,301,120 | 116,470,080 |
| Size | 611.6 MB | 111.1 MB |
| Events in quadrant A | 3,249,414 | 842,633 |
| Events in quadrant B | 3,365,726 | 822,307 |
| Events in quadrant C | 3,820,442 | 772,274 |
| Events in quadrant D | 8,573,816 | 664,221 |
| Mode M9 | |||
|---|---|---|---|
| Quadrant | BADHDUFLAG | Total packets | Discarded packets |
| A | 0 | 13 | 0 |
| B | 0 | 13 | 0 |
| C | 0 | 13 | 0 |
| D | 0 | 13 | 0 |
| Mode M0 | |||
|---|---|---|---|
| Quadrant | BADHDUFLAG | Total packets | Discarded packets |
| A | 0 | 13438 | 0 |
| B | 0 | 13866 | 0 |
| C | 0 | 15426 | 0 |
| D | 0 | 29706 | 0 |
| Quadrant | Total seconds | Saturated seconds | Saturation percentage |
|---|---|---|---|
| A | 6095 | 88 | 1.443806% |
| B | 6096 | 103 | 1.689633% |
| C | 6095 | 152 | 2.493847% |
| D | 6095 | 2105 | 34.536505% |
Noise dominated data is calculated using 1-second bins in cleaned event files. If a bin has >2000 counts, and if more than 50% of those come from <1% of pixels, then it is considered to be noise-dominated and hence unusable.
| Quadrant | # 1 sec bins | Bins with >0 counts | Bins with >2000 counts | High rate bins dominated by noise | Noise dominated (total time) | Noise dominated (detector-on time) | Marked lightcurve |
|---|---|---|---|---|---|---|---|
| A | 7345 | 6095 | 0 | 0 | 0.00% | 0.00% |  |
| B | 7346 | 6096 | 3 | 3 | 0.04% | 0.05% |  |
| C | 7345 | 6095 | 12 | 12 | 0.16% | 0.20% |  |
| D | 7345 | 6095 | 2053 | 2053 | 27.95% | 33.68% | 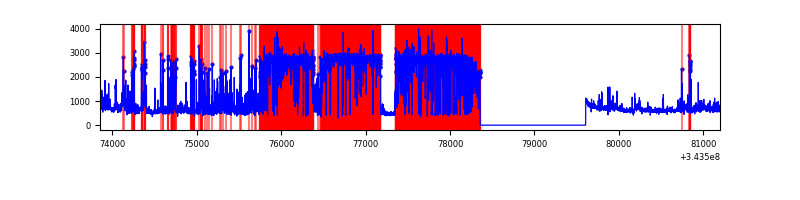 |
Top three noisy pixels from each quadrant. If the there are fewer than three noisy pixels in the level2.evt file, extra rows are filled as -1
| Pixel properties | Quadrant properties | ||||||
|---|---|---|---|---|---|---|---|
| Quadrant | DetID | PixID | Counts | Sigma | Mean | Median | Sigma |
| A | 13 | 254 | 11588 | 64.63 | 841 | 824 | 166.6 |
| A | 0 | 226 | 7278 | 38.75 | 841 | 824 | 166.6 |
| A | 3 | 137 | 7202 | 38.29 | 841 | 824 | 166.6 |
| B | 0 | 190 | 78156 | 508.78 | 816 | 798 | 152.0 |
| B | 15 | 32 | 64824 | 421.1 | 816 | 798 | 152.0 |
| B | 12 | 111 | 17646 | 110.81 | 816 | 798 | 152.0 |
| C | 3 | 233 | 622928 | 3451.31 | 786 | 791 | 180.3 |
| C | 14 | 238 | 128060 | 706.03 | 786 | 791 | 180.3 |
| C | 13 | 61 | 5423 | 25.7 | 786 | 791 | 180.3 |
| D | 1 | 52 | 6000038 | 38970.98 | 663 | 649 | 153.9 |
| D | 2 | 250 | 40557 | 259.23 | 663 | 649 | 153.9 |
| D | 2 | 234 | 20867 | 131.33 | 663 | 649 | 153.9 |
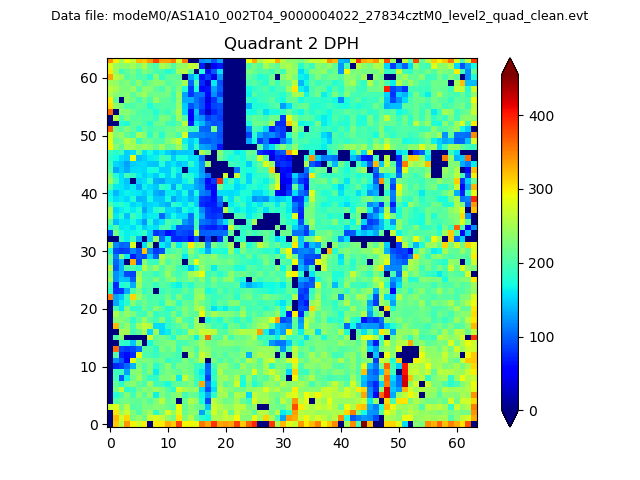
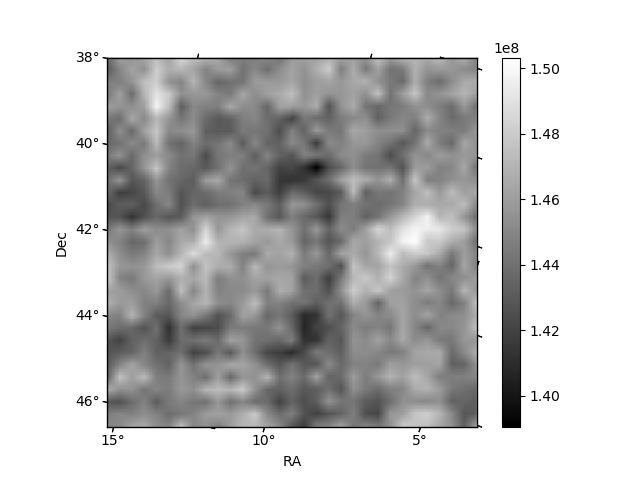
Histogram calculated using DETX and DETY for each event in the final _common_clean file
| Quadrant A | 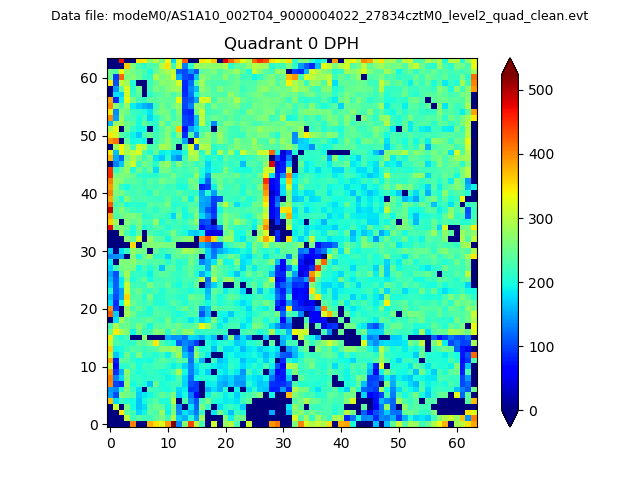 |
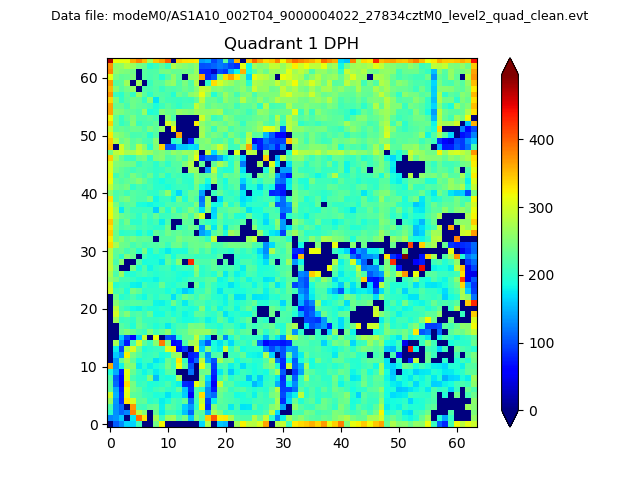 |
Quadrant B |
|---|---|---|---|
| Quadrant D | 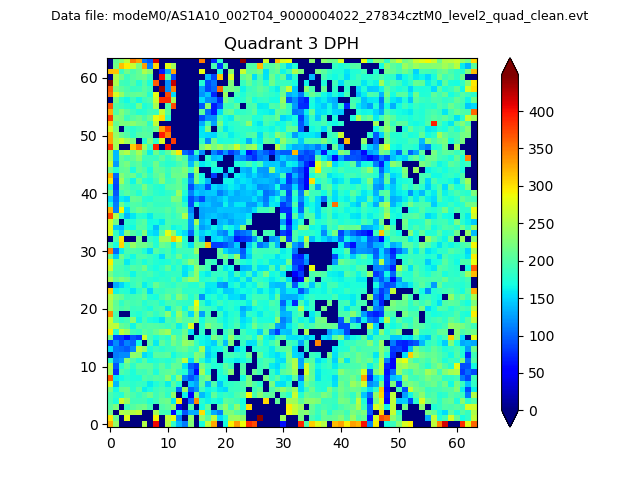 |
 |
Quadrant C |
| Plot type | Count rate plots | Images |
|---|---|---|
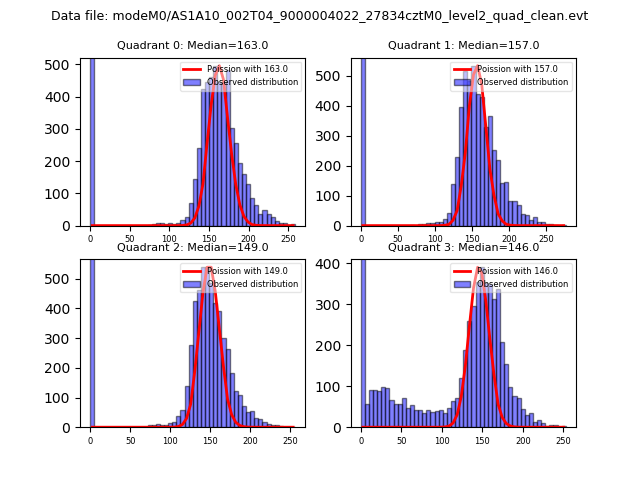
| Comparison with Poisson distribution Blue bars denote a histogram of data divided into 1 sec bins. Red curve is a Poisson curve with rate = median count rate of data. |
 |
 |
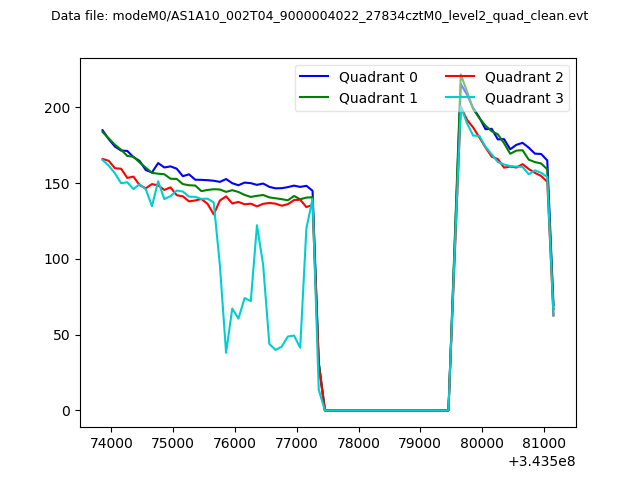
| Quadrant-wise count rates Data is divided into 100 sec bins |
 |
|
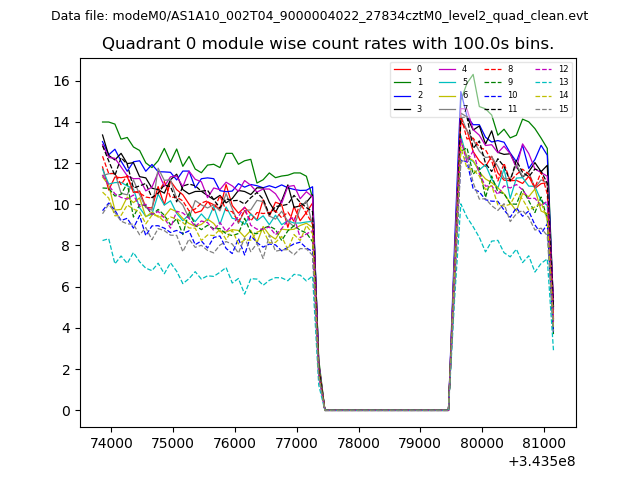
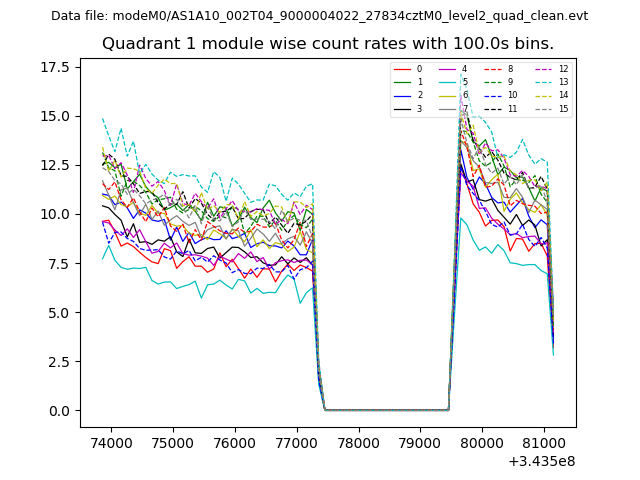
| Module-wise count rates for Quadrant A Data is divided into 100 sec bins |
 |
 |
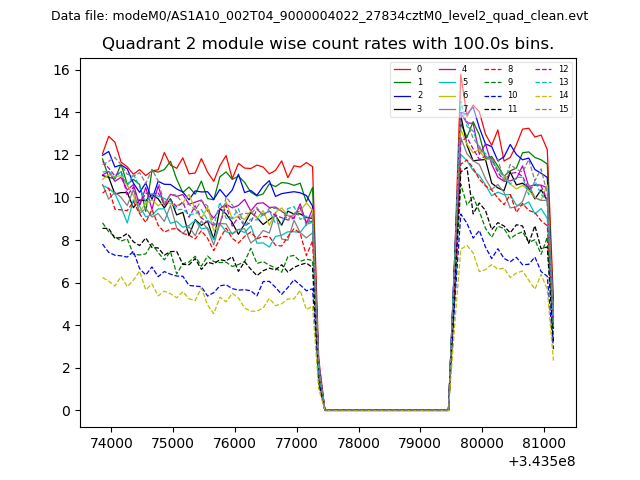
| Module-wise count rates for Quadrant B Data is divided into 100 sec bins |
 |
 |
| Module-wise count rates for Quadrant C Data is divided into 100 sec bins |
 |
 |
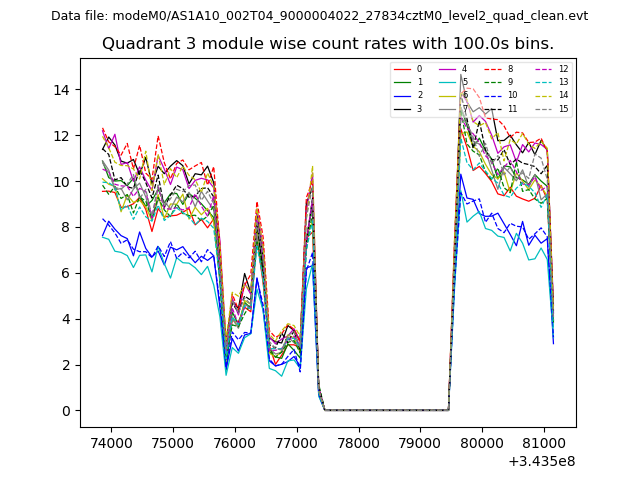
| Module-wise count rates for Quadrant D Data is divided into 100 sec bins |
 |
 |
| Parameter | Plot |
|---|---|
| CZT HV Monitor | 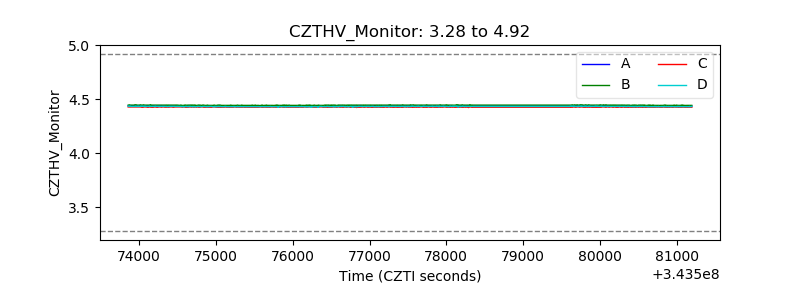 |
| D_VDD | 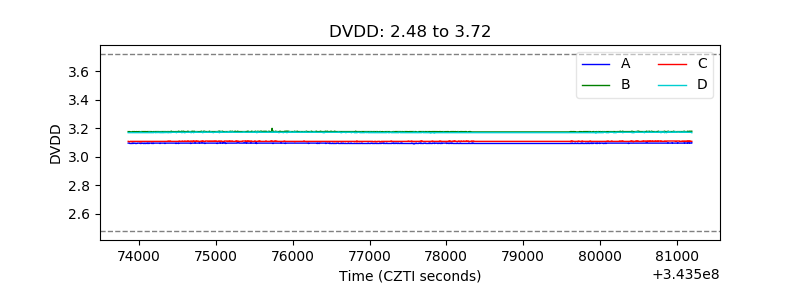 |
| Temperature 1 | 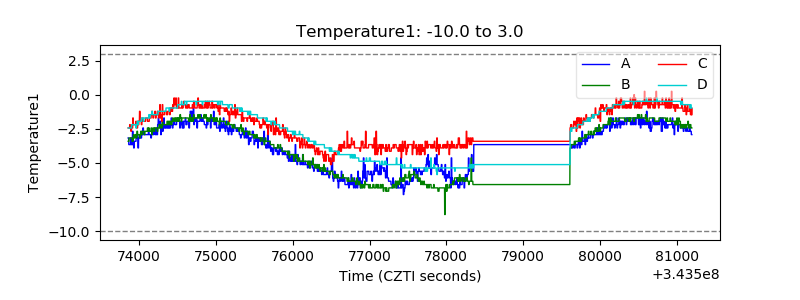 |
| Veto HV Monitor | 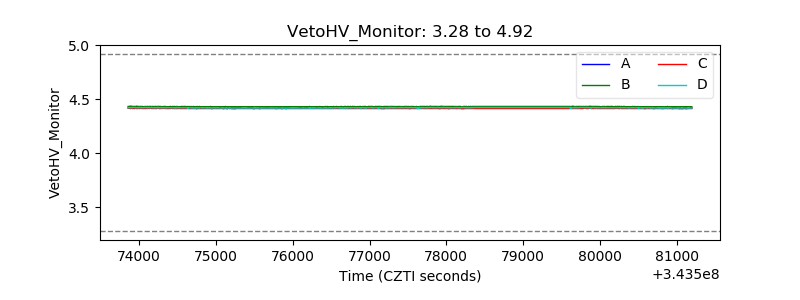 |
| Veto LLD | 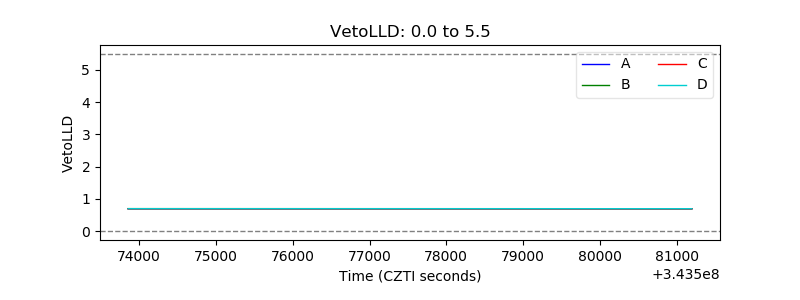 |
| Alpha Counter | 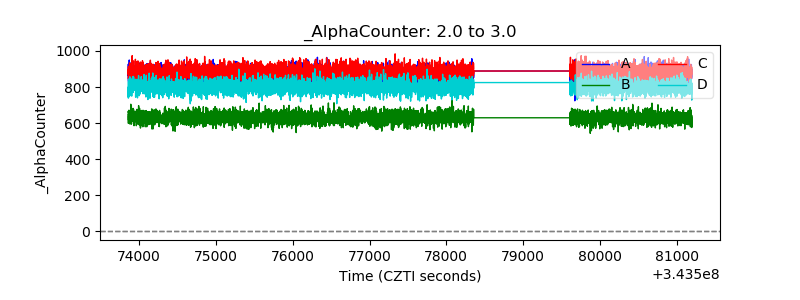 |
| _CPM_Rate | 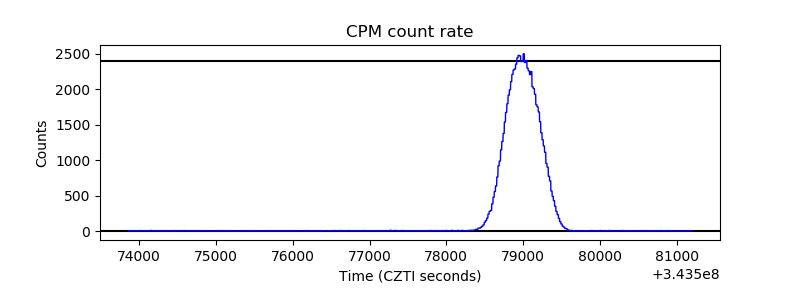 |
| CZT Counter | 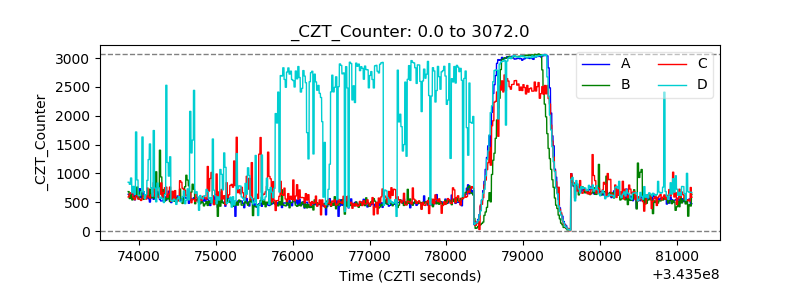 |
| +2.5 Volts monitor |  |
| +5 Volts monitor |  |
| _ROLL_ROT | 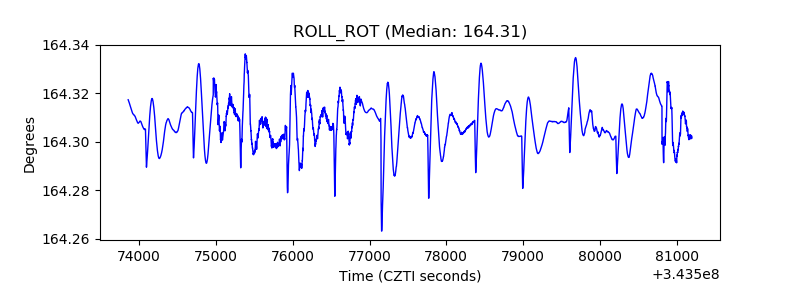 |
| _Roll_DEC | 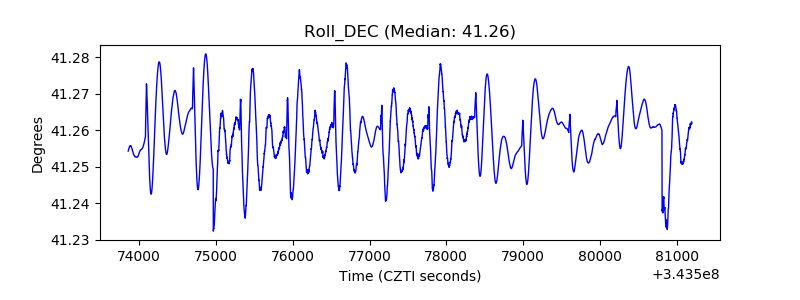 |
| _Roll_RA | 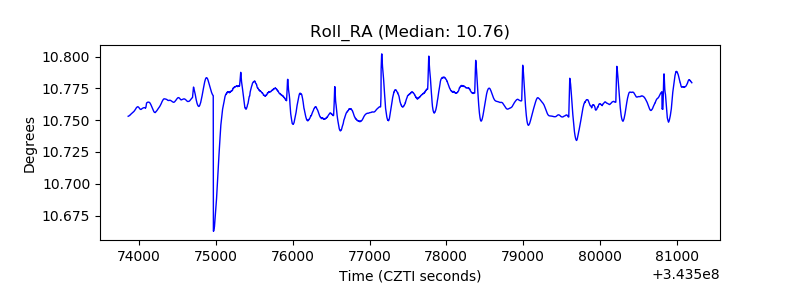 |
| Veto Counter | 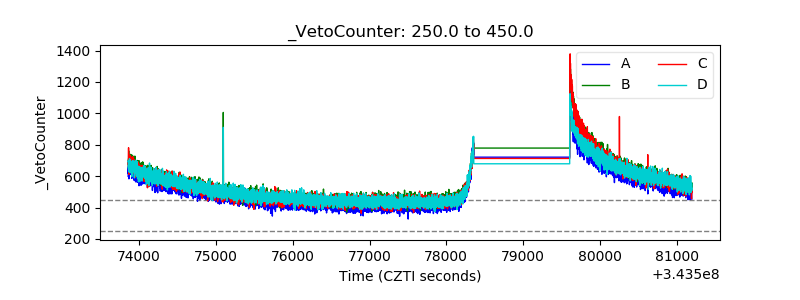 |