| Param | Original file | Final file |
|---|---|---|
| Filename | modeM0/AS1A10_002T04_9000004022_27835cztM0_level2.evt | modeM0/AS1A10_002T04_9000004022_27835cztM0_level2_quad_clean.evt |
| Size (bytes) | 506,399,040 | 122,497,920 |
| Size | 482.9 MB | 116.8 MB |
| Events in quadrant A | 3,473,480 | 853,206 |
| Events in quadrant B | 3,591,785 | 833,102 |
| Events in quadrant C | 3,662,283 | 793,037 |
| Events in quadrant D | 4,173,551 | 783,344 |
| Mode M9 | |||
|---|---|---|---|
| Quadrant | BADHDUFLAG | Total packets | Discarded packets |
| A | 0 | 12 | 0 |
| B | 0 | 12 | 0 |
| C | 0 | 12 | 0 |
| D | 0 | 12 | 0 |
| Mode M0 | |||
|---|---|---|---|
| Quadrant | BADHDUFLAG | Total packets | Discarded packets |
| A | 0 | 14335 | 0 |
| B | 0 | 14716 | 0 |
| C | 0 | 14997 | 0 |
| D | 0 | 16777 | 0 |
| Quadrant | Total seconds | Saturated seconds | Saturation percentage |
|---|---|---|---|
| A | 6411 | 105 | 1.637810% |
| B | 6411 | 135 | 2.105756% |
| C | 6410 | 139 | 2.168487% |
| D | 6410 | 206 | 3.213729% |
Noise dominated data is calculated using 1-second bins in cleaned event files. If a bin has >2000 counts, and if more than 50% of those come from <1% of pixels, then it is considered to be noise-dominated and hence unusable.
| Quadrant | # 1 sec bins | Bins with >0 counts | Bins with >2000 counts | High rate bins dominated by noise | Noise dominated (total time) | Noise dominated (detector-on time) | Marked lightcurve |
|---|---|---|---|---|---|---|---|
| A | 7691 | 6411 | 1 | 1 | 0.01% | 0.02% | 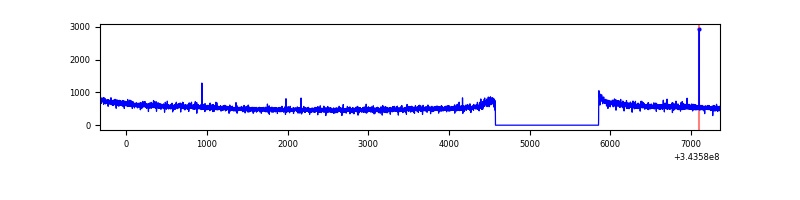 |
| B | 7691 | 6411 | 2 | 2 | 0.03% | 0.03% | 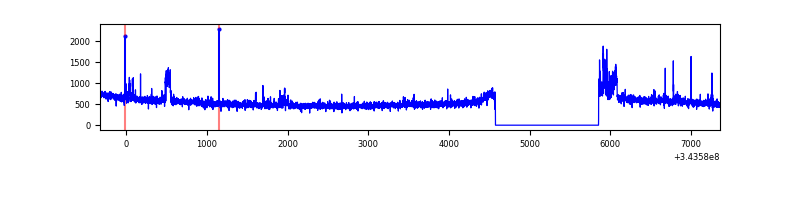 |
| C | 7690 | 6410 | 0 | 0 | 0.00% | 0.00% | 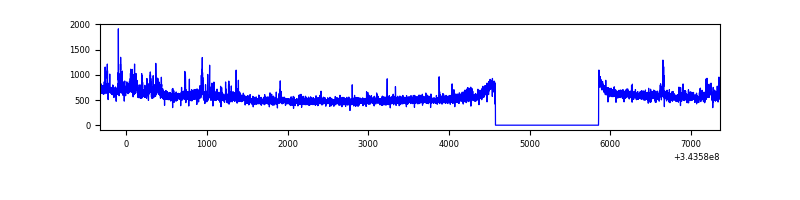 |
| D | 7690 | 6410 | 120 | 120 | 1.56% | 1.87% | 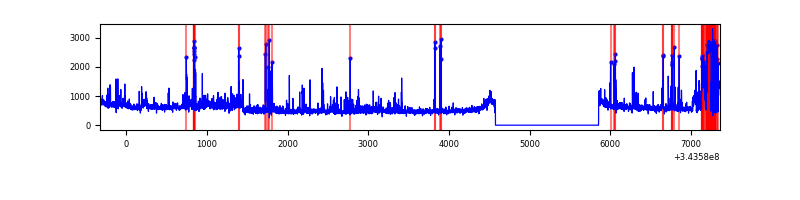 |
Top three noisy pixels from each quadrant. If the there are fewer than three noisy pixels in the level2.evt file, extra rows are filled as -1
| Pixel properties | Quadrant properties | ||||||
|---|---|---|---|---|---|---|---|
| Quadrant | DetID | PixID | Counts | Sigma | Mean | Median | Sigma |
| A | 13 | 254 | 11757 | 61.52 | 899 | 884 | 176.7 |
| A | 0 | 226 | 7871 | 39.53 | 899 | 884 | 176.7 |
| A | 3 | 137 | 7648 | 38.27 | 899 | 884 | 176.7 |
| B | 0 | 190 | 107379 | 666.17 | 871 | 853 | 159.9 |
| B | 15 | 32 | 42995 | 263.54 | 871 | 853 | 159.9 |
| B | 12 | 111 | 18540 | 110.61 | 871 | 853 | 159.9 |
| C | 3 | 233 | 227305 | 1166.37 | 845 | 852 | 194.2 |
| C | 14 | 238 | 138145 | 707.14 | 845 | 852 | 194.2 |
| C | 13 | 61 | 5754 | 25.25 | 845 | 852 | 194.2 |
| D | 1 | 52 | 778097 | 3851.41 | 863 | 845 | 201.8 |
| D | 2 | 250 | 60060 | 293.42 | 863 | 845 | 201.8 |
| D | 2 | 120 | 36037 | 174.38 | 863 | 845 | 201.8 |
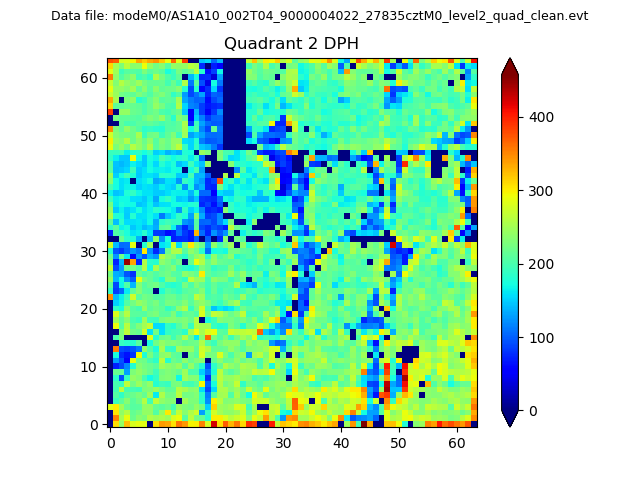
Histogram calculated using DETX and DETY for each event in the final _common_clean file
| Quadrant A | 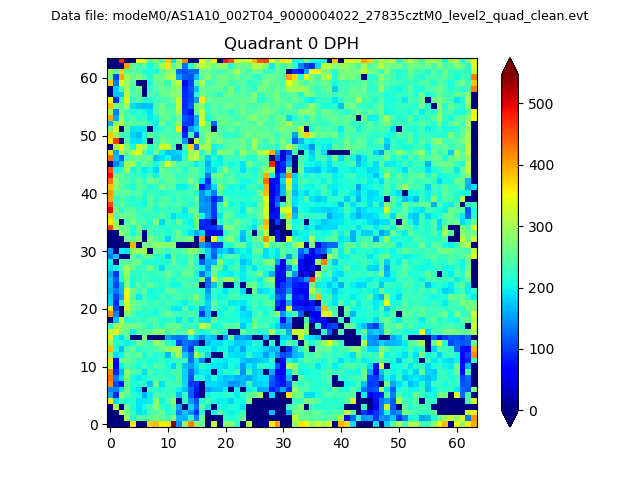 |
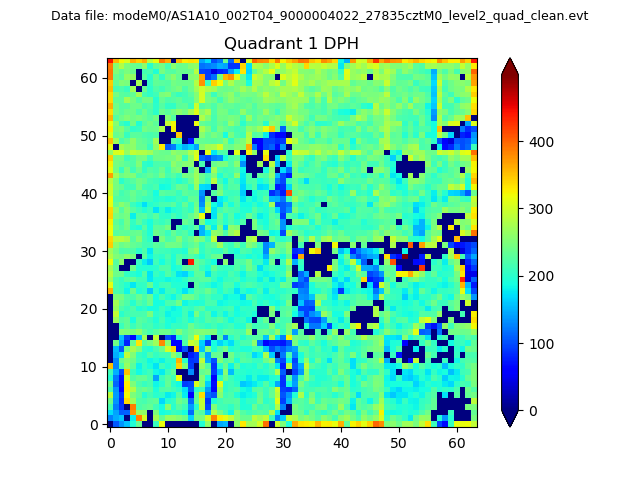 |
Quadrant B |
|---|---|---|---|
| Quadrant D | 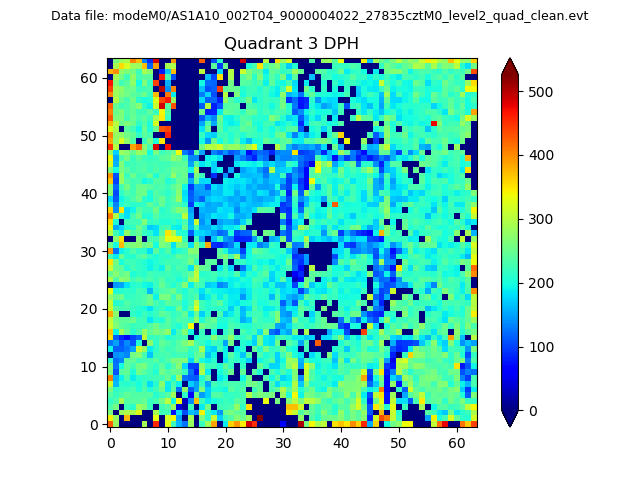 |
 |
Quadrant C |
| Plot type | Count rate plots | Images |
|---|---|---|
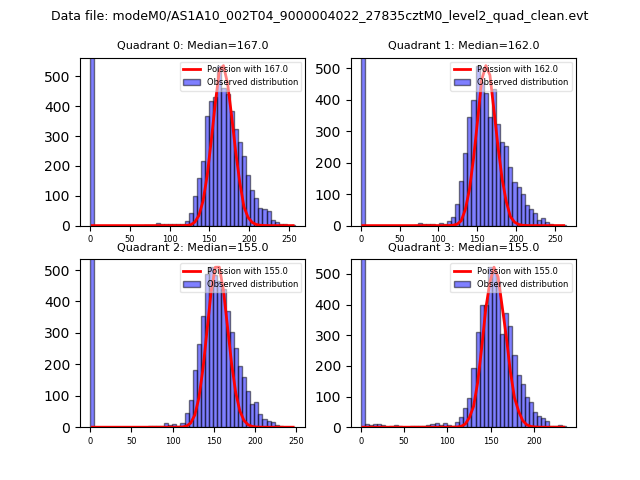
| Comparison with Poisson distribution Blue bars denote a histogram of data divided into 1 sec bins. Red curve is a Poisson curve with rate = median count rate of data. |
 |
 |
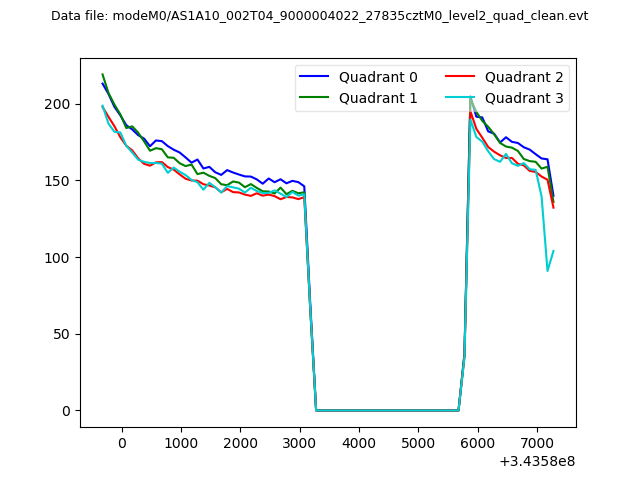
| Quadrant-wise count rates Data is divided into 100 sec bins |
 |
|
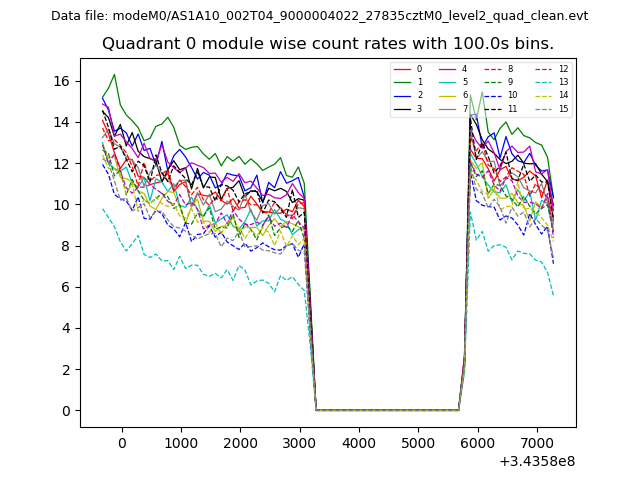
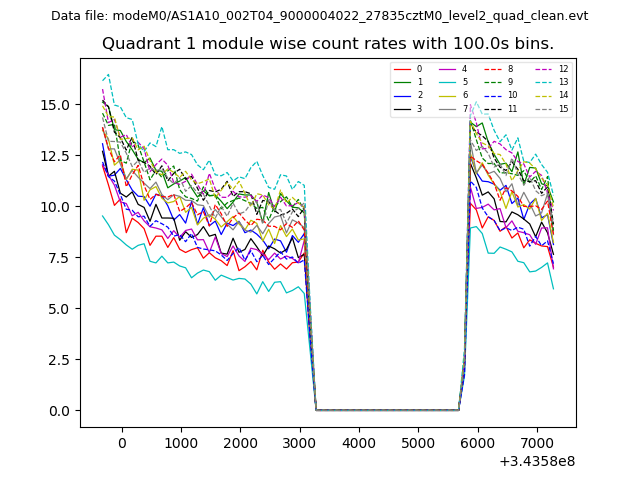
| Module-wise count rates for Quadrant A Data is divided into 100 sec bins |
 |
 |
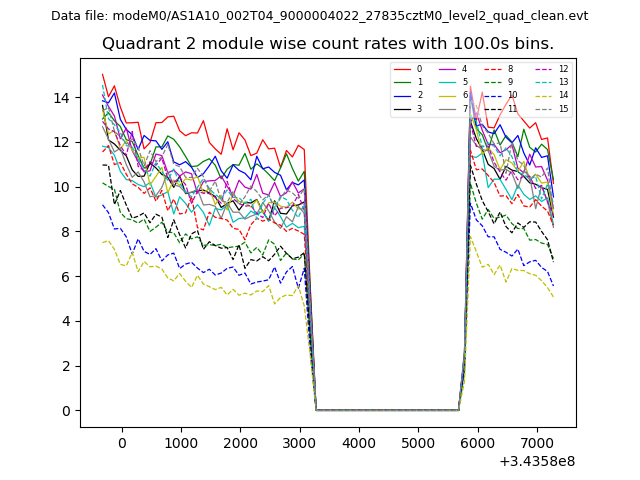
| Module-wise count rates for Quadrant B Data is divided into 100 sec bins |
 |
 |
| Module-wise count rates for Quadrant C Data is divided into 100 sec bins |
 |
 |
| Module-wise count rates for Quadrant D Data is divided into 100 sec bins |
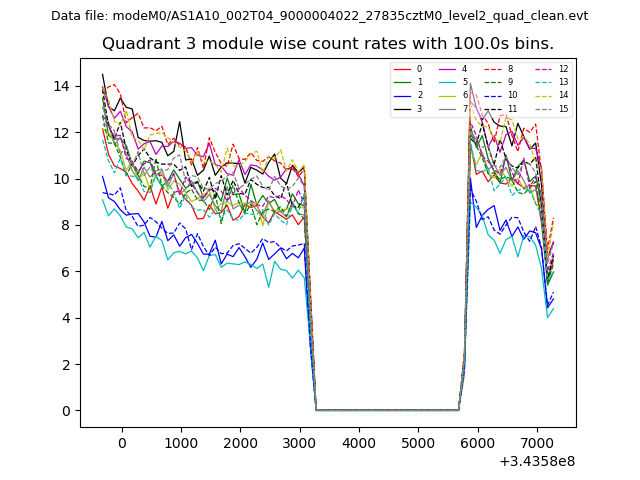 |
 |
| Parameter | Plot |
|---|---|
| CZT HV Monitor |  |
| D_VDD | 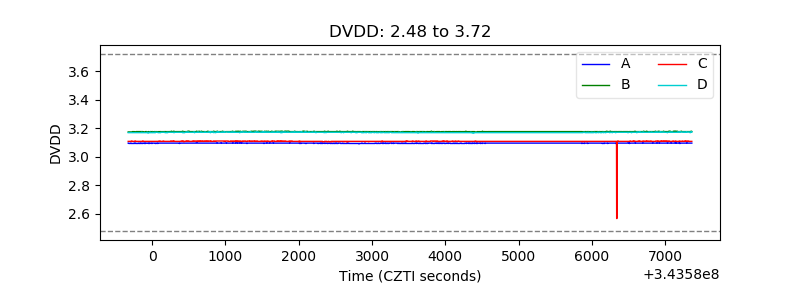 |
| Temperature 1 | 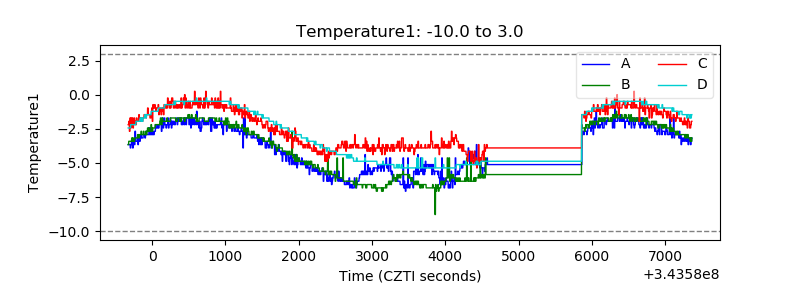 |
| Veto HV Monitor | 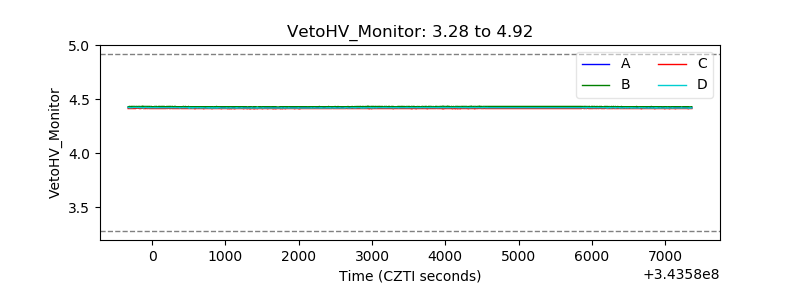 |
| Veto LLD | 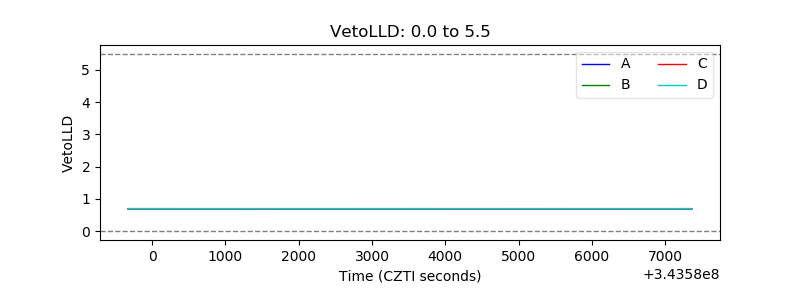 |
| Alpha Counter | 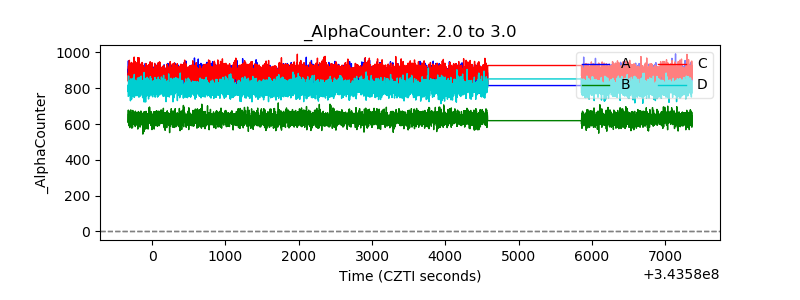 |
| _CPM_Rate | 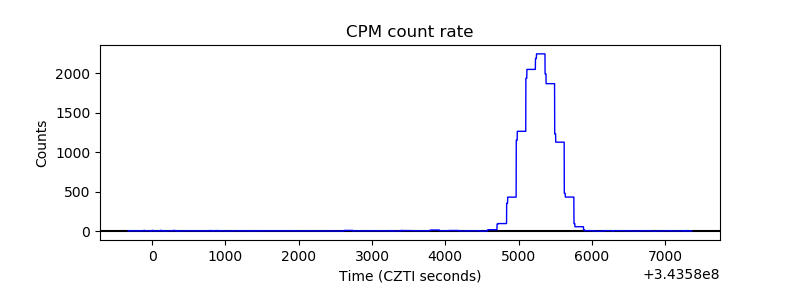 |
| CZT Counter | 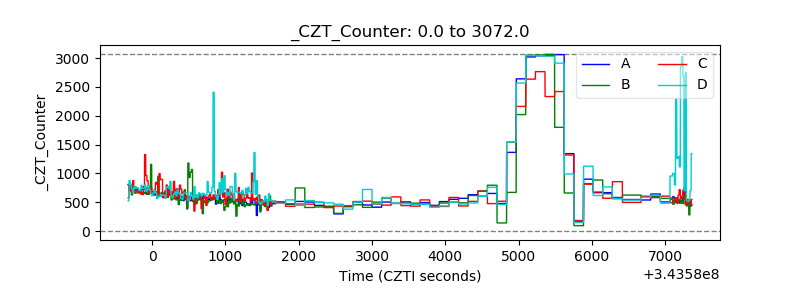 |
| +2.5 Volts monitor |  |
| +5 Volts monitor |  |
| _ROLL_ROT |  |
| _Roll_DEC |  |
| _Roll_RA | 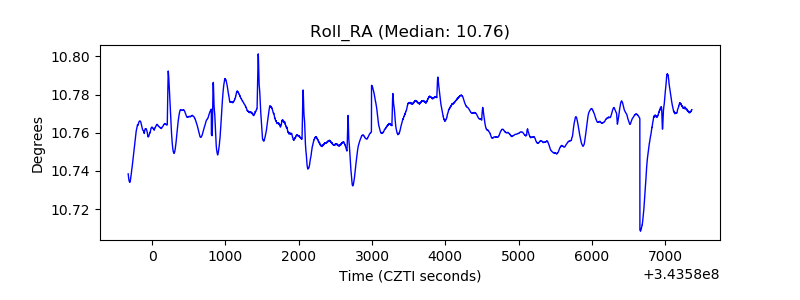 |
| Veto Counter |  |