| Param | Original file | Final file |
|---|---|---|
| Filename | modeM0/AS1A10_002T04_9000004022_27837cztM0_level2.evt | modeM0/AS1A10_002T04_9000004022_27837cztM0_level2_quad_clean.evt |
| Size (bytes) | 470,831,040 | 99,172,800 |
| Size | 449.0 MB | 94.6 MB |
| Events in quadrant A | 3,253,776 | 659,149 |
| Events in quadrant B | 3,340,753 | 644,718 |
| Events in quadrant C | 3,420,031 | 624,063 |
| Events in quadrant D | 3,802,916 | 622,014 |
| Mode M9 | |||
|---|---|---|---|
| Quadrant | BADHDUFLAG | Total packets | Discarded packets |
| A | 0 | 12 | 0 |
| B | 0 | 13 | 0 |
| C | 0 | 13 | 0 |
| D | 0 | 13 | 0 |
| Mode M0 | |||
|---|---|---|---|
| Quadrant | BADHDUFLAG | Total packets | Discarded packets |
| A | 0 | 13715 | 0 |
| B | 0 | 13963 | 0 |
| C | 0 | 14163 | 0 |
| D | 0 | 15683 | 0 |
| Quadrant | Total seconds | Saturated seconds | Saturation percentage |
|---|---|---|---|
| A | 6503 | 76 | 1.168691% |
| B | 6503 | 84 | 1.291712% |
| C | 6502 | 134 | 2.060904% |
| D | 6502 | 126 | 1.937865% |
Noise dominated data is calculated using 1-second bins in cleaned event files. If a bin has >2000 counts, and if more than 50% of those come from <1% of pixels, then it is considered to be noise-dominated and hence unusable.
| Quadrant | # 1 sec bins | Bins with >0 counts | Bins with >2000 counts | High rate bins dominated by noise | Noise dominated (total time) | Noise dominated (detector-on time) | Marked lightcurve |
|---|---|---|---|---|---|---|---|
| A | 7568 | 6503 | 1 | 1 | 0.01% | 0.02% | 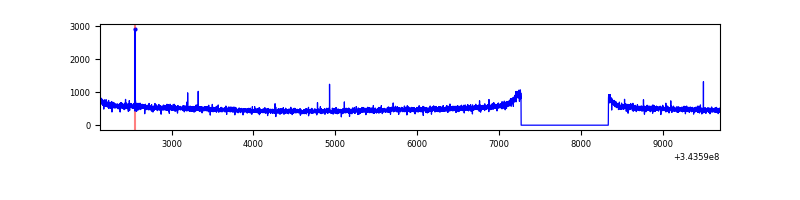 |
| B | 7568 | 6503 | 0 | 0 | 0.00% | 0.00% | 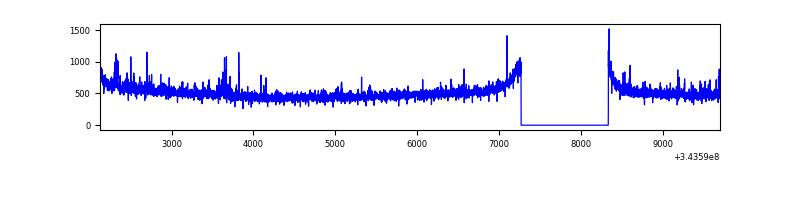 |
| C | 7567 | 6502 | 0 | 0 | 0.00% | 0.00% | 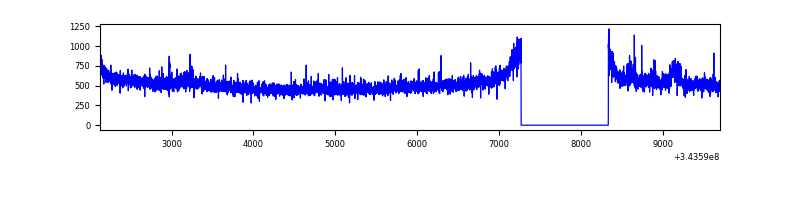 |
| D | 7567 | 6502 | 57 | 57 | 0.75% | 0.88% | 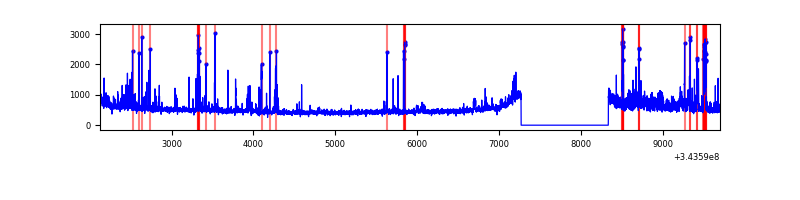 |
Top three noisy pixels from each quadrant. If the there are fewer than three noisy pixels in the level2.evt file, extra rows are filled as -1
| Pixel properties | Quadrant properties | ||||||
|---|---|---|---|---|---|---|---|
| Quadrant | DetID | PixID | Counts | Sigma | Mean | Median | Sigma |
| A | 13 | 254 | 12256 | 67.99 | 841 | 823 | 168.1 |
| A | 3 | 137 | 7460 | 39.47 | 841 | 823 | 168.1 |
| A | 6 | 16 | 7366 | 38.91 | 841 | 823 | 168.1 |
| B | 0 | 229 | 38734 | 242.08 | 827 | 806 | 156.7 |
| B | 0 | 190 | 28266 | 175.27 | 827 | 806 | 156.7 |
| B | 12 | 111 | 18713 | 114.3 | 827 | 806 | 156.7 |
| C | 3 | 233 | 136048 | 714.93 | 808 | 811 | 189.2 |
| C | 14 | 238 | 129083 | 678.11 | 808 | 811 | 189.2 |
| C | 13 | 61 | 5339 | 23.94 | 808 | 811 | 189.2 |
| D | 1 | 52 | 588365 | 3042.56 | 819 | 801 | 193.1 |
| D | 2 | 250 | 87085 | 446.8 | 819 | 801 | 193.1 |
| D | 2 | 234 | 28521 | 143.54 | 819 | 801 | 193.1 |
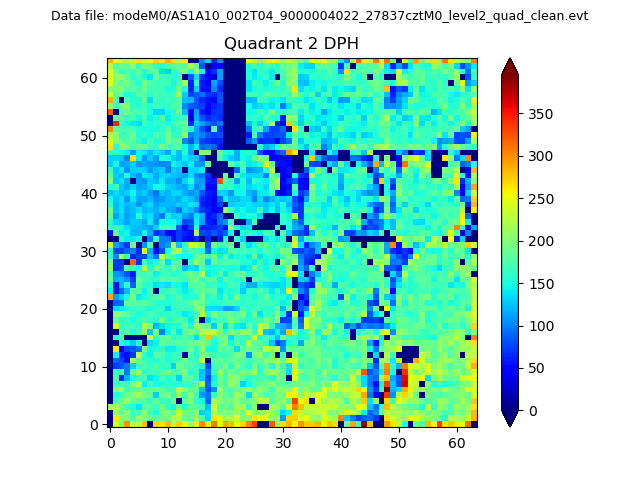
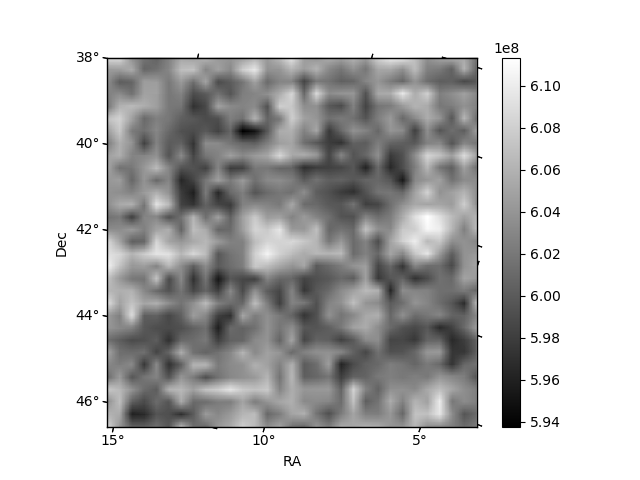
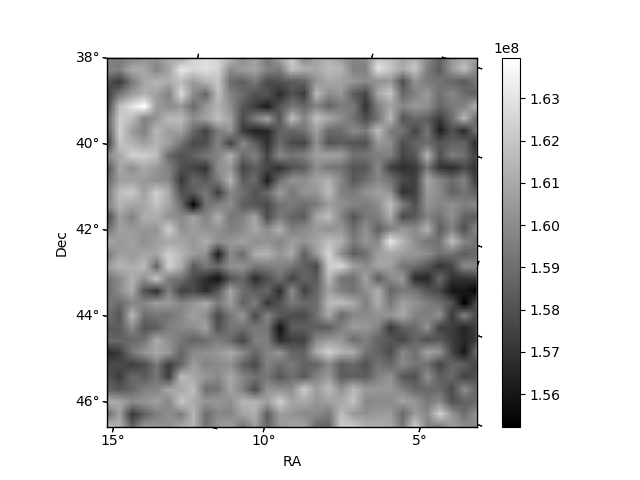
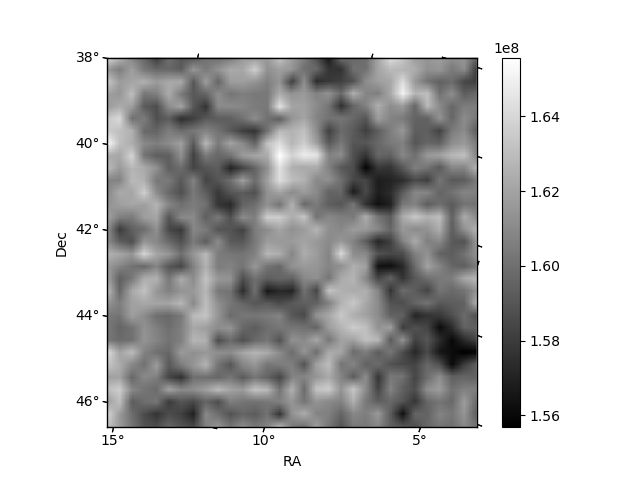
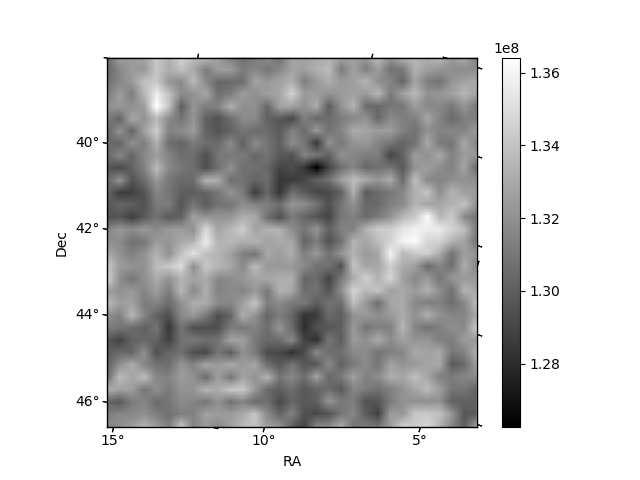
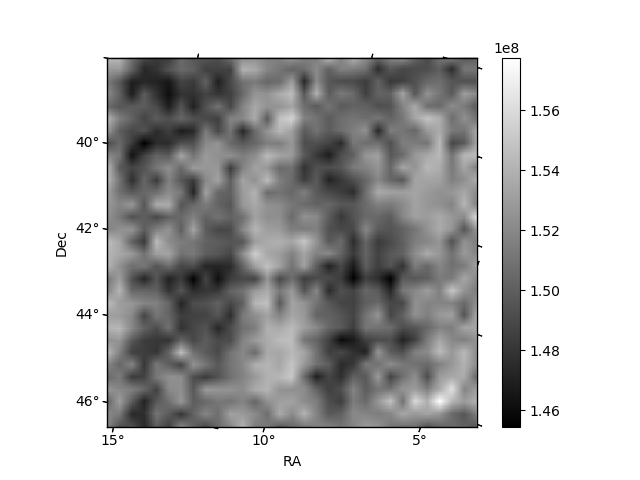
Histogram calculated using DETX and DETY for each event in the final _common_clean file
| Quadrant A | 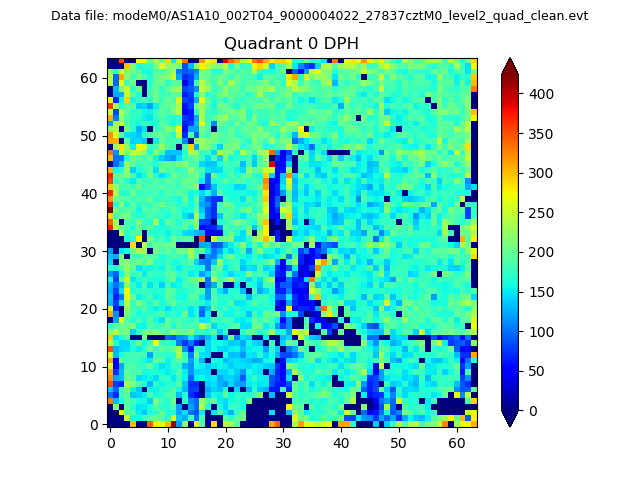 |
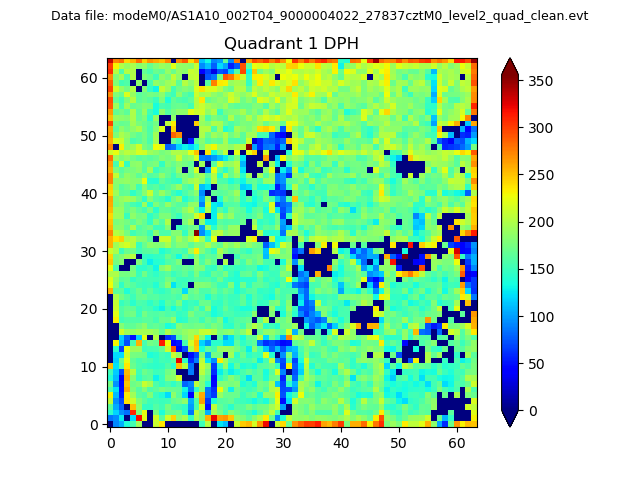 |
Quadrant B |
|---|---|---|---|
| Quadrant D | 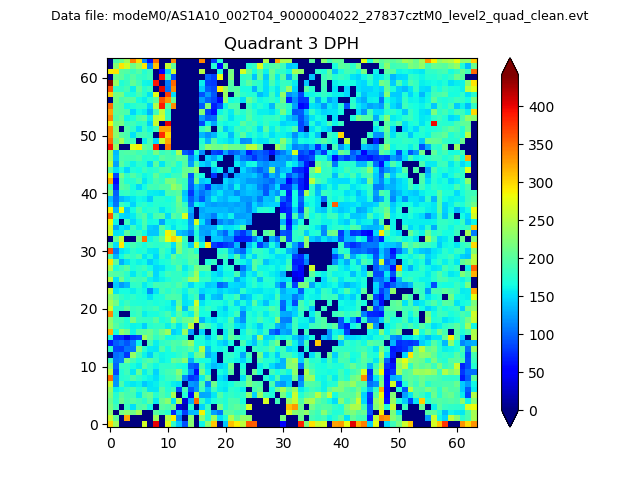 |
 |
Quadrant C |
| Plot type | Count rate plots | Images |
|---|---|---|
| Comparison with Poisson distribution Blue bars denote a histogram of data divided into 1 sec bins. Red curve is a Poisson curve with rate = median count rate of data. |
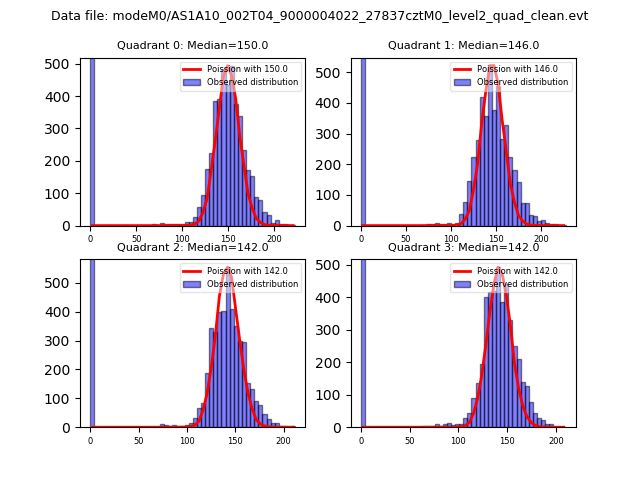 |
 |
| Quadrant-wise count rates Data is divided into 100 sec bins |
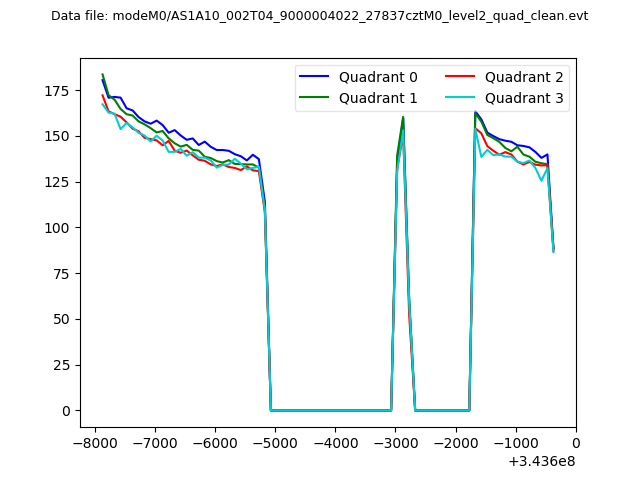 |
|
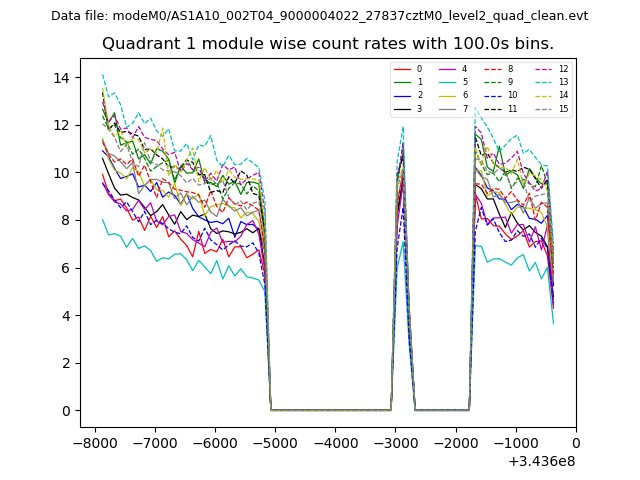
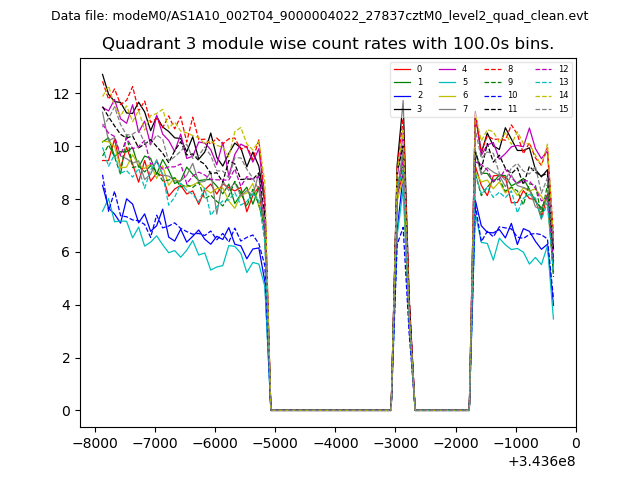
| Module-wise count rates for Quadrant A Data is divided into 100 sec bins |
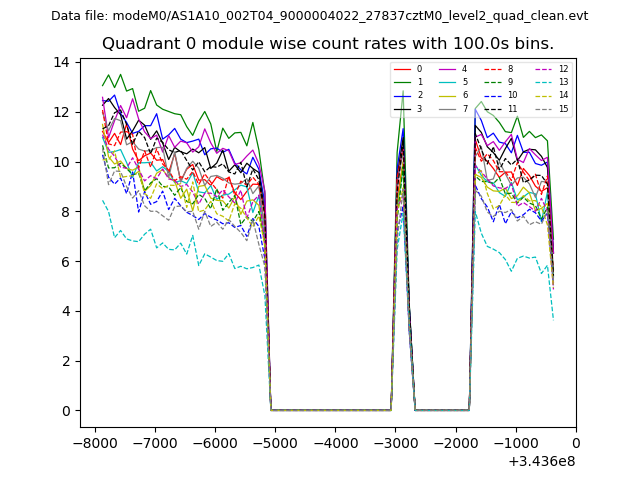 |
 |
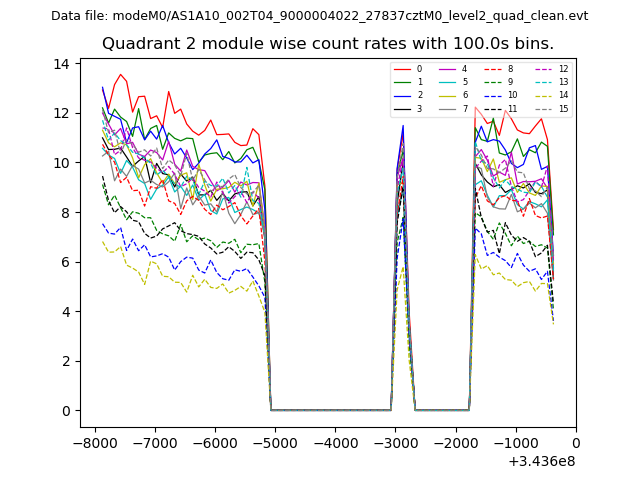
| Module-wise count rates for Quadrant B Data is divided into 100 sec bins |
 |
 |
| Module-wise count rates for Quadrant C Data is divided into 100 sec bins |
 |
 |
| Module-wise count rates for Quadrant D Data is divided into 100 sec bins |
 |
 |
| Parameter | Plot |
|---|---|
| CZT HV Monitor | 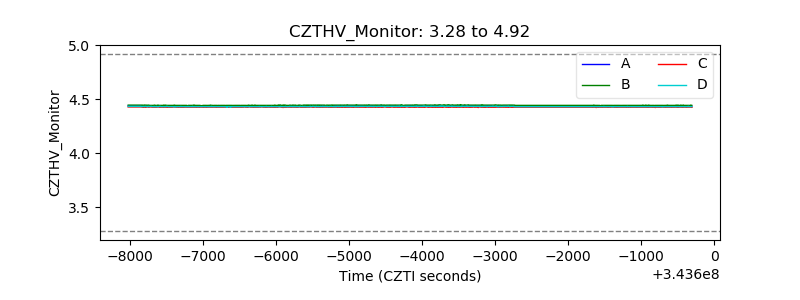 |
| D_VDD | 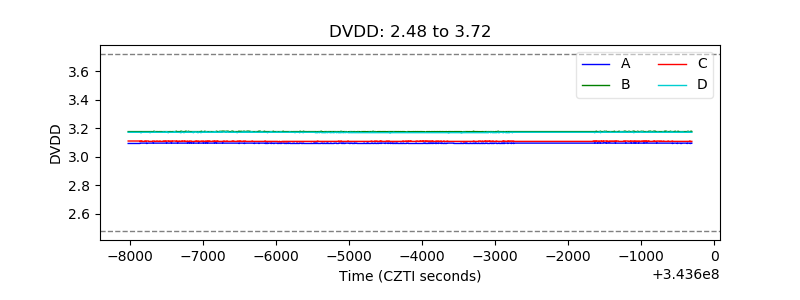 |
| Temperature 1 | 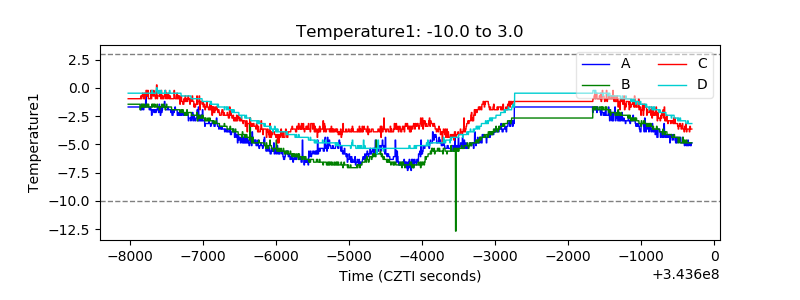 |
| Veto HV Monitor | 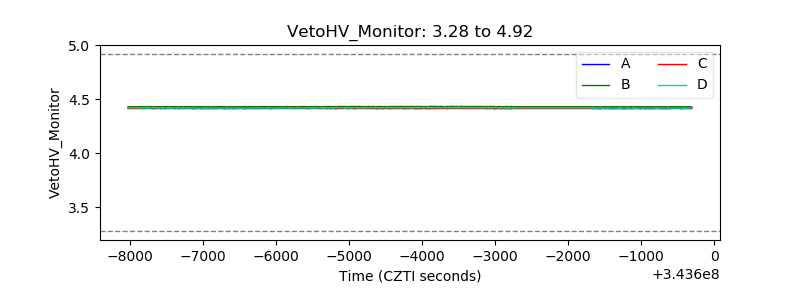 |
| Veto LLD | 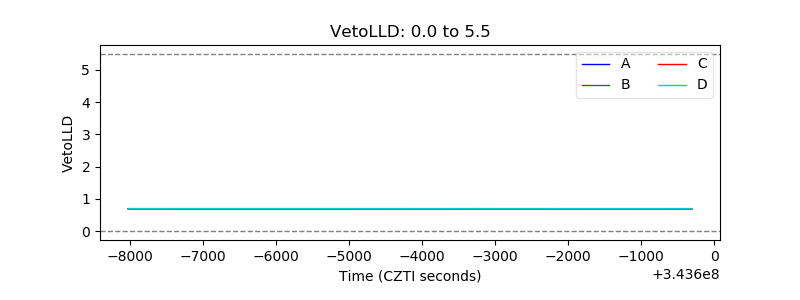 |
| Alpha Counter | 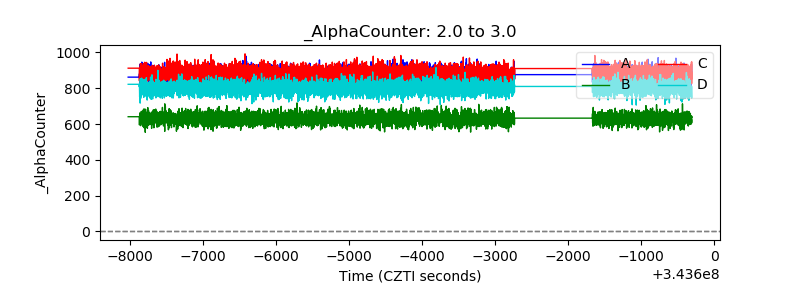 |
| _CPM_Rate | 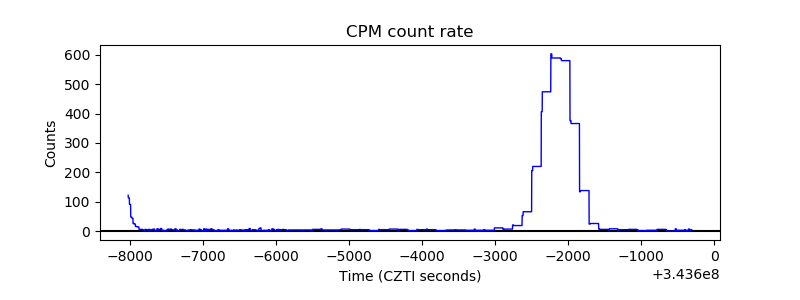 |
| CZT Counter | 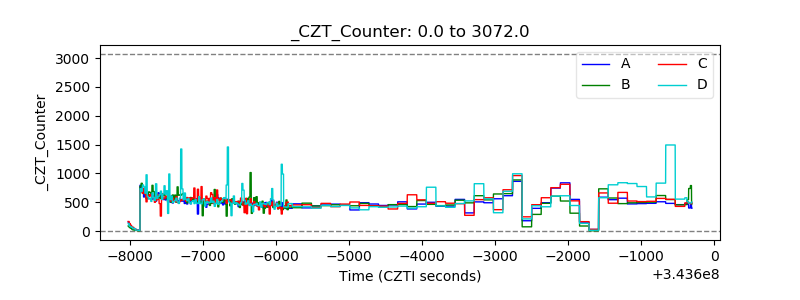 |
| +2.5 Volts monitor |  |
| +5 Volts monitor |  |
| _ROLL_ROT | 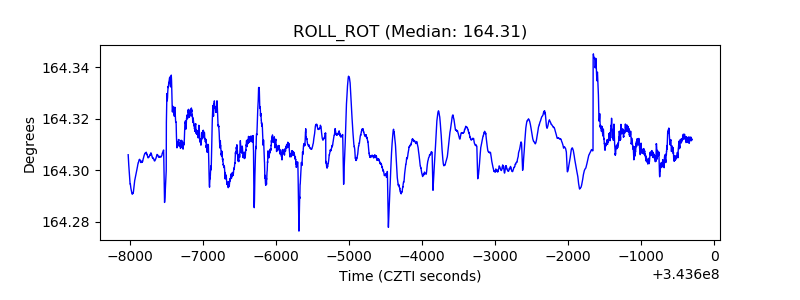 |
| _Roll_DEC | 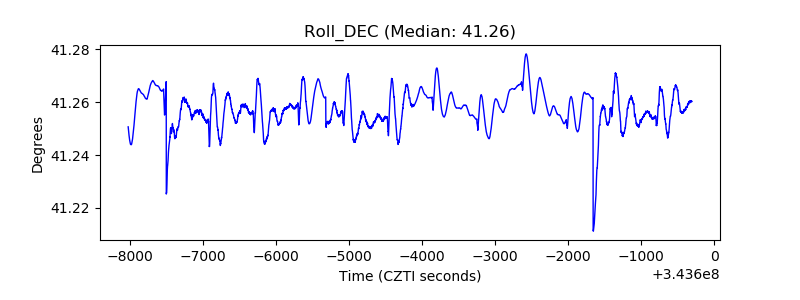 |
| _Roll_RA | 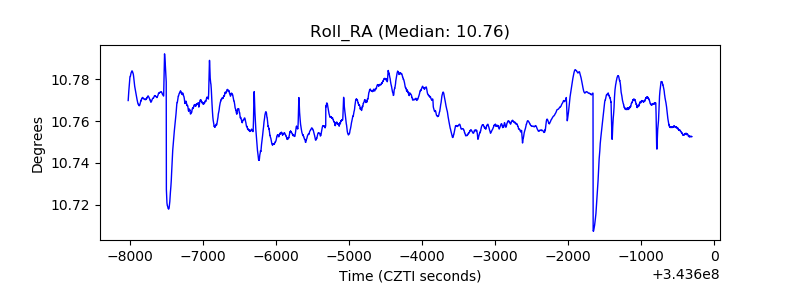 |
| Veto Counter | 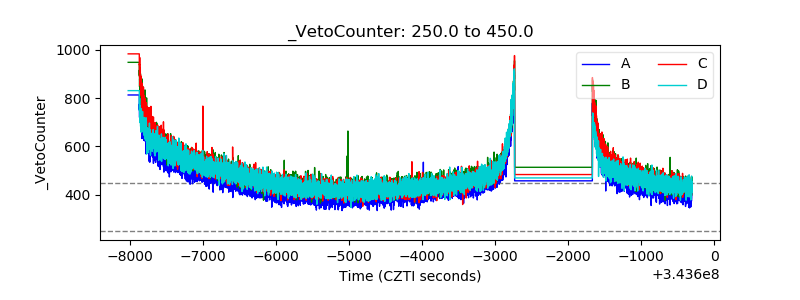 |