| Param | Original file | Final file |
|---|---|---|
| Filename | modeM0/AS1A10_002T04_9000004022_27838cztM0_level2.evt | modeM0/AS1A10_002T04_9000004022_27838cztM0_level2_quad_clean.evt |
| Size (bytes) | 547,387,200 | 101,652,480 |
| Size | 522.0 MB | 96.9 MB |
| Events in quadrant A | 3,333,040 | 675,895 |
| Events in quadrant B | 3,935,818 | 649,279 |
| Events in quadrant C | 3,779,085 | 640,303 |
| Events in quadrant D | 5,058,837 | 629,227 |
| Mode M9 | |||
|---|---|---|---|
| Quadrant | BADHDUFLAG | Total packets | Discarded packets |
| A | 0 | 15 | 0 |
| B | 0 | 16 | 0 |
| C | 0 | 16 | 0 |
| D | 0 | 16 | 0 |
| Mode M0 | |||
|---|---|---|---|
| Quadrant | BADHDUFLAG | Total packets | Discarded packets |
| A | 0 | 14365 | 0 |
| B | 0 | 16214 | 0 |
| C | 0 | 15652 | 0 |
| D | 0 | 19761 | 0 |
| Quadrant | Total seconds | Saturated seconds | Saturation percentage |
|---|---|---|---|
| A | 6941 | 26 | 0.374586% |
| B | 6941 | 259 | 3.731451% |
| C | 6940 | 130 | 1.873199% |
| D | 6940 | 289 | 4.164265% |
Noise dominated data is calculated using 1-second bins in cleaned event files. If a bin has >2000 counts, and if more than 50% of those come from <1% of pixels, then it is considered to be noise-dominated and hence unusable.
| Quadrant | # 1 sec bins | Bins with >0 counts | Bins with >2000 counts | High rate bins dominated by noise | Noise dominated (total time) | Noise dominated (detector-on time) | Marked lightcurve |
|---|---|---|---|---|---|---|---|
| A | 7706 | 6941 | 0 | 0 | 0.00% | 0.00% | 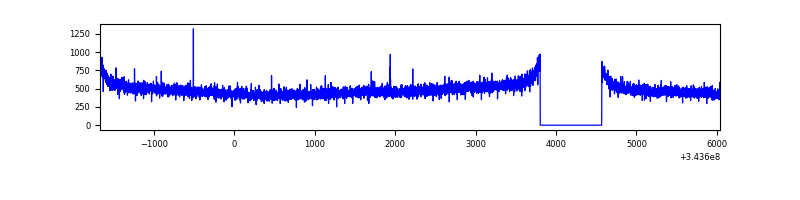 |
| B | 7706 | 6941 | 124 | 124 | 1.61% | 1.79% |  |
| C | 7705 | 6940 | 5 | 5 | 0.06% | 0.07% | 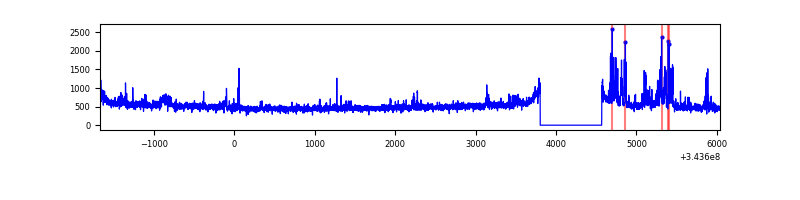 |
| D | 7705 | 6940 | 221 | 221 | 2.87% | 3.18% | 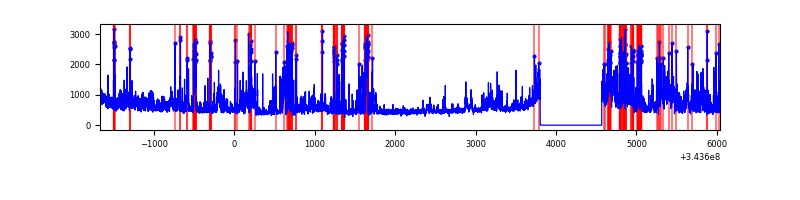 |
Top three noisy pixels from each quadrant. If the there are fewer than three noisy pixels in the level2.evt file, extra rows are filled as -1
| Pixel properties | Quadrant properties | ||||||
|---|---|---|---|---|---|---|---|
| Quadrant | DetID | PixID | Counts | Sigma | Mean | Median | Sigma |
| A | 13 | 254 | 13678 | 73.92 | 860 | 840 | 173.7 |
| A | 6 | 16 | 9961 | 52.52 | 860 | 840 | 173.7 |
| A | 3 | 137 | 7955 | 40.97 | 860 | 840 | 173.7 |
| B | 10 | 245 | 531102 | 3346.22 | 836 | 818 | 158.5 |
| B | 0 | 190 | 57374 | 356.88 | 836 | 818 | 158.5 |
| B | 0 | 229 | 40383 | 249.67 | 836 | 818 | 158.5 |
| C | 3 | 233 | 429008 | 2214.56 | 825 | 828 | 193.3 |
| C | 14 | 238 | 132229 | 679.61 | 825 | 828 | 193.3 |
| C | 13 | 61 | 5645 | 24.91 | 825 | 828 | 193.3 |
| D | 1 | 52 | 1602282 | 8092.54 | 829 | 808 | 197.9 |
| D | 2 | 250 | 203891 | 1026.22 | 829 | 808 | 197.9 |
| D | 13 | 104 | 43253 | 214.48 | 829 | 808 | 197.9 |
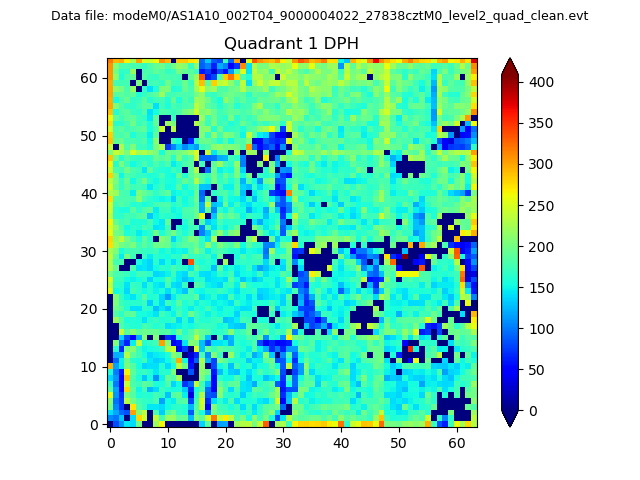
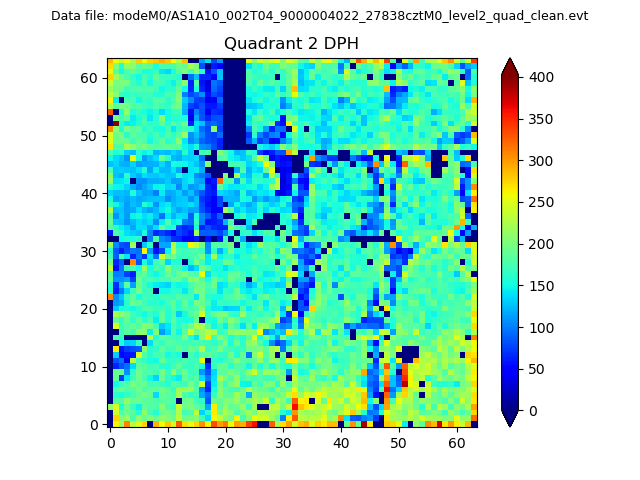
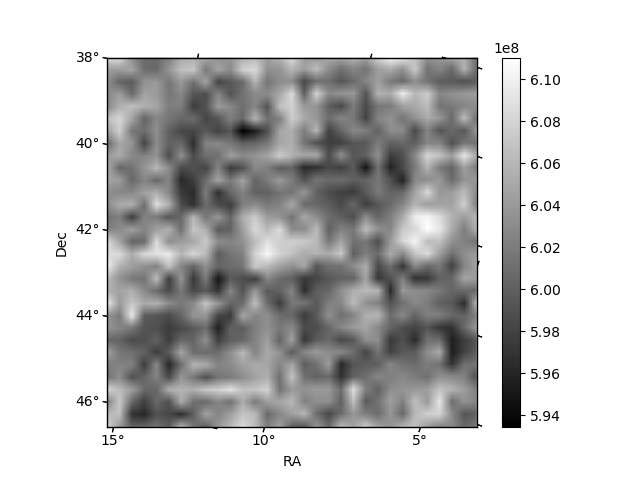
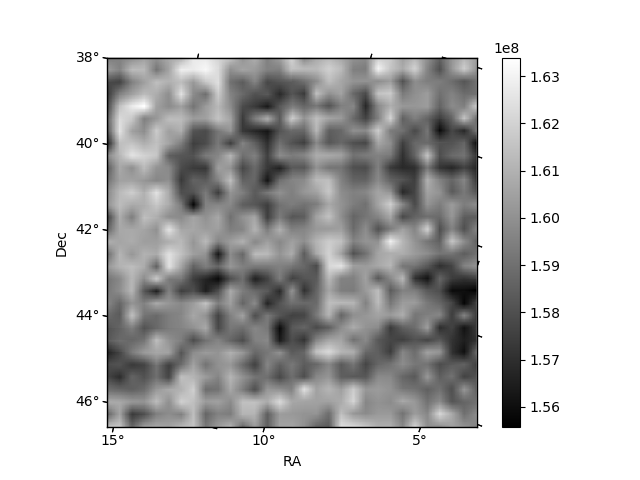
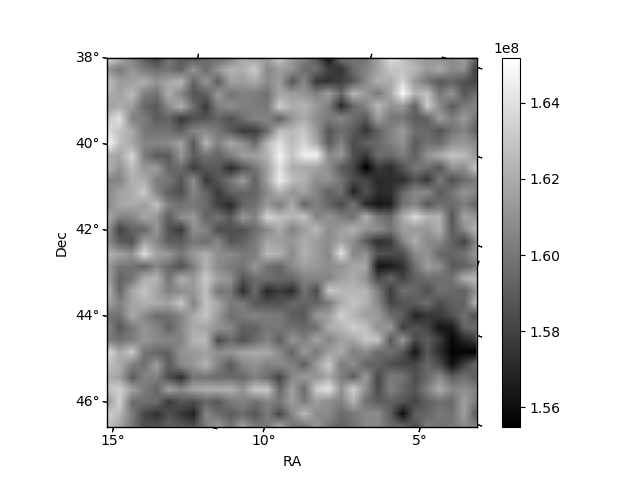
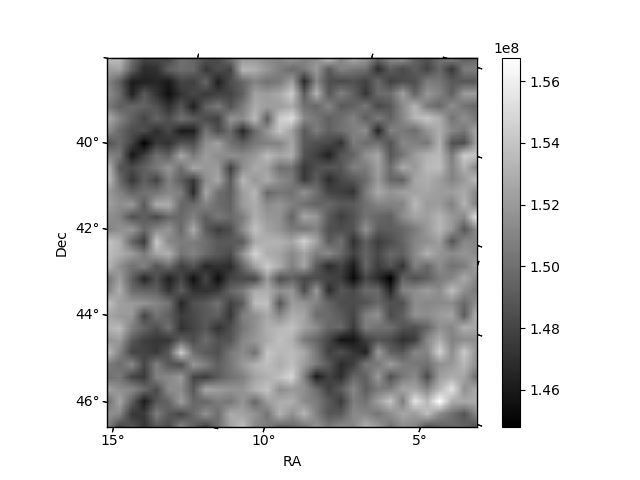
Histogram calculated using DETX and DETY for each event in the final _common_clean file
| Quadrant A | 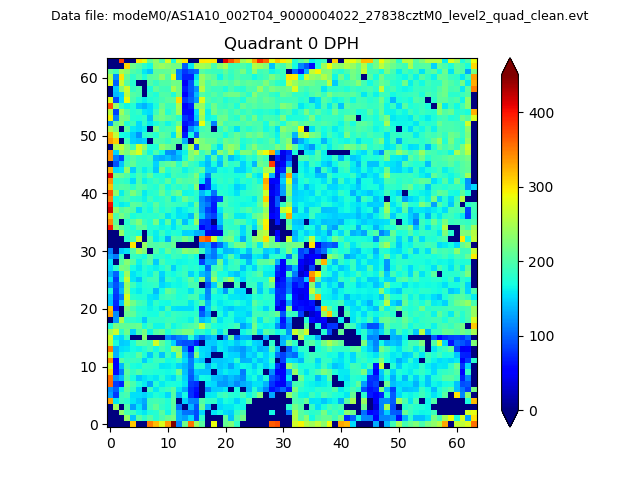 |
 |
Quadrant B |
|---|---|---|---|
| Quadrant D | 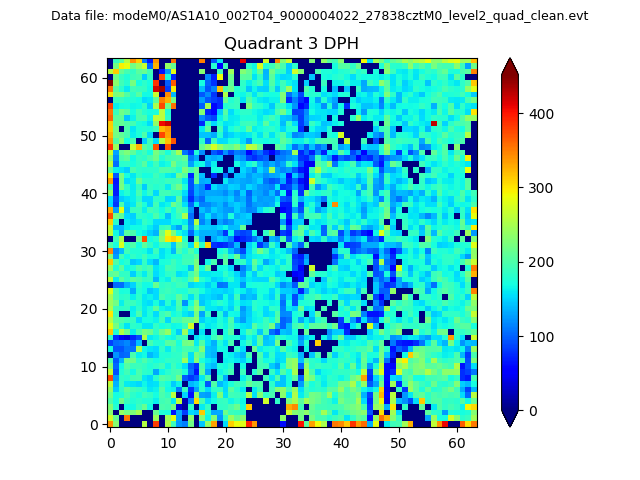 |
 |
Quadrant C |
| Plot type | Count rate plots | Images |
|---|---|---|
| Comparison with Poisson distribution Blue bars denote a histogram of data divided into 1 sec bins. Red curve is a Poisson curve with rate = median count rate of data. |
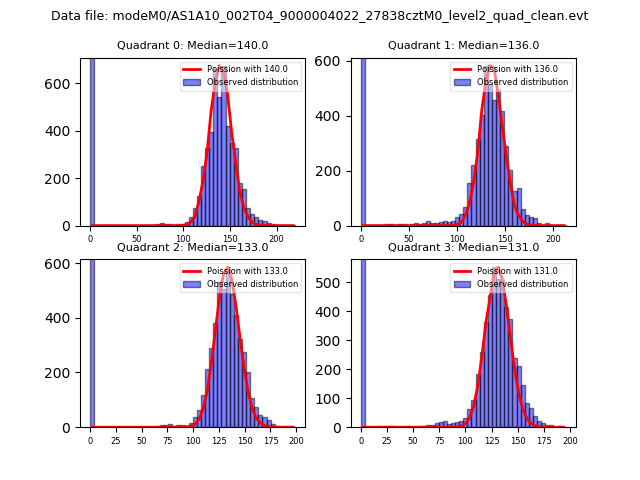 |
 |
| Quadrant-wise count rates Data is divided into 100 sec bins |
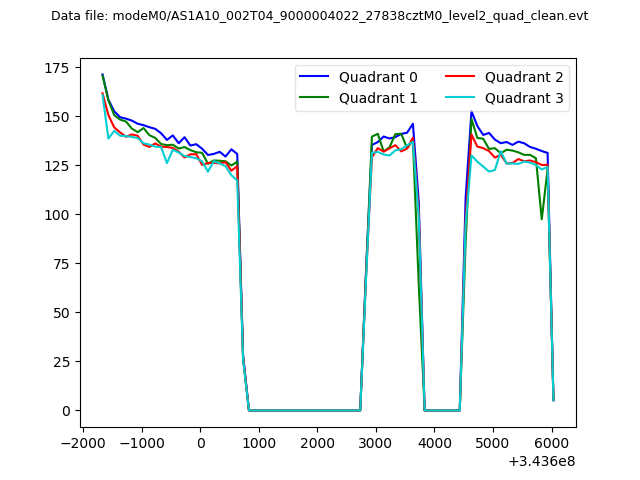 |
|
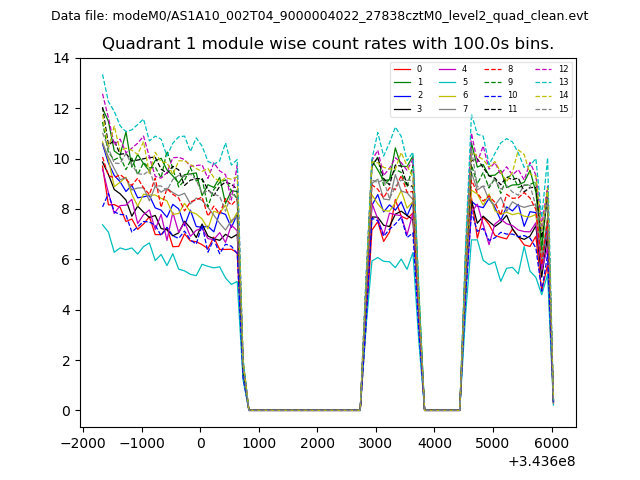
| Module-wise count rates for Quadrant A Data is divided into 100 sec bins |
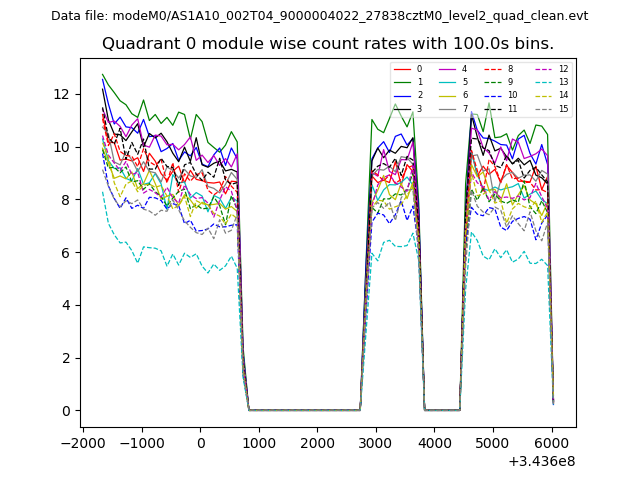 |
 |
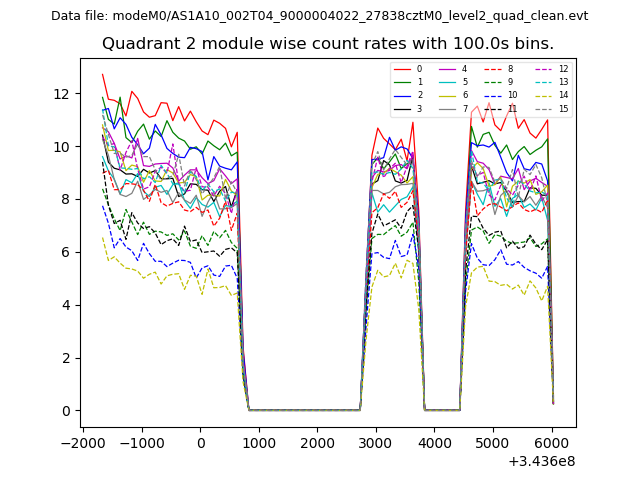
| Module-wise count rates for Quadrant B Data is divided into 100 sec bins |
 |
 |
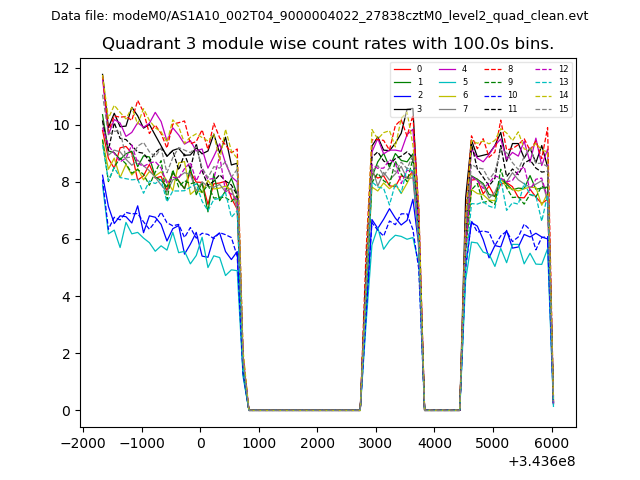
| Module-wise count rates for Quadrant C Data is divided into 100 sec bins |
 |
 |
| Module-wise count rates for Quadrant D Data is divided into 100 sec bins |
 |
 |
| Parameter | Plot |
|---|---|
| CZT HV Monitor | 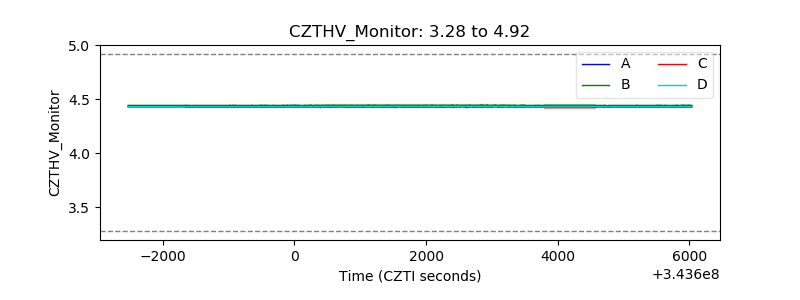 |
| D_VDD | 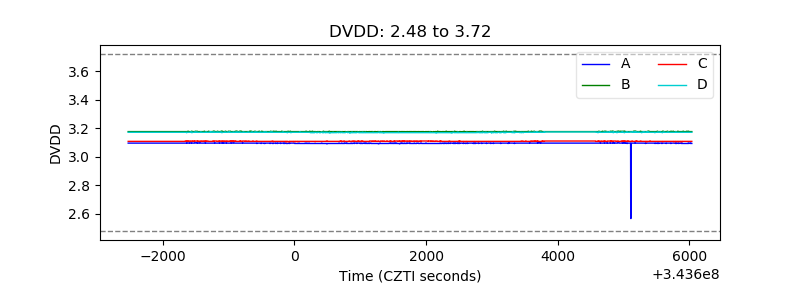 |
| Temperature 1 | 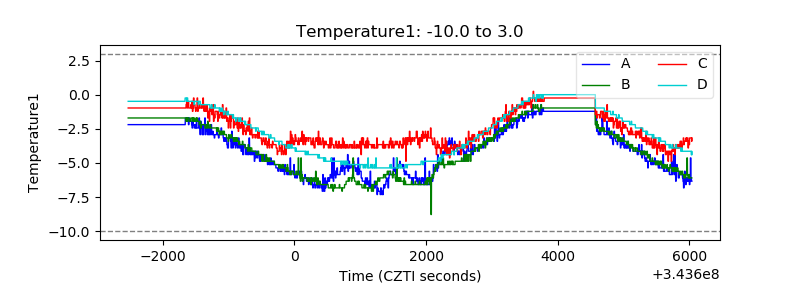 |
| Veto HV Monitor | 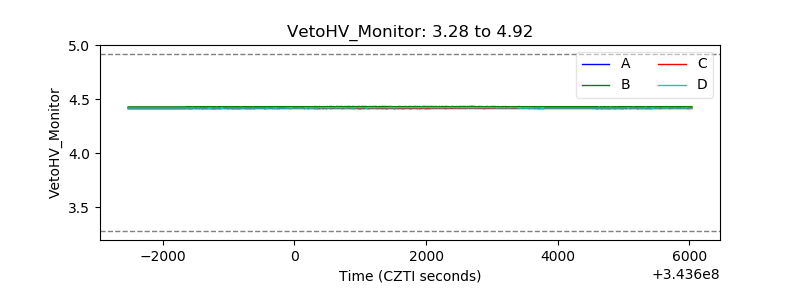 |
| Veto LLD | 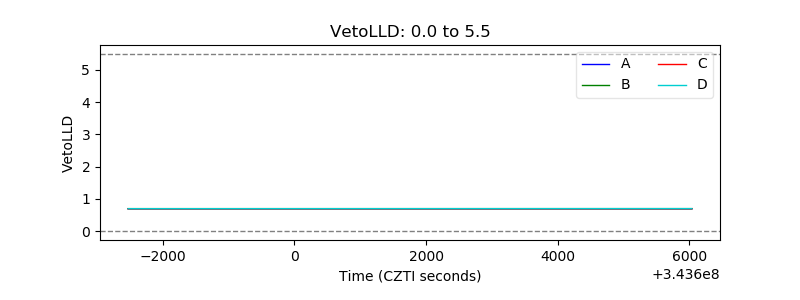 |
| Alpha Counter | 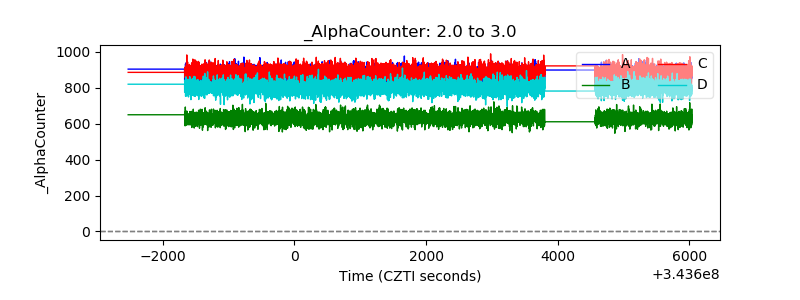 |
| _CPM_Rate | 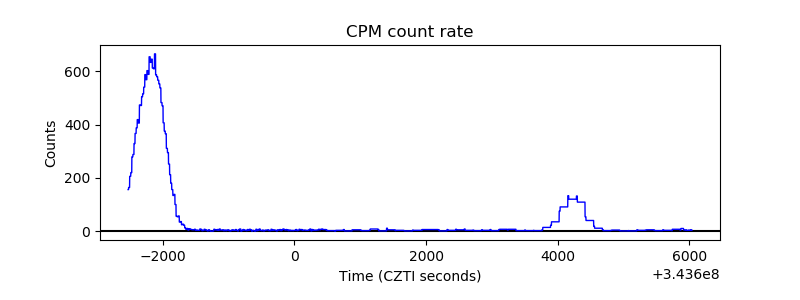 |
| CZT Counter | 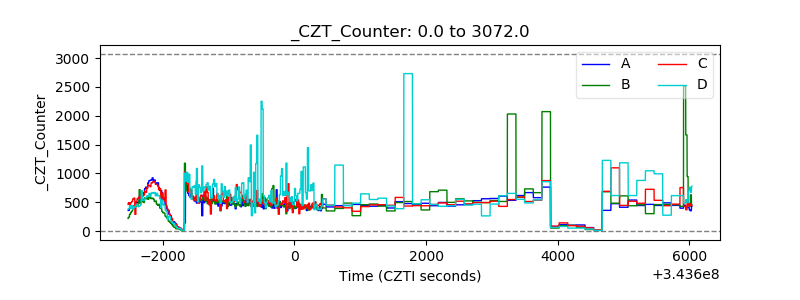 |
| +2.5 Volts monitor |  |
| +5 Volts monitor | 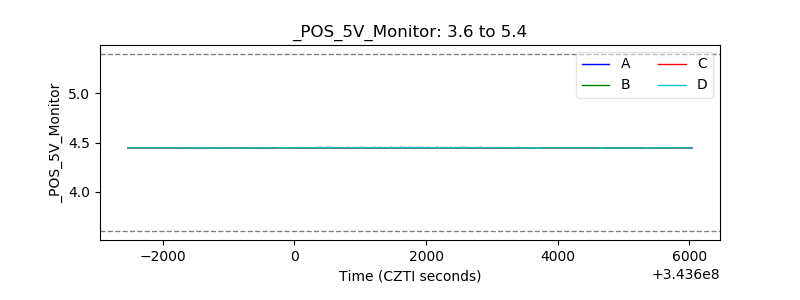 |
| _ROLL_ROT | 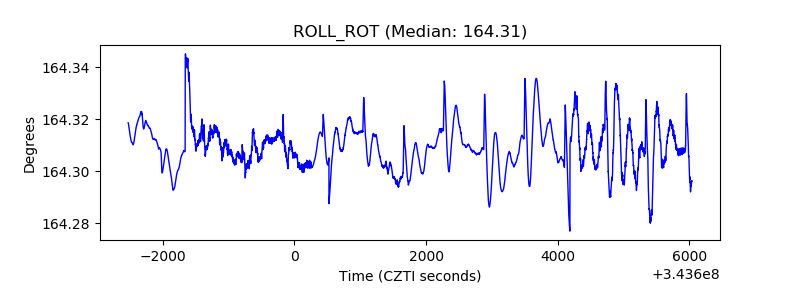 |
| _Roll_DEC | 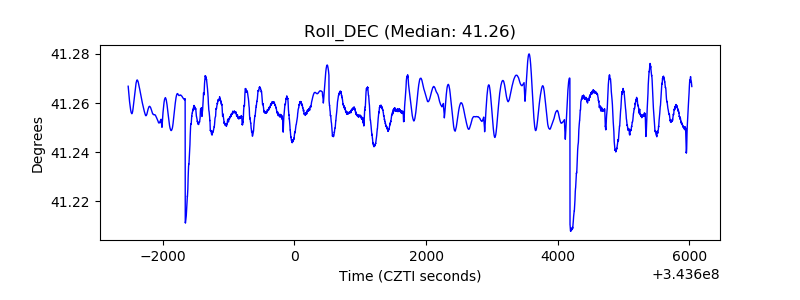 |
| _Roll_RA | 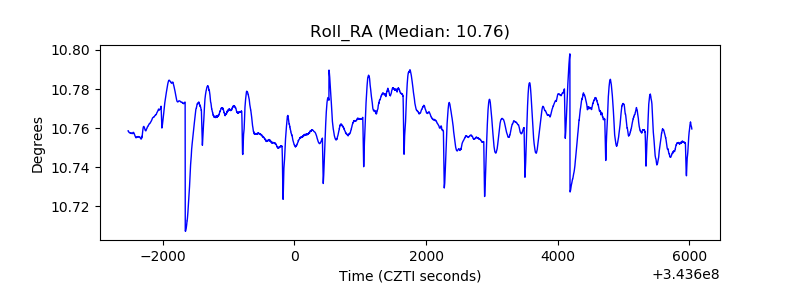 |
| Veto Counter | 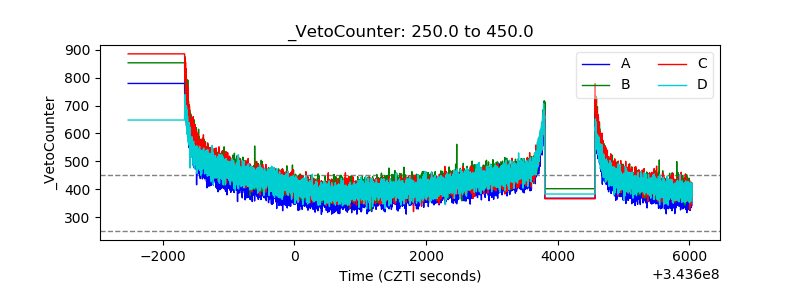 |