| Param | Original file | Final file |
|---|---|---|
| Filename | modeM0/AS1A10_002T04_9000004022_27839cztM0_level2.evt | modeM0/AS1A10_002T04_9000004022_27839cztM0_level2_quad_clean.evt |
| Size (bytes) | 632,471,040 | 110,983,680 |
| Size | 603.2 MB | 105.8 MB |
| Events in quadrant A | 3,617,457 | 741,660 |
| Events in quadrant B | 4,318,267 | 710,063 |
| Events in quadrant C | 4,217,336 | 700,381 |
| Events in quadrant D | 6,488,219 | 681,794 |
| Mode M9 | |||
|---|---|---|---|
| Quadrant | BADHDUFLAG | Total packets | Discarded packets |
| A | 0 | 10 | 0 |
| B | 0 | 10 | 0 |
| C | 0 | 10 | 0 |
| D | 0 | 10 | 0 |
| Mode M0 | |||
|---|---|---|---|
| Quadrant | BADHDUFLAG | Total packets | Discarded packets |
| A | 0 | 15768 | 0 |
| B | 0 | 17811 | 0 |
| C | 0 | 17494 | 0 |
| D | 0 | 24476 | 0 |
| Quadrant | Total seconds | Saturated seconds | Saturation percentage |
|---|---|---|---|
| A | 7563 | 59 | 0.780114% |
| B | 7564 | 332 | 4.389212% |
| C | 7564 | 229 | 3.027499% |
| D | 7564 | 695 | 9.188260% |
Noise dominated data is calculated using 1-second bins in cleaned event files. If a bin has >2000 counts, and if more than 50% of those come from <1% of pixels, then it is considered to be noise-dominated and hence unusable.
| Quadrant | # 1 sec bins | Bins with >0 counts | Bins with >2000 counts | High rate bins dominated by noise | Noise dominated (total time) | Noise dominated (detector-on time) | Marked lightcurve |
|---|---|---|---|---|---|---|---|
| A | 8668 | 7563 | 1 | 1 | 0.01% | 0.01% | 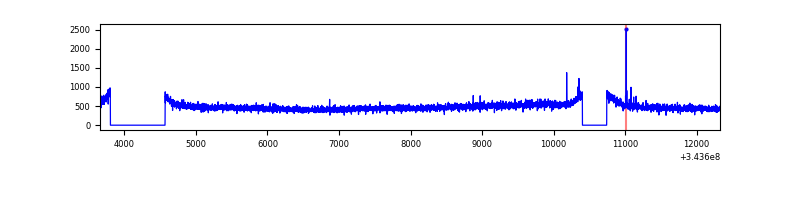 |
| B | 8669 | 7565 | 133 | 133 | 1.53% | 1.76% | 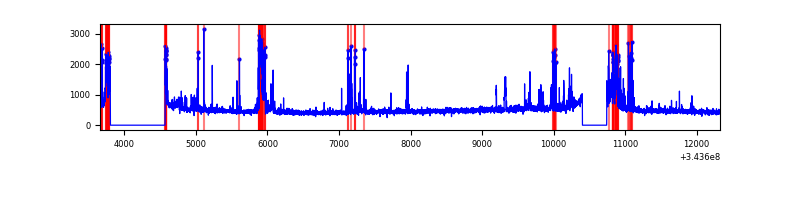 |
| C | 8669 | 7564 | 7 | 7 | 0.08% | 0.09% | 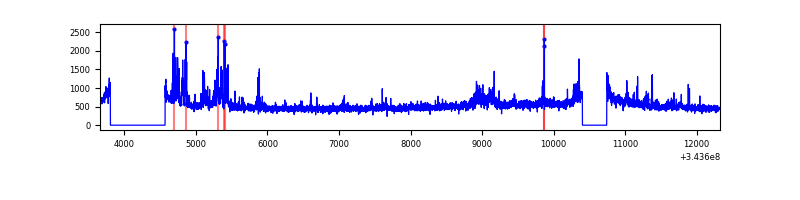 |
| D | 8669 | 7565 | 453 | 453 | 5.23% | 5.99% | 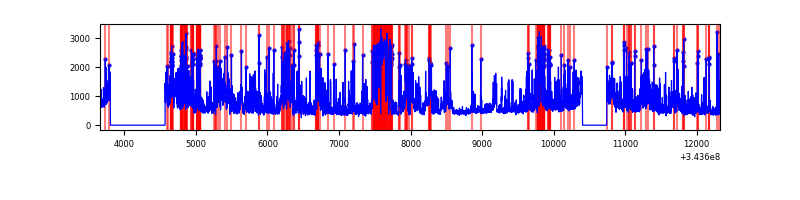 |
Top three noisy pixels from each quadrant. If the there are fewer than three noisy pixels in the level2.evt file, extra rows are filled as -1
| Pixel properties | Quadrant properties | ||||||
|---|---|---|---|---|---|---|---|
| Quadrant | DetID | PixID | Counts | Sigma | Mean | Median | Sigma |
| A | 13 | 254 | 14596 | 72.75 | 933 | 911 | 188.1 |
| A | 13 | 248 | 11491 | 56.24 | 933 | 911 | 188.1 |
| A | 3 | 137 | 9108 | 43.57 | 933 | 911 | 188.1 |
| B | 10 | 245 | 653766 | 3787.54 | 905 | 880 | 172.4 |
| B | 0 | 229 | 36994 | 209.51 | 905 | 880 | 172.4 |
| B | 0 | 190 | 35485 | 200.75 | 905 | 880 | 172.4 |
| C | 3 | 233 | 572742 | 2701.7 | 895 | 899 | 211.7 |
| C | 14 | 238 | 142918 | 670.98 | 895 | 899 | 211.7 |
| C | 13 | 61 | 6084 | 24.5 | 895 | 899 | 211.7 |
| D | 1 | 52 | 2654718 | 12650.57 | 875 | 850 | 209.8 |
| D | 2 | 250 | 317816 | 1510.93 | 875 | 850 | 209.8 |
| D | 13 | 104 | 60985 | 286.65 | 875 | 850 | 209.8 |
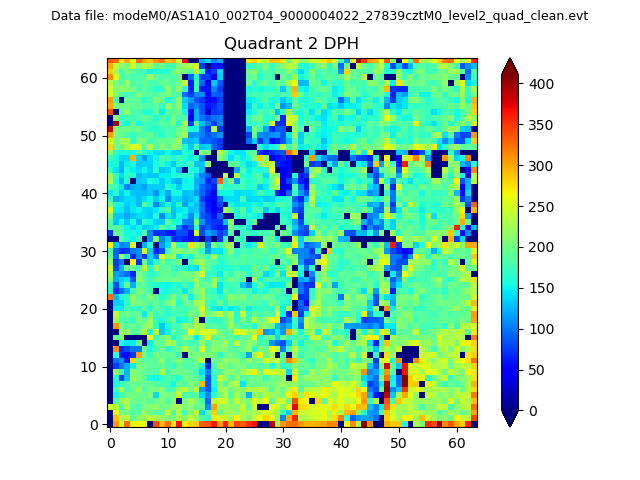
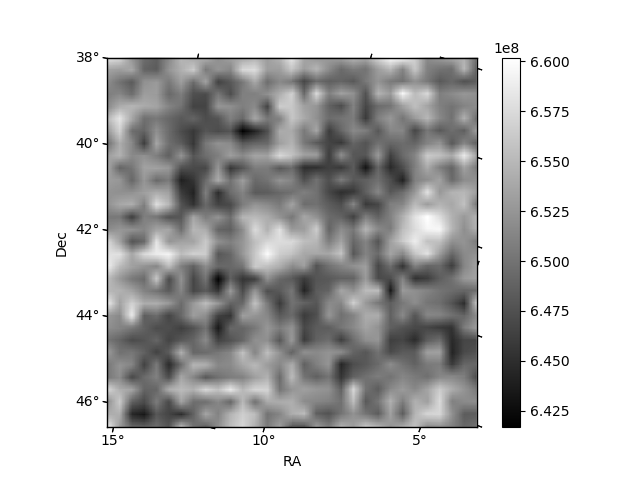
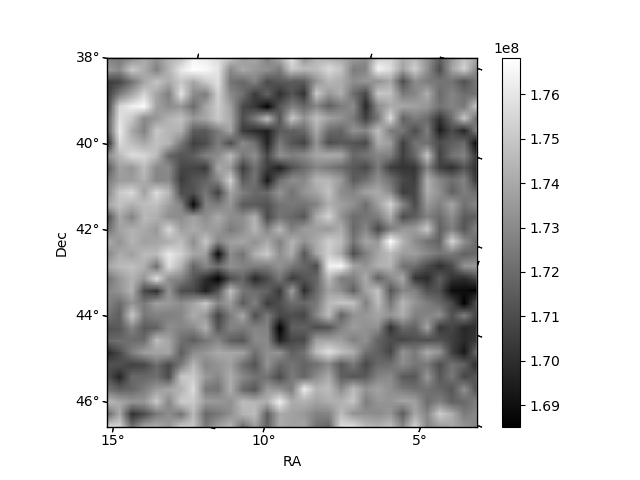
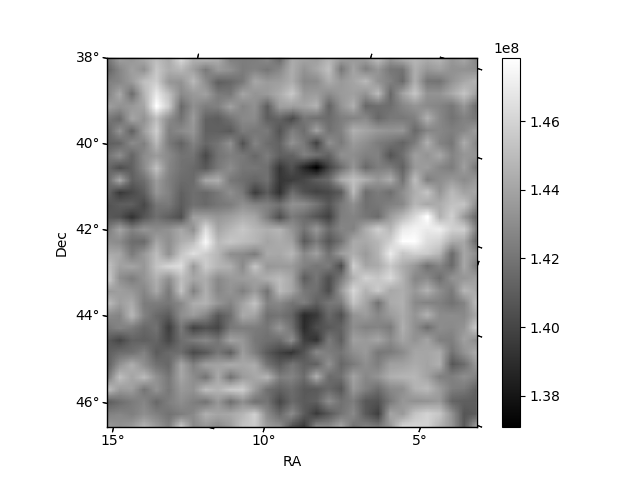
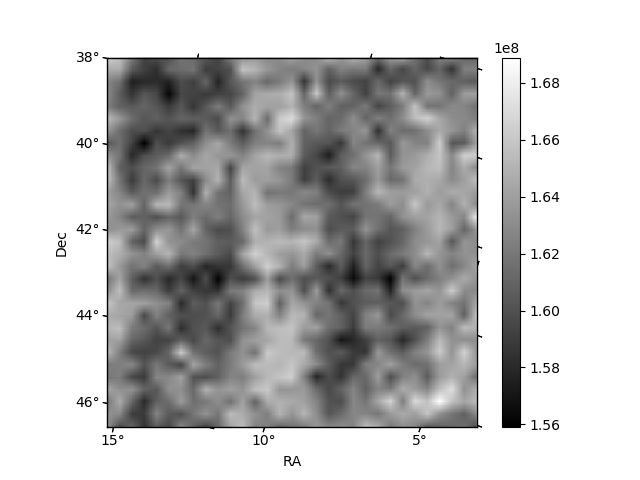
Histogram calculated using DETX and DETY for each event in the final _common_clean file
| Quadrant A | 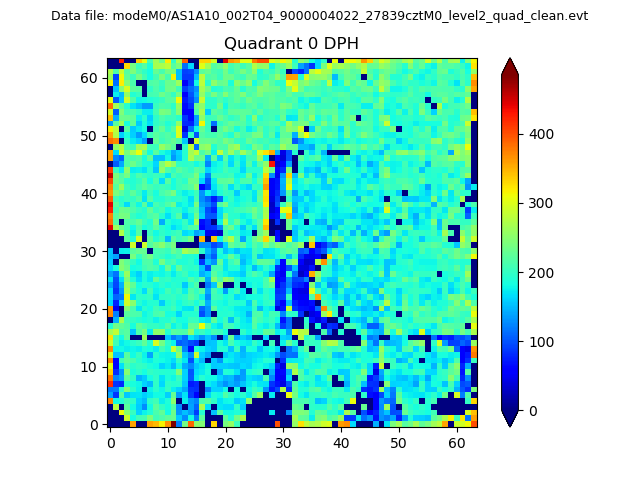 |
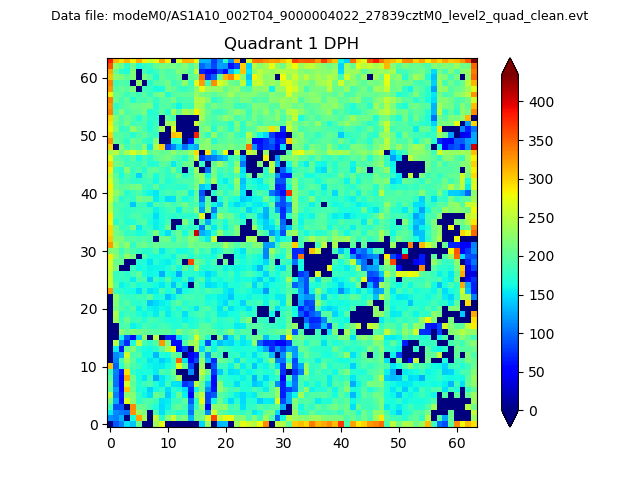 |
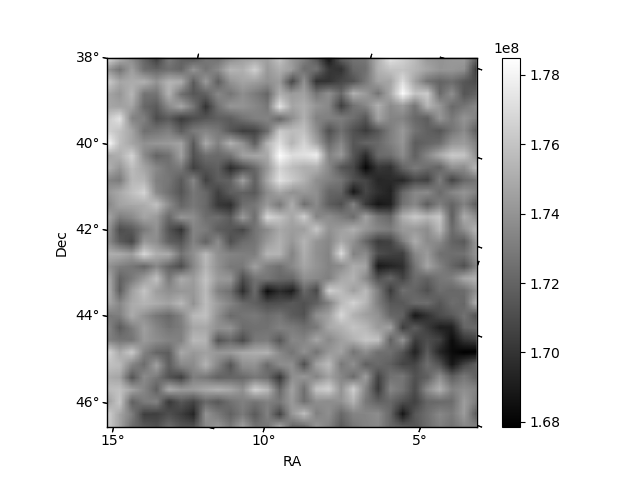
Quadrant B |
|---|---|---|---|
| Quadrant D | 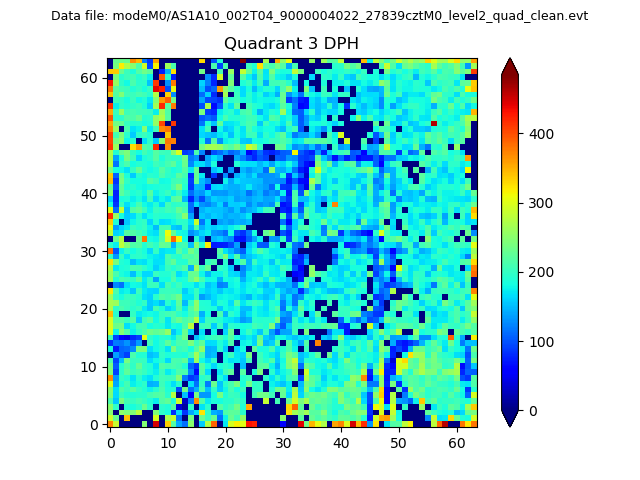 |
 |
Quadrant C |
| Plot type | Count rate plots | Images |
|---|---|---|
| Comparison with Poisson distribution Blue bars denote a histogram of data divided into 1 sec bins. Red curve is a Poisson curve with rate = median count rate of data. |
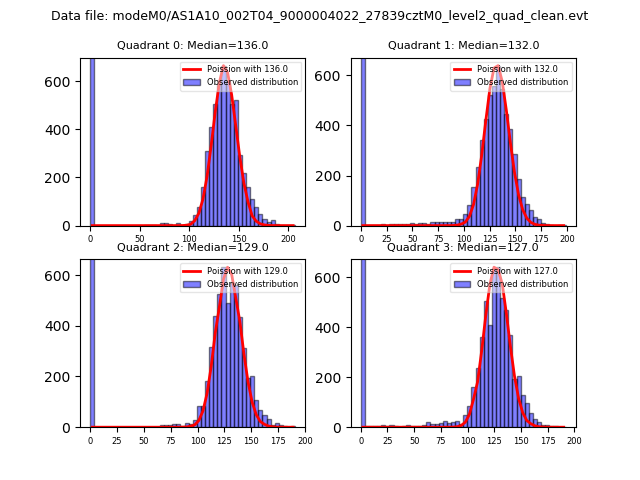 |
 |
| Quadrant-wise count rates Data is divided into 100 sec bins |
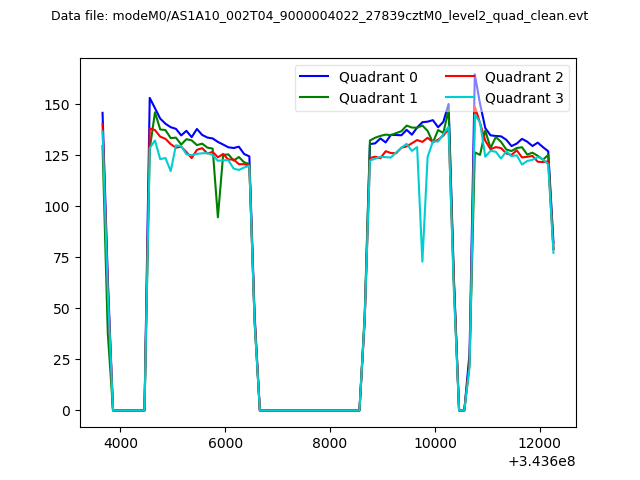 |
|
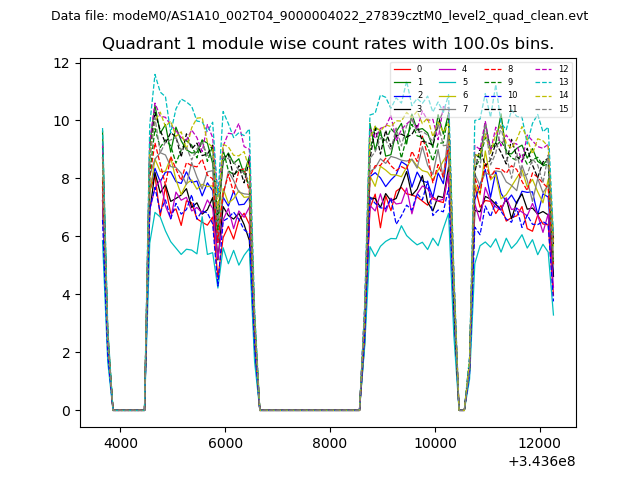
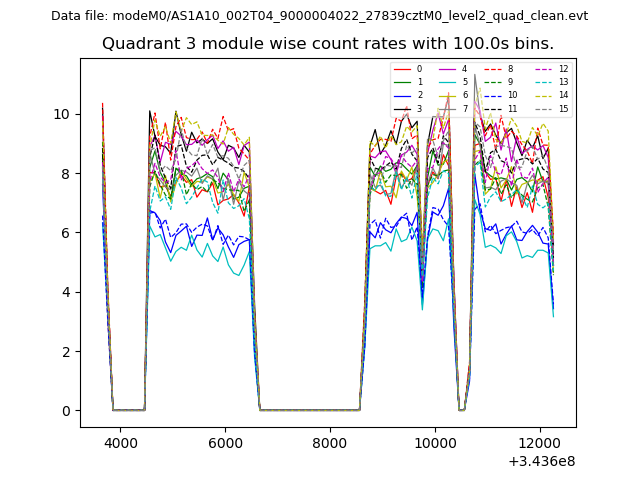
| Module-wise count rates for Quadrant A Data is divided into 100 sec bins |
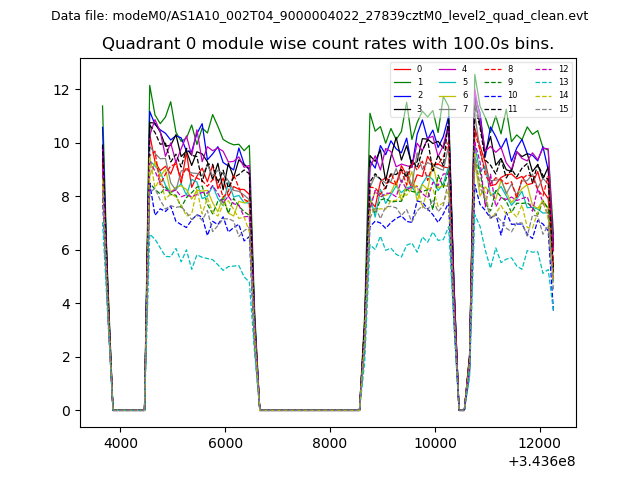 |
 |
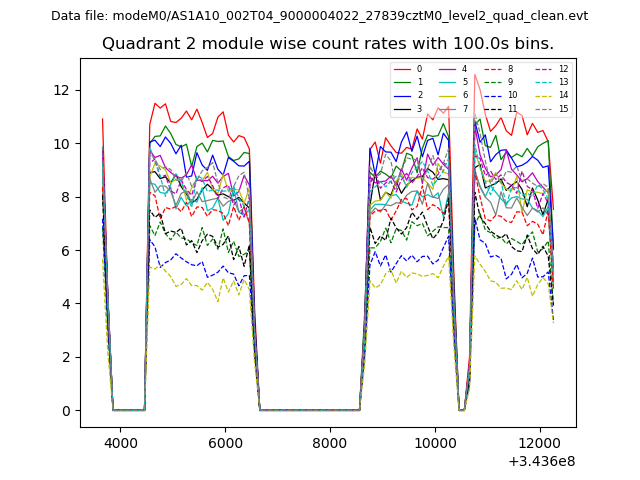
| Module-wise count rates for Quadrant B Data is divided into 100 sec bins |
 |
 |
| Module-wise count rates for Quadrant C Data is divided into 100 sec bins |
 |
 |
| Module-wise count rates for Quadrant D Data is divided into 100 sec bins |
 |
 |
| Parameter | Plot |
|---|---|
| CZT HV Monitor | 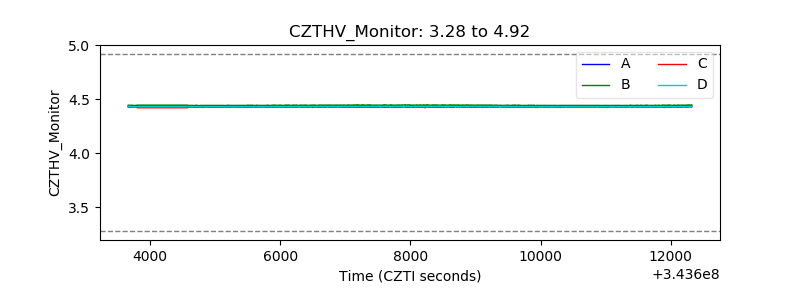 |
| D_VDD | 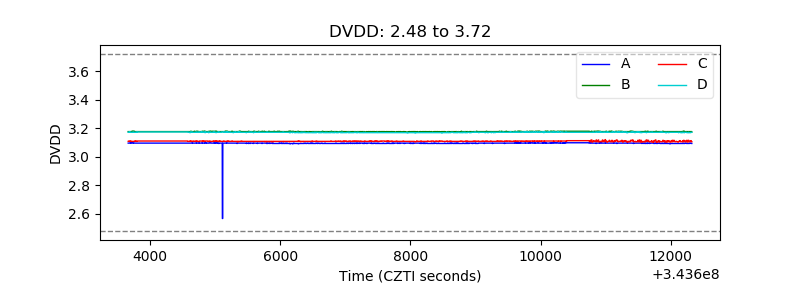 |
| Temperature 1 | 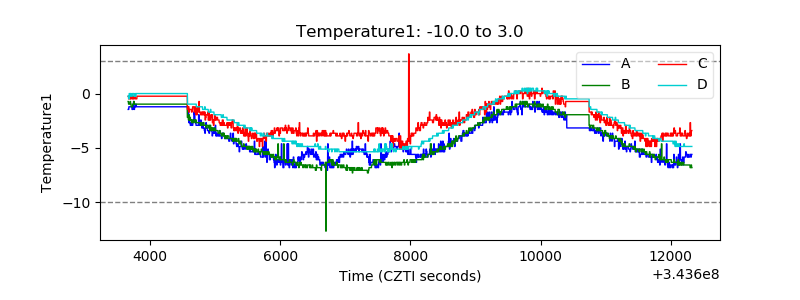 |
| Veto HV Monitor | 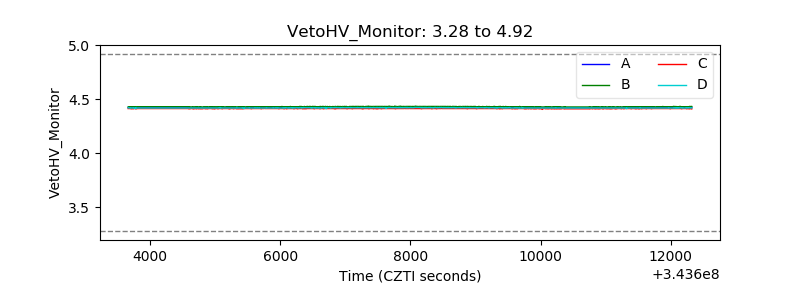 |
| Veto LLD | 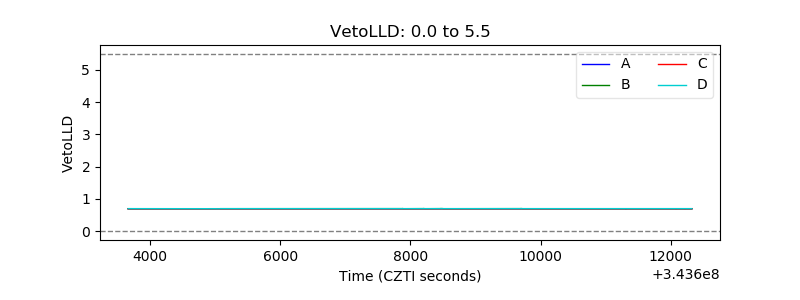 |
| Alpha Counter | 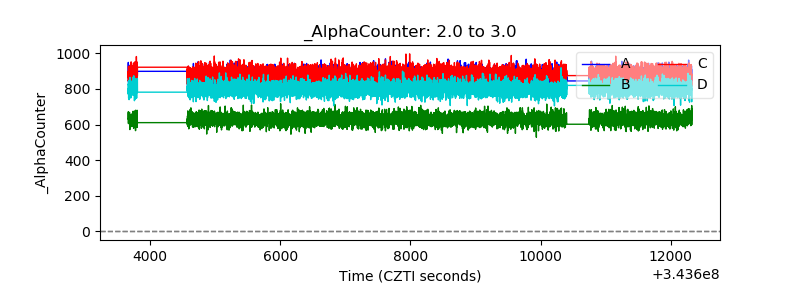 |
| _CPM_Rate | 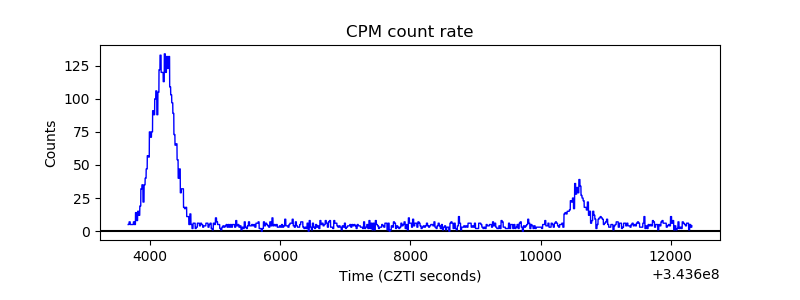 |
| CZT Counter | 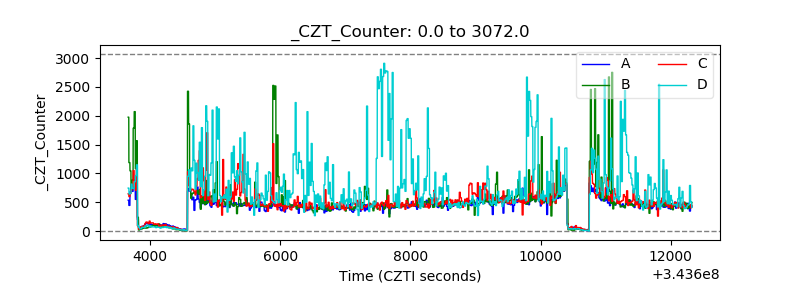 |
| +2.5 Volts monitor |  |
| +5 Volts monitor |  |
| _ROLL_ROT | 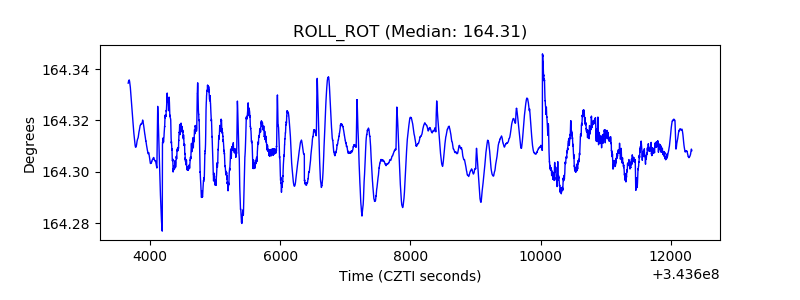 |
| _Roll_DEC | 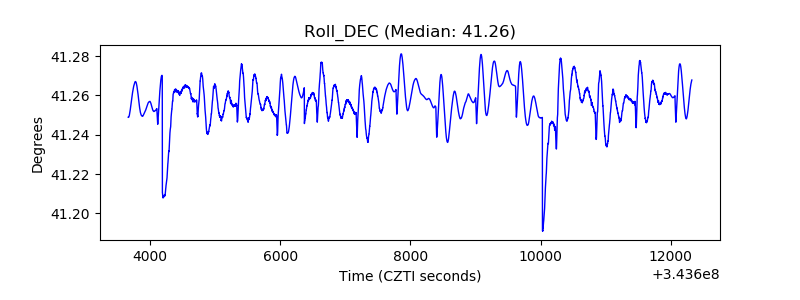 |
| _Roll_RA | 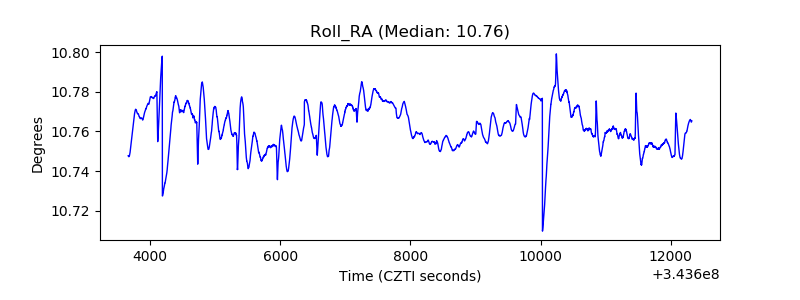 |
| Veto Counter | 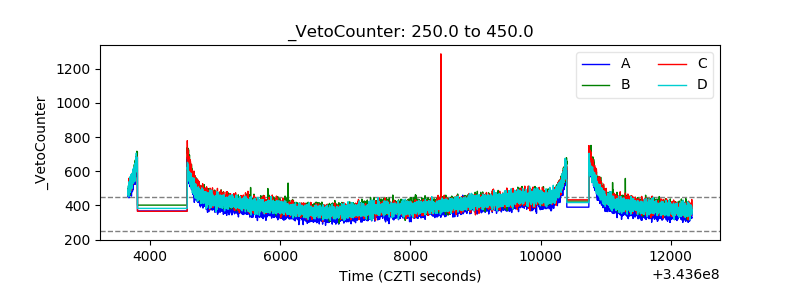 |