| Param | Original file | Final file |
|---|---|---|
| Filename | modeM0/AS1A10_002T04_9000004022_27840cztM0_level2.evt | modeM0/AS1A10_002T04_9000004022_27840cztM0_level2_quad_clean.evt |
| Size (bytes) | 650,712,960 | 120,519,360 |
| Size | 620.6 MB | 114.9 MB |
| Events in quadrant A | 4,047,528 | 797,654 |
| Events in quadrant B | 5,077,753 | 769,121 |
| Events in quadrant C | 4,396,373 | 758,809 |
| Events in quadrant D | 5,614,299 | 738,888 |
| Mode M9 | |||
|---|---|---|---|
| Quadrant | BADHDUFLAG | Total packets | Discarded packets |
| A | 0 | 6 | 0 |
| B | 0 | 6 | 0 |
| C | 0 | 6 | 0 |
| D | 0 | 6 | 0 |
| Mode M0 | |||
|---|---|---|---|
| Quadrant | BADHDUFLAG | Total packets | Discarded packets |
| A | 0 | 17562 | 0 |
| B | 0 | 20648 | 0 |
| C | 0 | 18653 | 0 |
| D | 0 | 22411 | 0 |
| Quadrant | Total seconds | Saturated seconds | Saturation percentage |
|---|---|---|---|
| A | 8421 | 62 | 0.736255% |
| B | 8422 | 407 | 4.832581% |
| C | 8421 | 182 | 2.161264% |
| D | 8421 | 339 | 4.025650% |
Noise dominated data is calculated using 1-second bins in cleaned event files. If a bin has >2000 counts, and if more than 50% of those come from <1% of pixels, then it is considered to be noise-dominated and hence unusable.
| Quadrant | # 1 sec bins | Bins with >0 counts | Bins with >2000 counts | High rate bins dominated by noise | Noise dominated (total time) | Noise dominated (detector-on time) | Marked lightcurve |
|---|---|---|---|---|---|---|---|
| A | 9066 | 8422 | 2 | 2 | 0.02% | 0.02% | 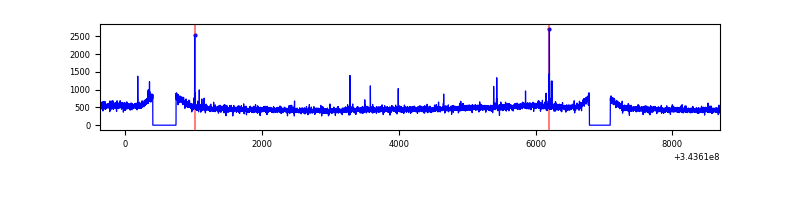 |
| B | 9067 | 8423 | 221 | 221 | 2.44% | 2.62% | 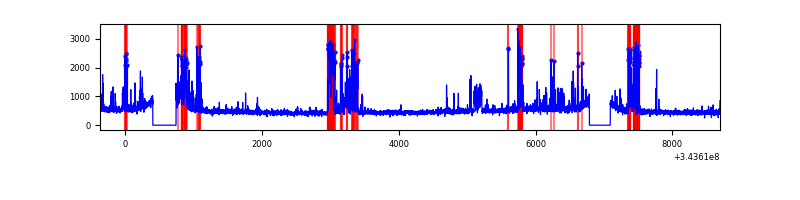 |
| C | 9066 | 8421 | 2 | 2 | 0.02% | 0.02% | 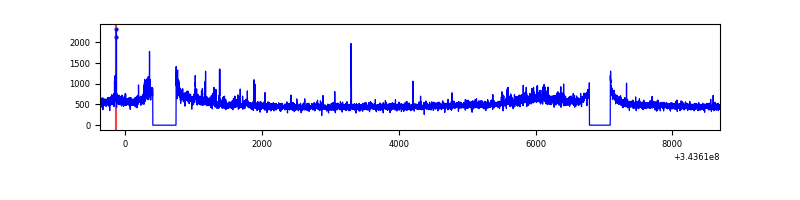 |
| D | 9066 | 8423 | 221 | 221 | 2.44% | 2.62% | 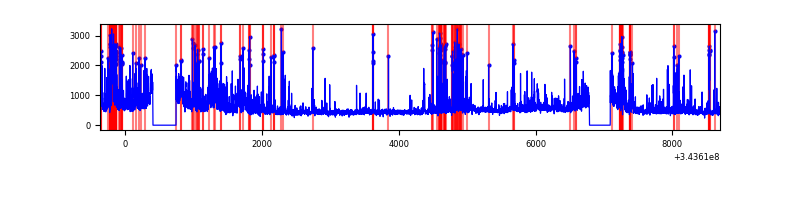 |
Top three noisy pixels from each quadrant. If the there are fewer than three noisy pixels in the level2.evt file, extra rows are filled as -1
| Pixel properties | Quadrant properties | ||||||
|---|---|---|---|---|---|---|---|
| Quadrant | DetID | PixID | Counts | Sigma | Mean | Median | Sigma |
| A | 13 | 248 | 22303 | 100.9 | 1040 | 1014 | 211.0 |
| A | 13 | 254 | 15679 | 69.51 | 1040 | 1014 | 211.0 |
| A | 3 | 137 | 9874 | 41.99 | 1040 | 1014 | 211.0 |
| B | 10 | 245 | 962508 | 4969.07 | 1009 | 982 | 193.5 |
| B | 0 | 190 | 70902 | 361.34 | 1009 | 982 | 193.5 |
| B | 4 | 52 | 28486 | 142.14 | 1009 | 982 | 193.5 |
| C | 3 | 233 | 329636 | 1396.52 | 999 | 1003 | 235.3 |
| C | 14 | 238 | 159866 | 675.09 | 999 | 1003 | 235.3 |
| C | 8 | 128 | 7594 | 28.01 | 999 | 1003 | 235.3 |
| D | 1 | 52 | 1390028 | 5797.14 | 999 | 975 | 239.6 |
| D | 2 | 250 | 237962 | 989.05 | 999 | 975 | 239.6 |
| D | 13 | 104 | 64317 | 264.35 | 999 | 975 | 239.6 |
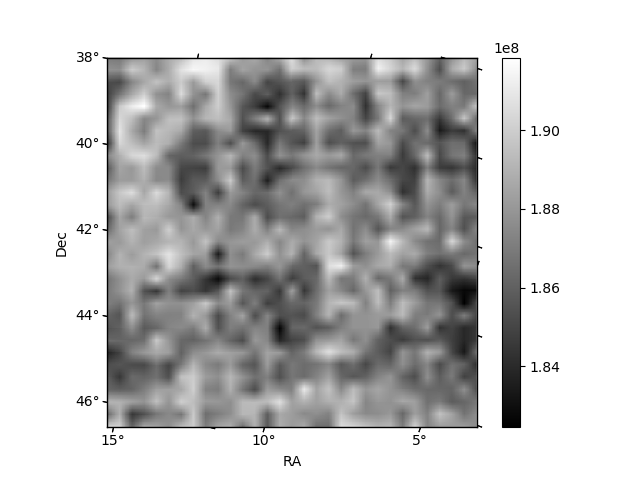
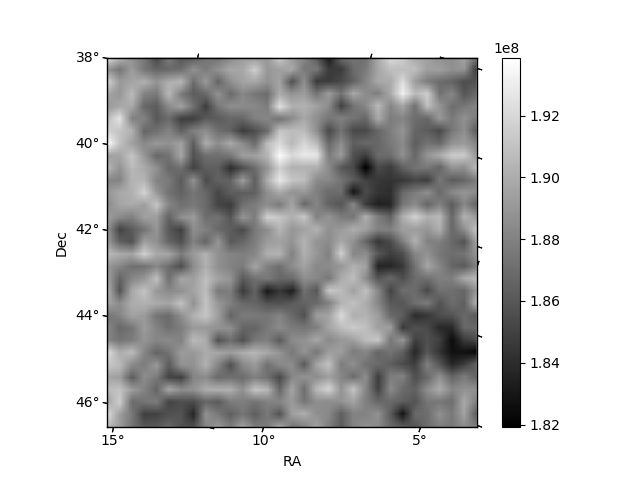
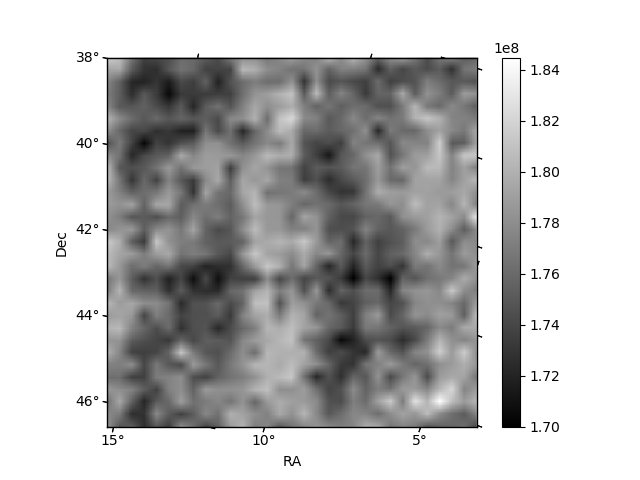
Histogram calculated using DETX and DETY for each event in the final _common_clean file
| Quadrant A | 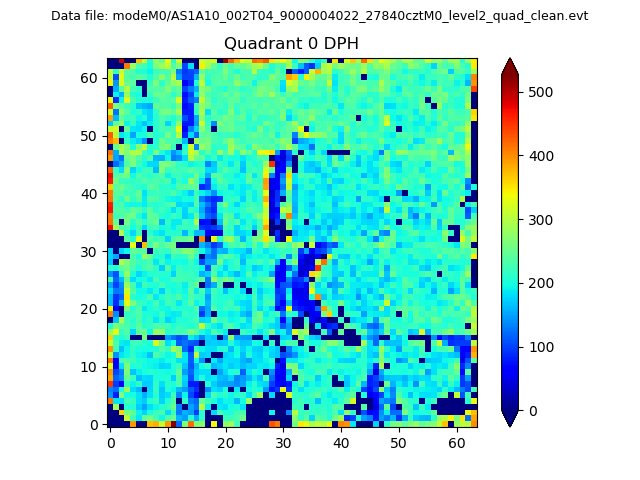 |
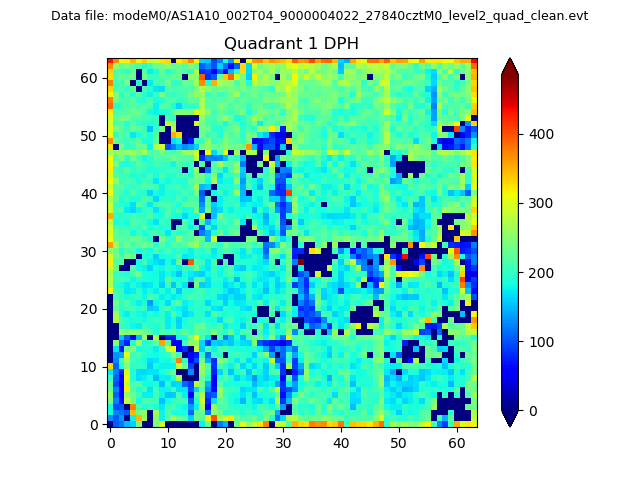 |
Quadrant B |
|---|---|---|---|
| Quadrant D | 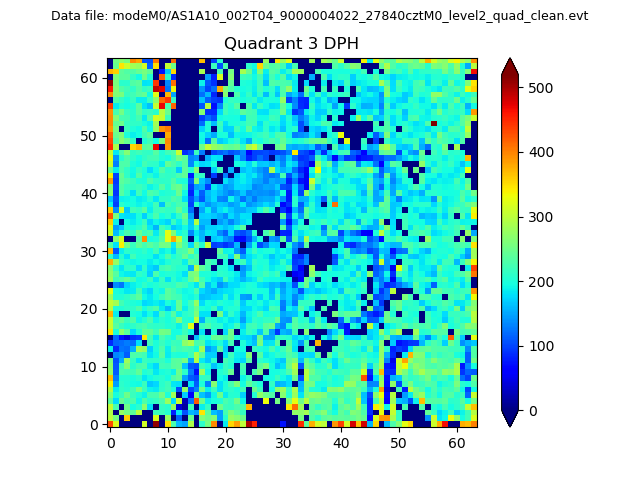 |
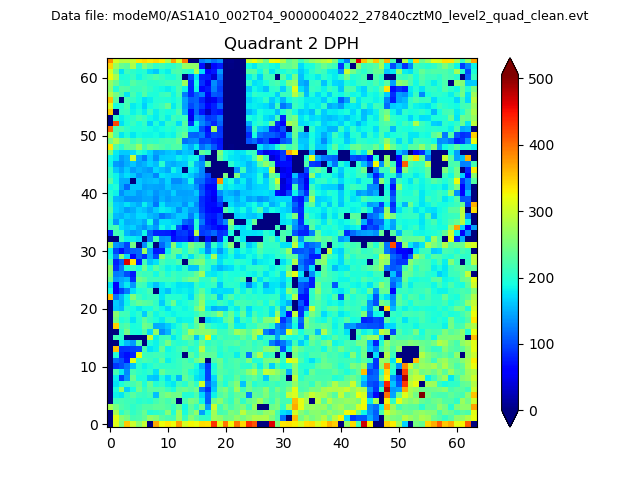 |
Quadrant C |
| Plot type | Count rate plots | Images |
|---|---|---|
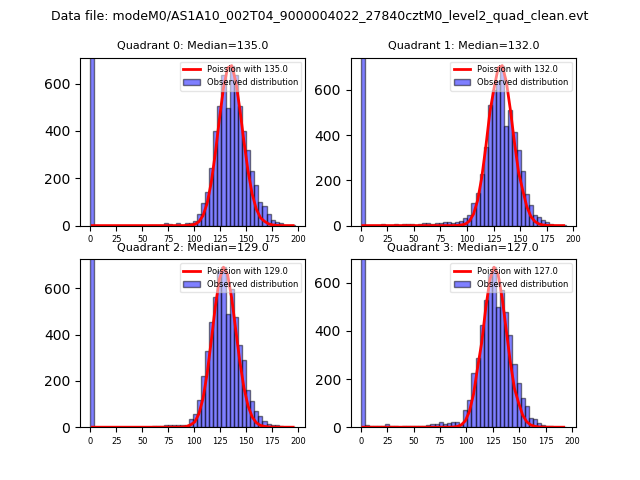
| Comparison with Poisson distribution Blue bars denote a histogram of data divided into 1 sec bins. Red curve is a Poisson curve with rate = median count rate of data. |
 |
 |
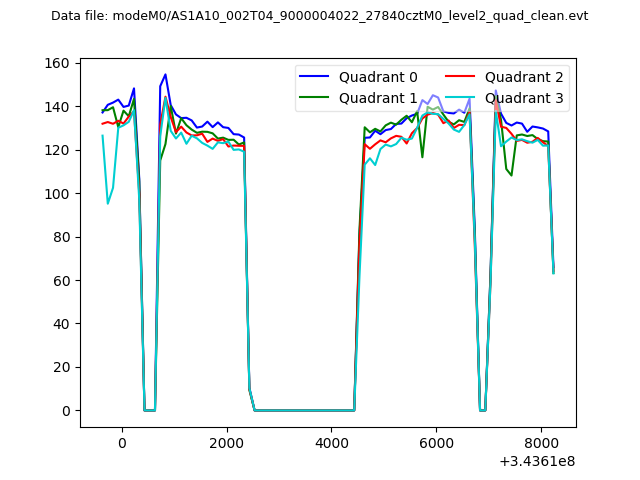
| Quadrant-wise count rates Data is divided into 100 sec bins |
 |
|
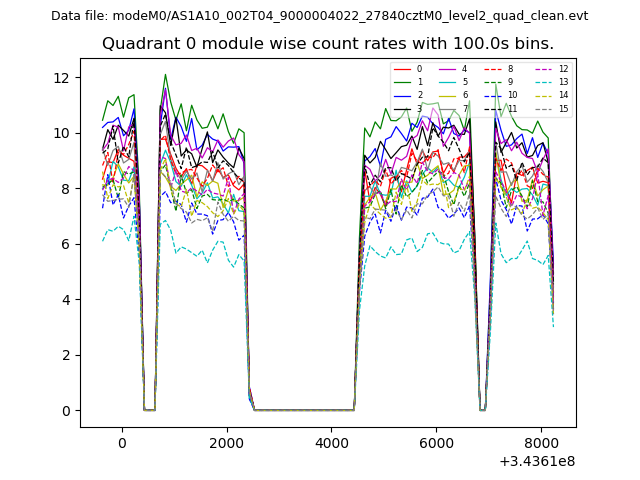
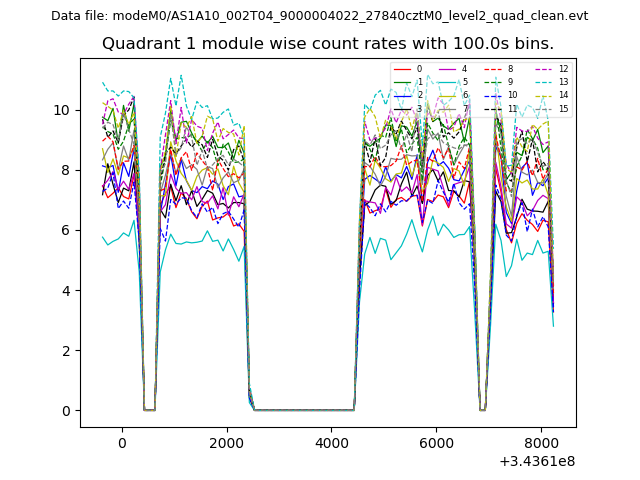
| Module-wise count rates for Quadrant A Data is divided into 100 sec bins |
 |
 |
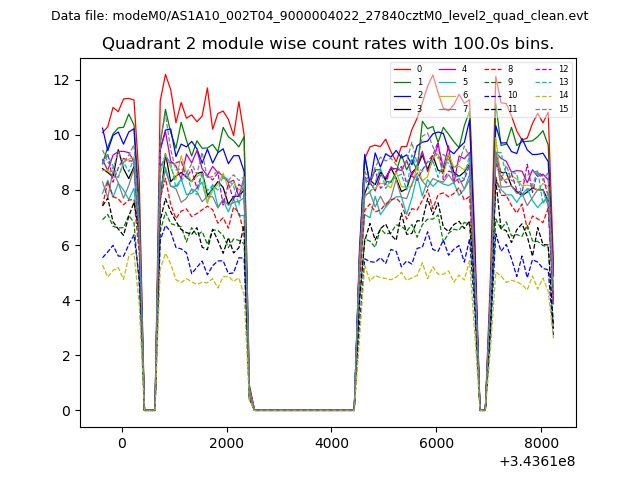
| Module-wise count rates for Quadrant B Data is divided into 100 sec bins |
 |
 |
| Module-wise count rates for Quadrant C Data is divided into 100 sec bins |
 |
 |
| Module-wise count rates for Quadrant D Data is divided into 100 sec bins |
 |
 |
| Parameter | Plot |
|---|---|
| CZT HV Monitor | 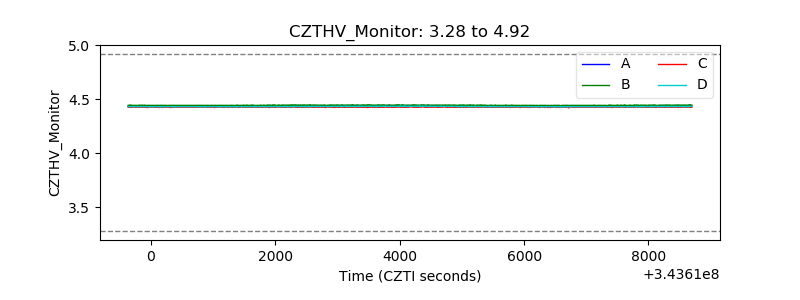 |
| D_VDD | 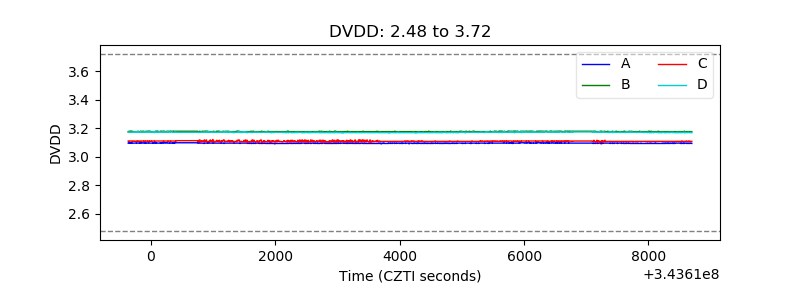 |
| Temperature 1 |  |
| Veto HV Monitor | 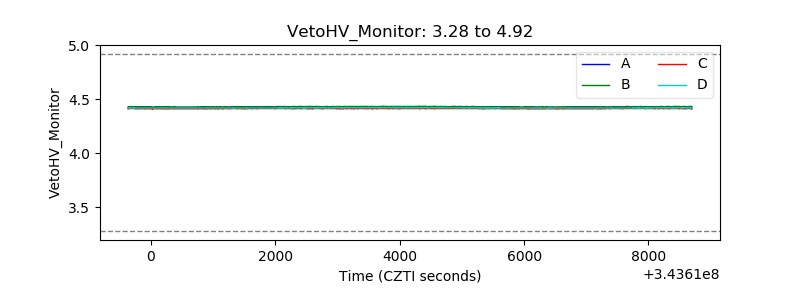 |
| Veto LLD | 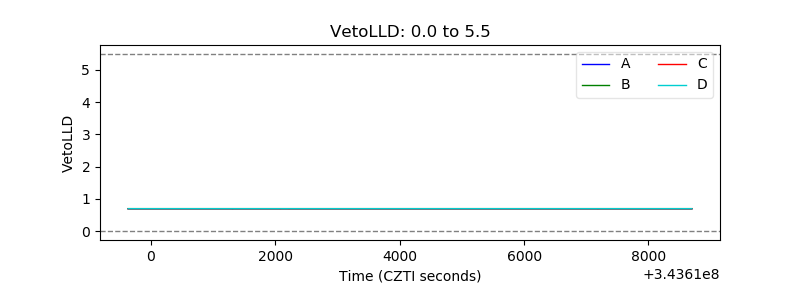 |
| Alpha Counter | 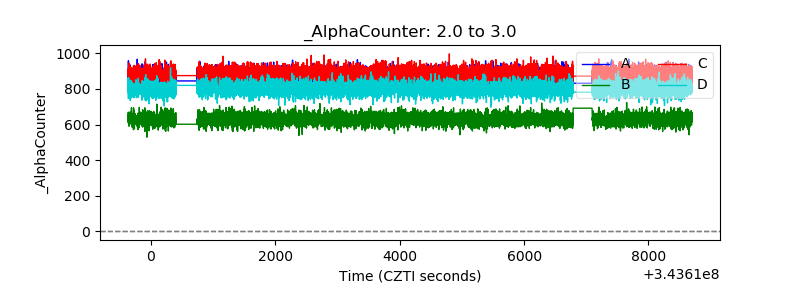 |
| _CPM_Rate | 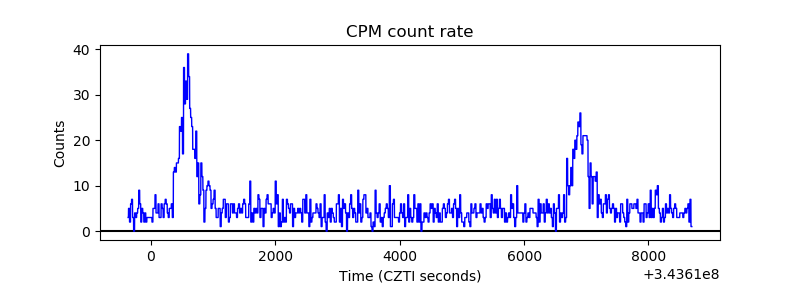 |
| CZT Counter | 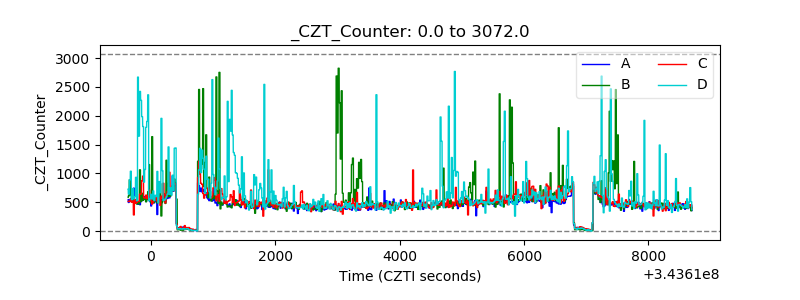 |
| +2.5 Volts monitor | 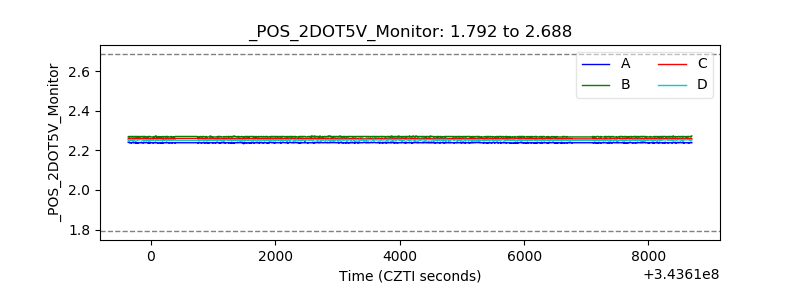 |
| +5 Volts monitor |  |
| _ROLL_ROT |  |
| _Roll_DEC |  |
| _Roll_RA | 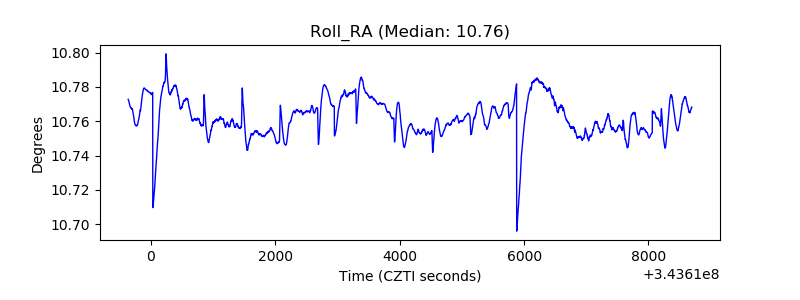 |
| Veto Counter | 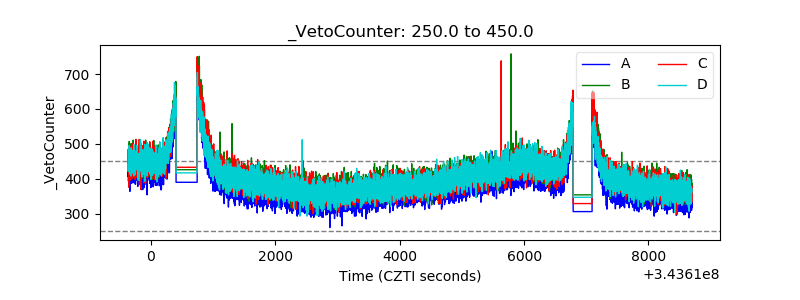 |