| Param | Original file | Final file |
|---|---|---|
| Filename | modeM0/AS1A10_002T04_9000004022_27841cztM0_level2.evt | modeM0/AS1A10_002T04_9000004022_27841cztM0_level2_quad_clean.evt |
| Size (bytes) | 529,240,320 | 92,099,520 |
| Size | 504.7 MB | 87.8 MB |
| Events in quadrant A | 3,503,129 | 586,111 |
| Events in quadrant B | 3,836,074 | 572,814 |
| Events in quadrant C | 3,670,502 | 561,866 |
| Events in quadrant D | 4,515,385 | 552,452 |
| Mode M9 | |||
|---|---|---|---|
| Quadrant | BADHDUFLAG | Total packets | Discarded packets |
| A | 0 | 4 | 0 |
| B | 0 | 4 | 0 |
| C | 0 | 4 | 0 |
| D | 0 | 4 | 0 |
| Mode M0 | |||
|---|---|---|---|
| Quadrant | BADHDUFLAG | Total packets | Discarded packets |
| A | 0 | 15303 | 0 |
| B | 0 | 16230 | 0 |
| C | 0 | 15552 | 0 |
| D | 0 | 18550 | 0 |
| Quadrant | Total seconds | Saturated seconds | Saturation percentage |
|---|---|---|---|
| A | 7411 | 53 | 0.715153% |
| B | 7411 | 143 | 1.929564% |
| C | 7410 | 94 | 1.268556% |
| D | 7411 | 157 | 2.118473% |
Noise dominated data is calculated using 1-second bins in cleaned event files. If a bin has >2000 counts, and if more than 50% of those come from <1% of pixels, then it is considered to be noise-dominated and hence unusable.
| Quadrant | # 1 sec bins | Bins with >0 counts | Bins with >2000 counts | High rate bins dominated by noise | Noise dominated (total time) | Noise dominated (detector-on time) | Marked lightcurve |
|---|---|---|---|---|---|---|---|
| A | 7801 | 7411 | 3 | 3 | 0.04% | 0.04% | 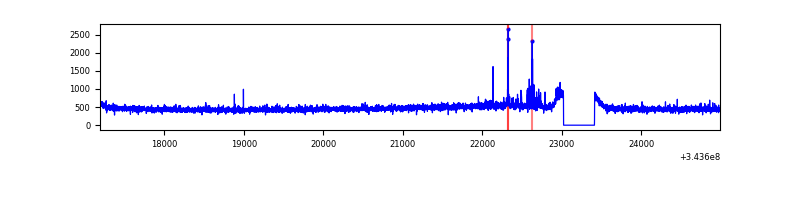 |
| B | 7801 | 7411 | 59 | 59 | 0.76% | 0.80% | 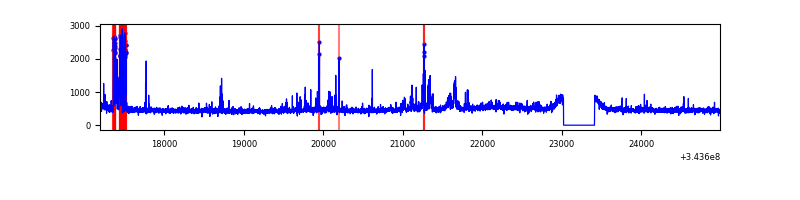 |
| C | 7800 | 7411 | 0 | 0 | 0.00% | 0.00% | 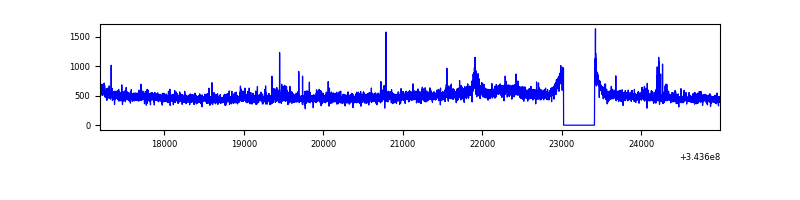 |
| D | 7801 | 7411 | 103 | 103 | 1.32% | 1.39% | 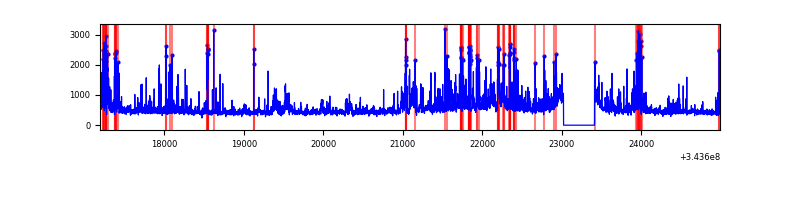 |
Top three noisy pixels from each quadrant. If the there are fewer than three noisy pixels in the level2.evt file, extra rows are filled as -1
| Pixel properties | Quadrant properties | ||||||
|---|---|---|---|---|---|---|---|
| Quadrant | DetID | PixID | Counts | Sigma | Mean | Median | Sigma |
| A | 13 | 248 | 52294 | 283.7 | 890 | 870 | 181.3 |
| A | 0 | 31 | 15234 | 79.24 | 890 | 870 | 181.3 |
| A | 13 | 254 | 13603 | 70.25 | 890 | 870 | 181.3 |
| B | 10 | 245 | 310934 | 1830.82 | 875 | 851 | 169.4 |
| B | 15 | 33 | 39899 | 230.55 | 875 | 851 | 169.4 |
| B | 0 | 190 | 33601 | 193.37 | 875 | 851 | 169.4 |
| C | 3 | 233 | 193342 | 956.69 | 856 | 861 | 201.2 |
| C | 14 | 238 | 134760 | 665.52 | 856 | 861 | 201.2 |
| C | 13 | 61 | 5905 | 25.07 | 856 | 861 | 201.2 |
| D | 1 | 52 | 1045697 | 5117.77 | 860 | 839 | 204.2 |
| D | 2 | 250 | 135733 | 660.72 | 860 | 839 | 204.2 |
| D | 2 | 120 | 32392 | 154.55 | 860 | 839 | 204.2 |
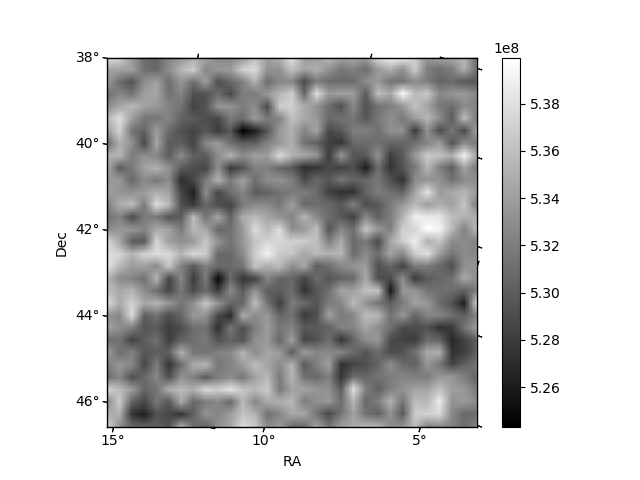
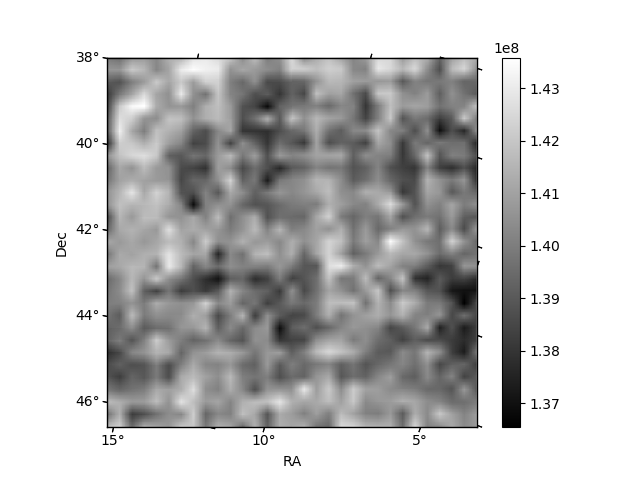
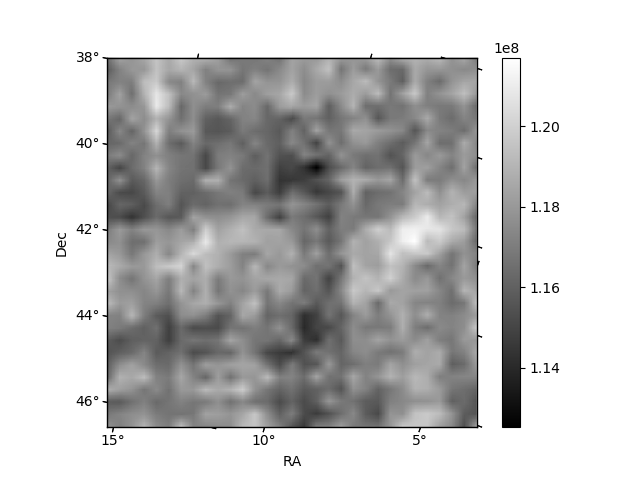
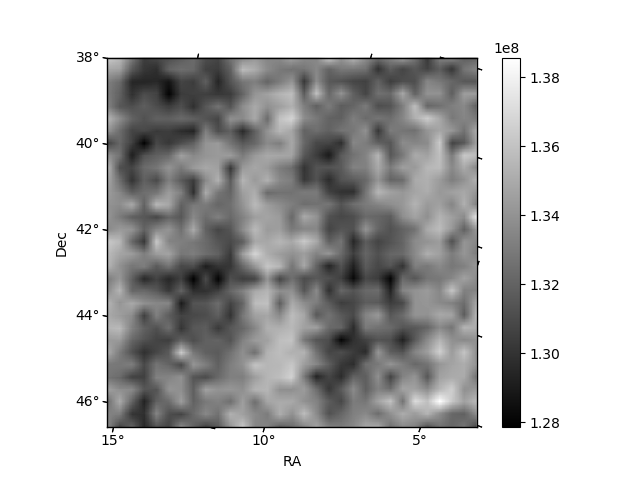
Histogram calculated using DETX and DETY for each event in the final _common_clean file
| Quadrant A | 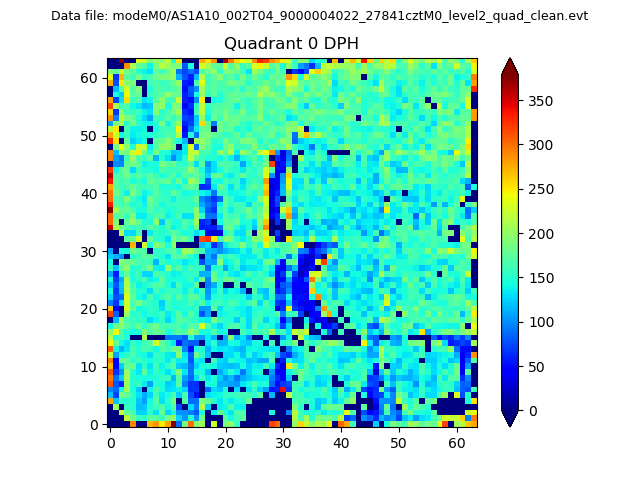 |
 |
Quadrant B |
|---|---|---|---|
| Quadrant D | 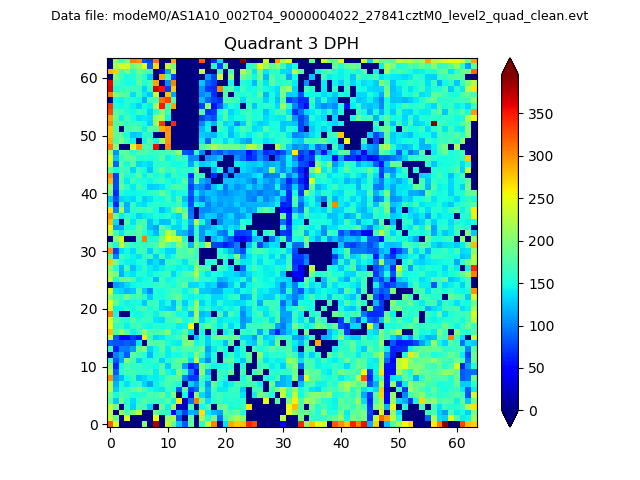 |
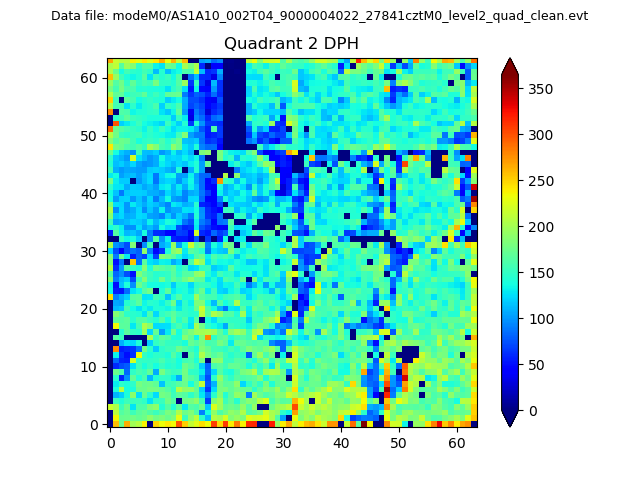 |
Quadrant C |
| Plot type | Count rate plots | Images |
|---|---|---|
| Comparison with Poisson distribution Blue bars denote a histogram of data divided into 1 sec bins. Red curve is a Poisson curve with rate = median count rate of data. |
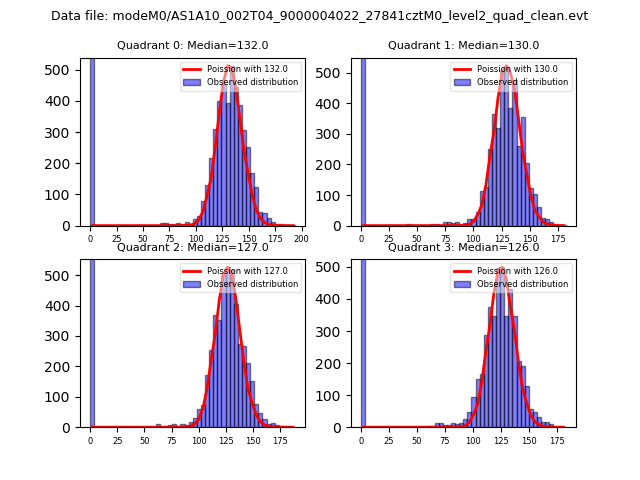 |
 |
| Quadrant-wise count rates Data is divided into 100 sec bins |
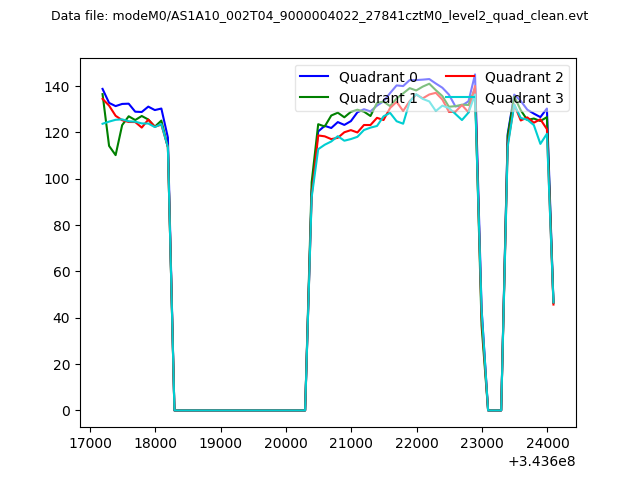 |
|
| Module-wise count rates for Quadrant A Data is divided into 100 sec bins |
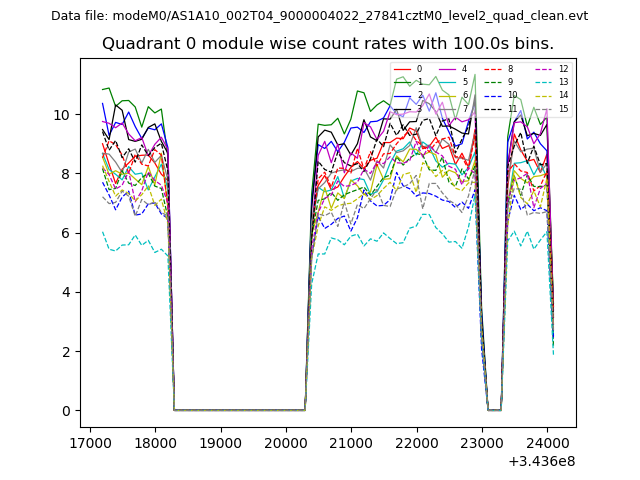 |
 |
| Module-wise count rates for Quadrant B Data is divided into 100 sec bins |
 |
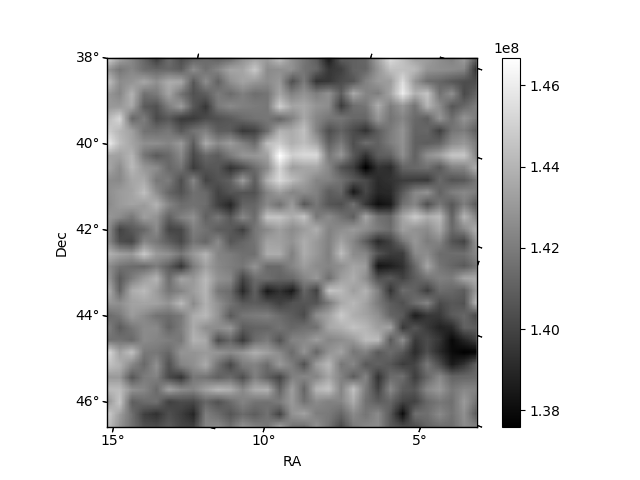 |
| Module-wise count rates for Quadrant C Data is divided into 100 sec bins |
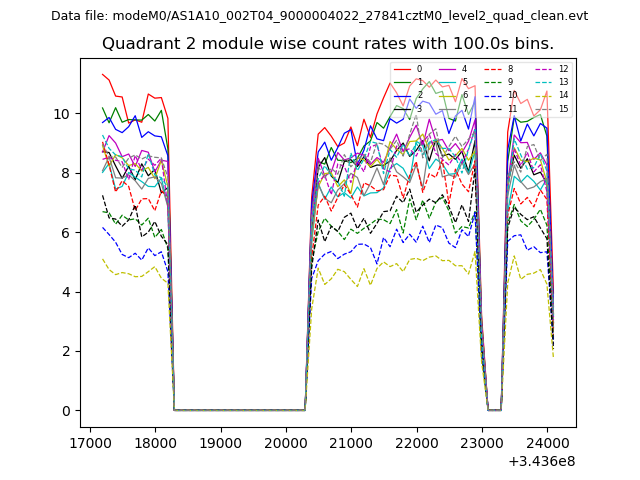 |
 |
| Module-wise count rates for Quadrant D Data is divided into 100 sec bins |
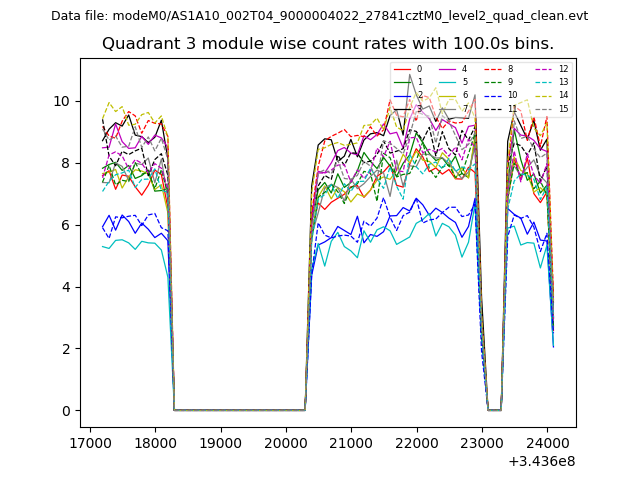 |
 |
| Parameter | Plot |
|---|---|
| CZT HV Monitor | 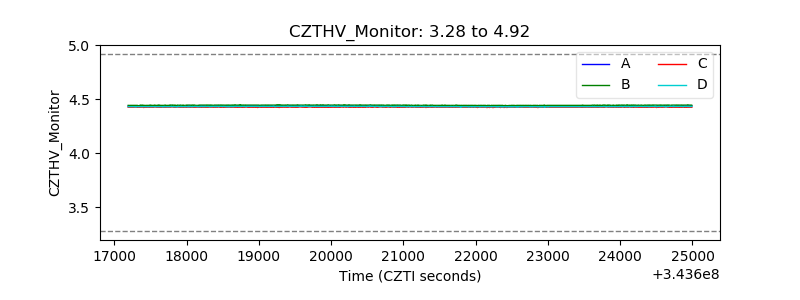 |
| D_VDD | 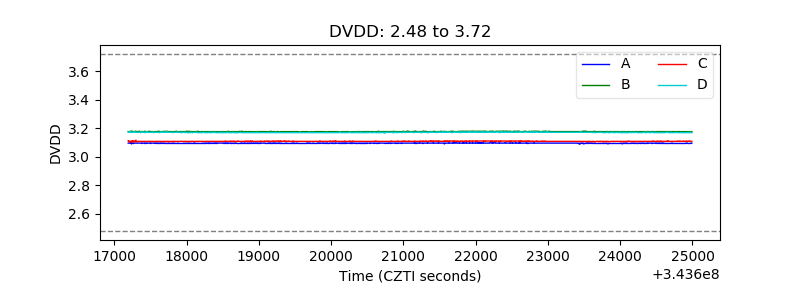 |
| Temperature 1 | 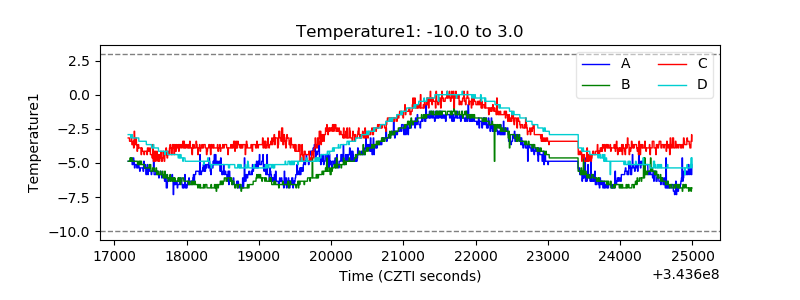 |
| Veto HV Monitor | 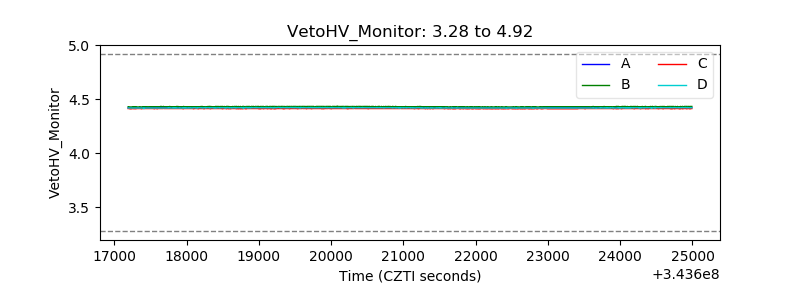 |
| Veto LLD | 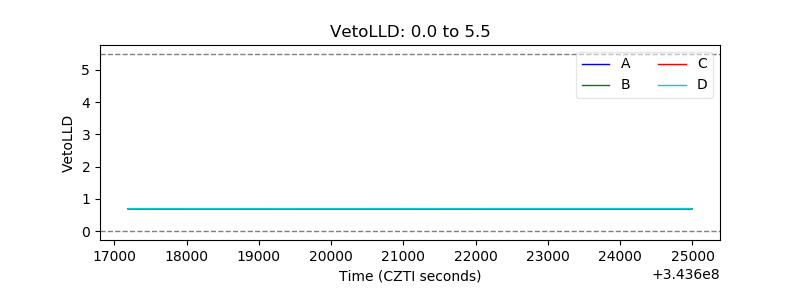 |
| Alpha Counter | 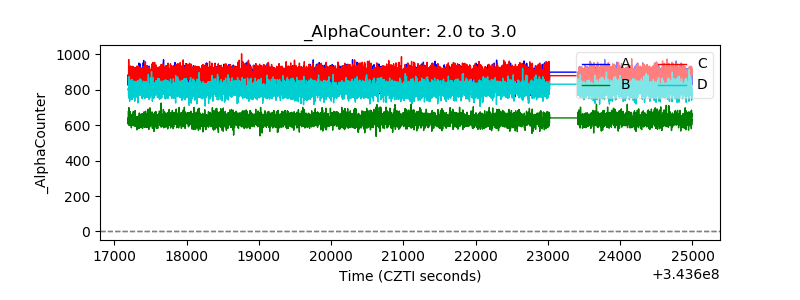 |
| _CPM_Rate | 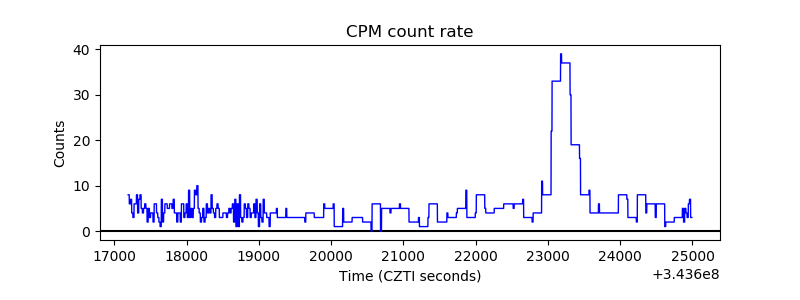 |
| CZT Counter | 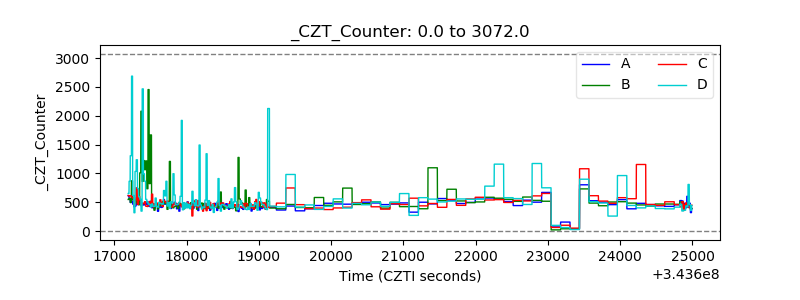 |
| +2.5 Volts monitor |  |
| +5 Volts monitor |  |
| _ROLL_ROT | 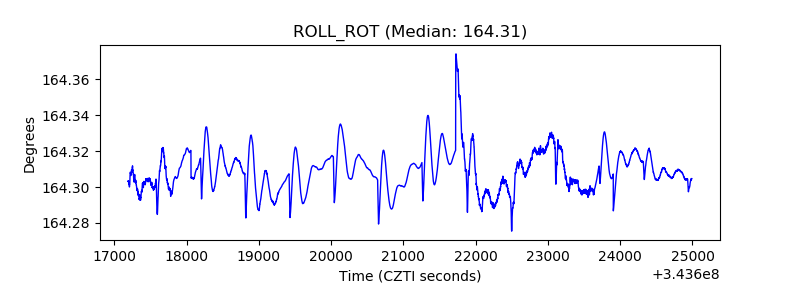 |
| _Roll_DEC | 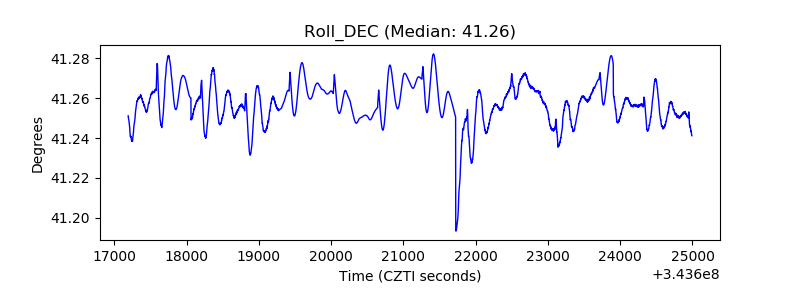 |
| _Roll_RA | 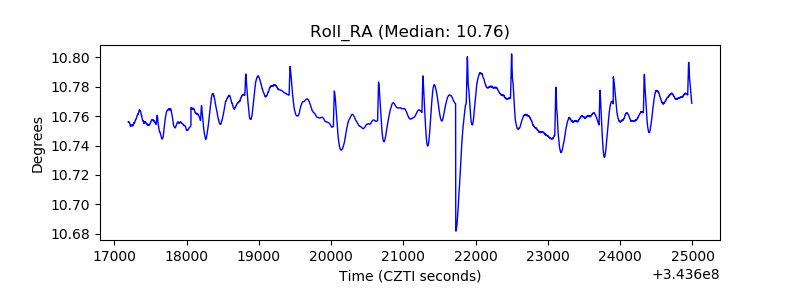 |
| Veto Counter |  |