| Param | Original file | Final file |
|---|---|---|
| Filename | modeM0/AS1A10_002T04_9000004022_27843cztM0_level2.evt | modeM0/AS1A10_002T04_9000004022_27843cztM0_level2_quad_clean.evt |
| Size (bytes) | 939,130,560 | 147,864,960 |
| Size | 895.6 MB | 141.0 MB |
| Events in quadrant A | 6,110,557 | 923,687 |
| Events in quadrant B | 6,401,702 | 912,910 |
| Events in quadrant C | 6,332,688 | 886,151 |
| Events in quadrant D | 8,721,761 | 861,544 |
| Mode M9 | |||
|---|---|---|---|
| Quadrant | BADHDUFLAG | Total packets | Discarded packets |
| A | 0 | 15 | 0 |
| B | 0 | 16 | 0 |
| C | 0 | 16 | 0 |
| D | 0 | 16 | 0 |
| Mode M0 | |||
|---|---|---|---|
| Quadrant | BADHDUFLAG | Total packets | Discarded packets |
| A | 0 | 26465 | 0 |
| B | 0 | 27152 | 0 |
| C | 0 | 26816 | 0 |
| D | 0 | 34579 | 0 |
| Quadrant | Total seconds | Saturated seconds | Saturation percentage |
|---|---|---|---|
| A | 12934 | 110 | 0.850472% |
| B | 12933 | 181 | 1.399521% |
| C | 12933 | 181 | 1.399521% |
| D | 12933 | 665 | 5.141885% |
Noise dominated data is calculated using 1-second bins in cleaned event files. If a bin has >2000 counts, and if more than 50% of those come from <1% of pixels, then it is considered to be noise-dominated and hence unusable.
| Quadrant | # 1 sec bins | Bins with >0 counts | Bins with >2000 counts | High rate bins dominated by noise | Noise dominated (total time) | Noise dominated (detector-on time) | Marked lightcurve |
|---|---|---|---|---|---|---|---|
| A | 14229 | 12934 | 19 | 19 | 0.13% | 0.15% | 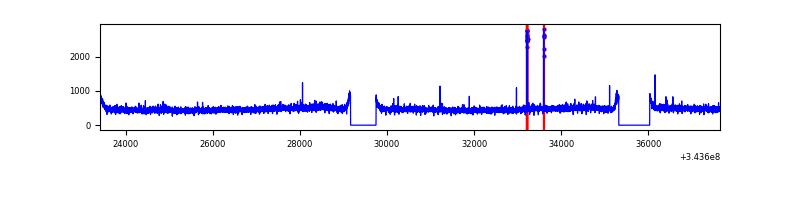 |
| B | 14228 | 12933 | 32 | 32 | 0.22% | 0.25% | 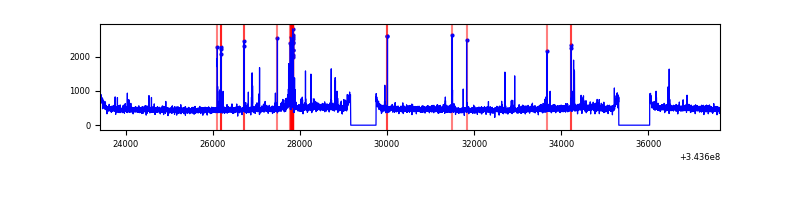 |
| C | 14228 | 12933 | 0 | 0 | 0.00% | 0.00% | 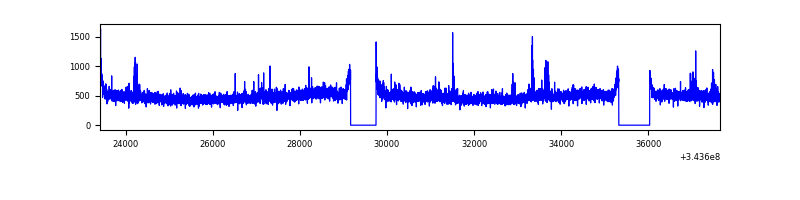 |
| D | 14228 | 12933 | 522 | 522 | 3.67% | 4.04% | 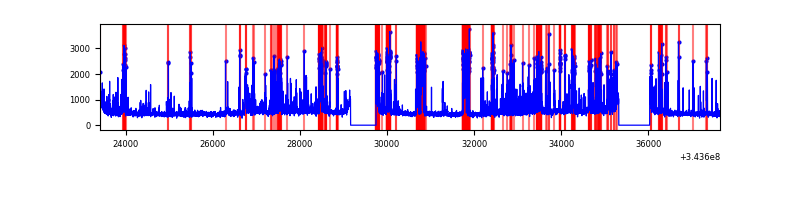 |
Top three noisy pixels from each quadrant. If the there are fewer than three noisy pixels in the level2.evt file, extra rows are filled as -1
| Pixel properties | Quadrant properties | ||||||
|---|---|---|---|---|---|---|---|
| Quadrant | DetID | PixID | Counts | Sigma | Mean | Median | Sigma |
| A | 6 | 16 | 57021 | 175.69 | 1567 | 1532 | 315.8 |
| A | 13 | 254 | 22656 | 66.88 | 1567 | 1532 | 315.8 |
| A | 3 | 137 | 15257 | 43.46 | 1567 | 1532 | 315.8 |
| B | 10 | 245 | 114304 | 379.36 | 1551 | 1509 | 297.3 |
| B | 0 | 190 | 86490 | 285.81 | 1551 | 1509 | 297.3 |
| B | 15 | 33 | 45103 | 146.62 | 1551 | 1509 | 297.3 |
| C | 14 | 238 | 240377 | 672.45 | 1504 | 1513 | 355.2 |
| C | 3 | 233 | 235618 | 659.05 | 1504 | 1513 | 355.2 |
| C | 13 | 61 | 10178 | 24.39 | 1504 | 1513 | 355.2 |
| D | 1 | 52 | 2667458 | 7515.42 | 1489 | 1450 | 354.7 |
| D | 2 | 250 | 284977 | 799.26 | 1489 | 1450 | 354.7 |
| D | 2 | 120 | 84653 | 234.55 | 1489 | 1450 | 354.7 |
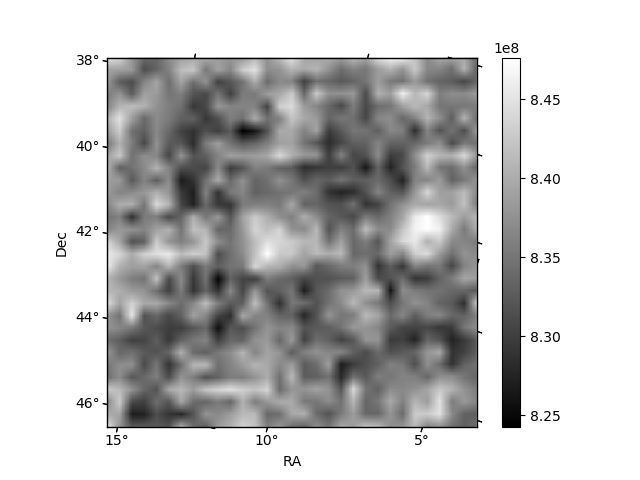
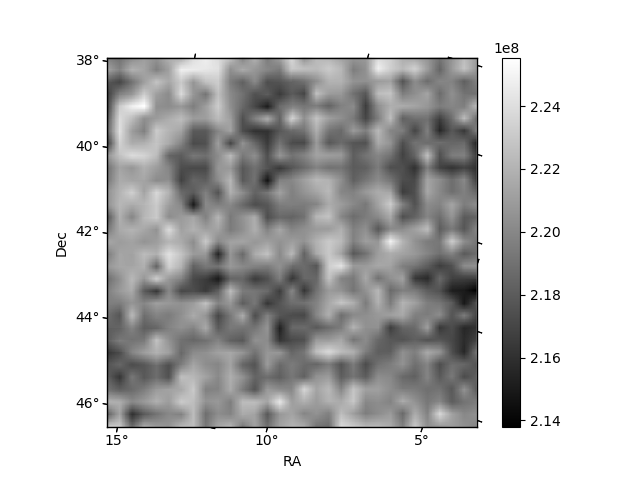
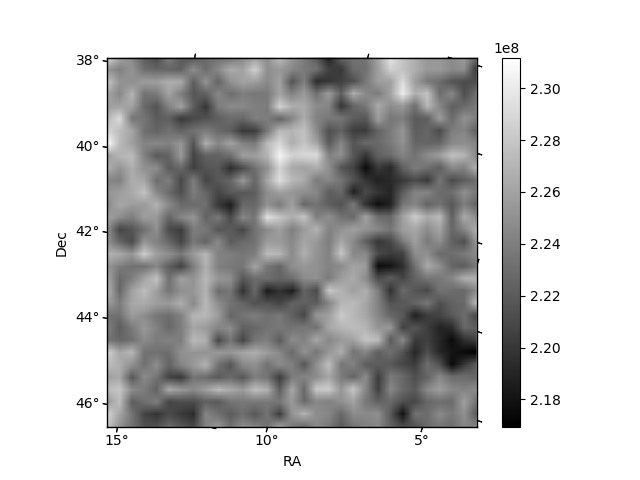
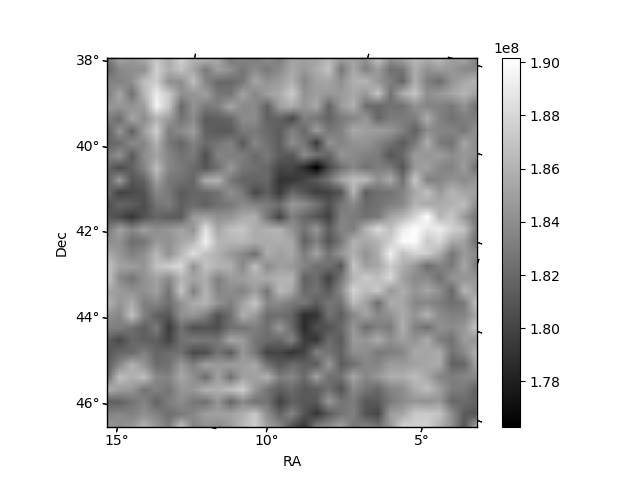
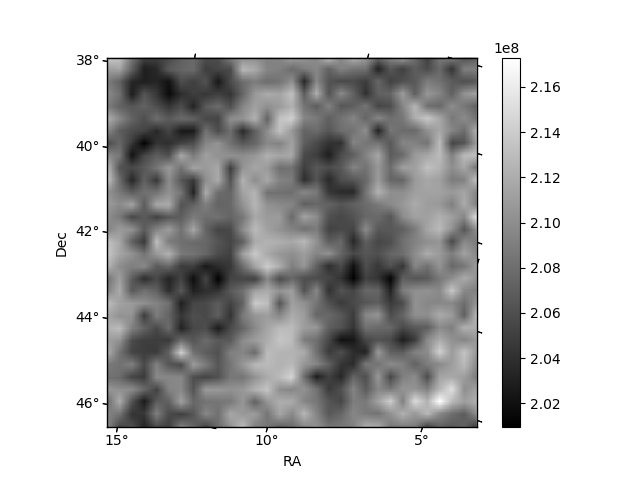
Histogram calculated using DETX and DETY for each event in the final _common_clean file
| Quadrant A | 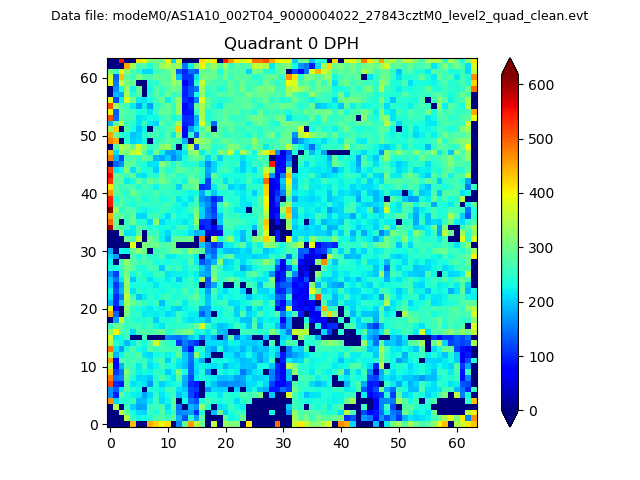 |
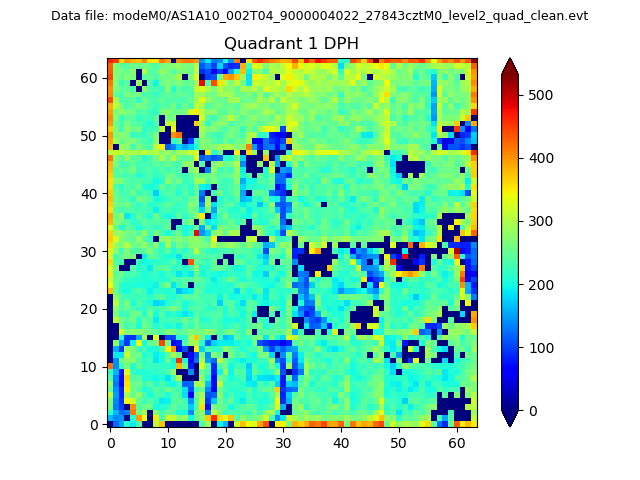 |
Quadrant B |
|---|---|---|---|
| Quadrant D |  |
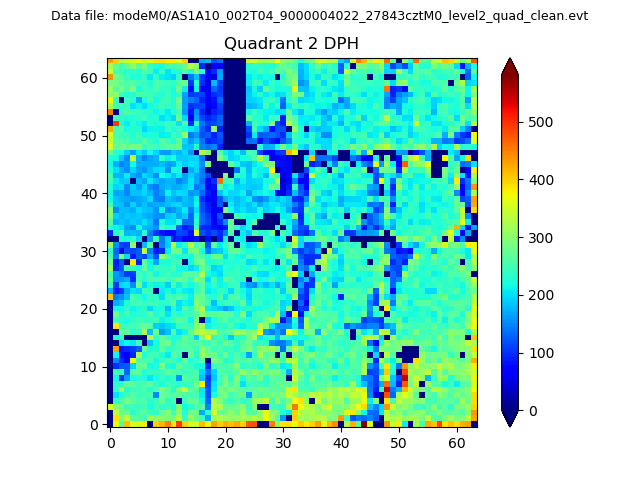 |
Quadrant C |
| Plot type | Count rate plots | Images |
|---|---|---|
| Comparison with Poisson distribution Blue bars denote a histogram of data divided into 1 sec bins. Red curve is a Poisson curve with rate = median count rate of data. |
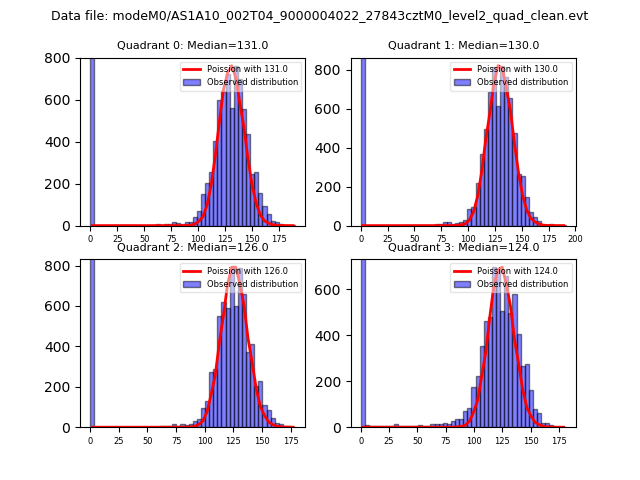 |
 |
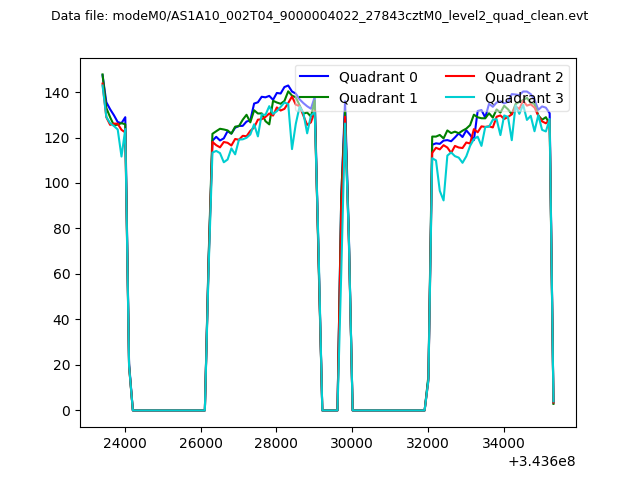
| Quadrant-wise count rates Data is divided into 100 sec bins |
 |
|
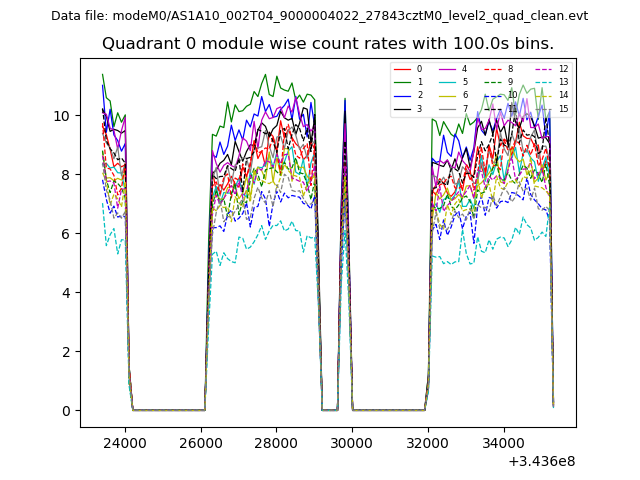
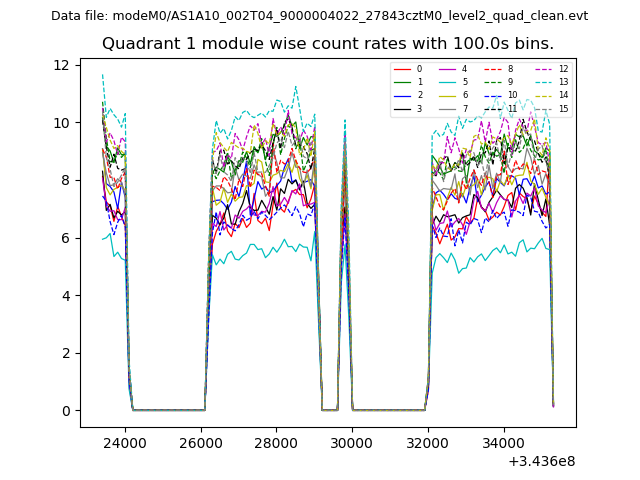
| Module-wise count rates for Quadrant A Data is divided into 100 sec bins |
 |
 |
| Module-wise count rates for Quadrant B Data is divided into 100 sec bins |
 |
 |
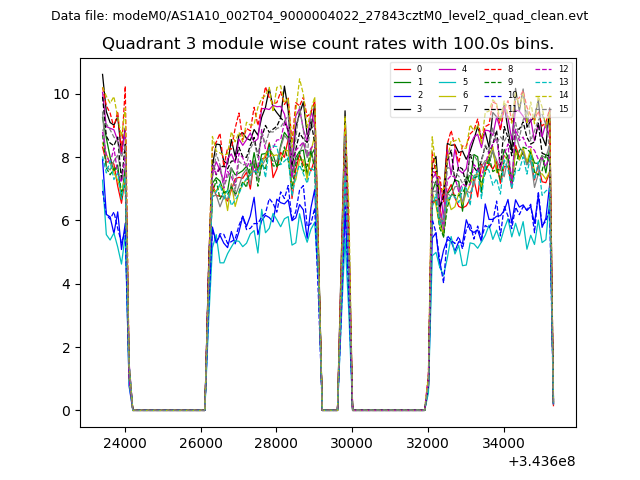
| Module-wise count rates for Quadrant C Data is divided into 100 sec bins |
 |
 |
| Module-wise count rates for Quadrant D Data is divided into 100 sec bins |
 |
 |
| Parameter | Plot |
|---|---|
| CZT HV Monitor | 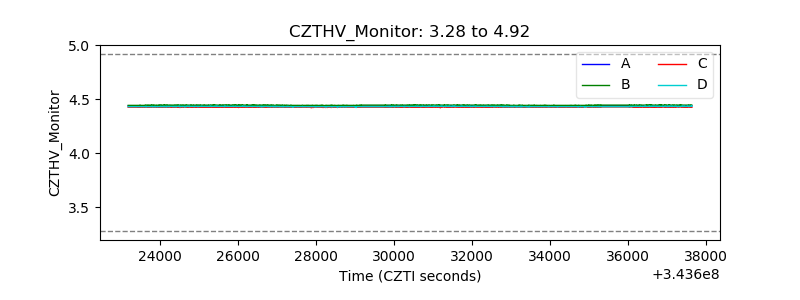 |
| D_VDD | 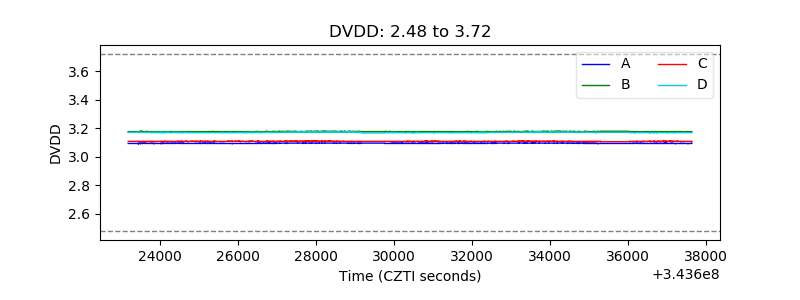 |
| Temperature 1 | 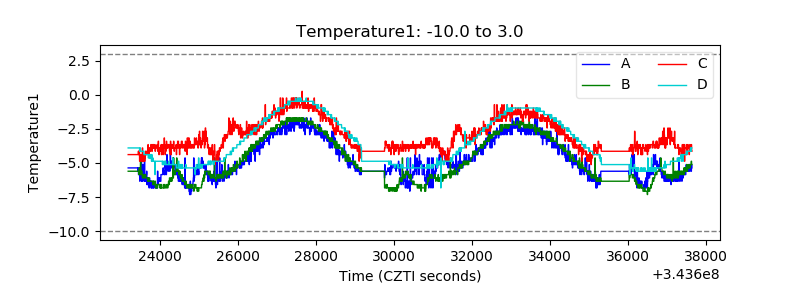 |
| Veto HV Monitor | 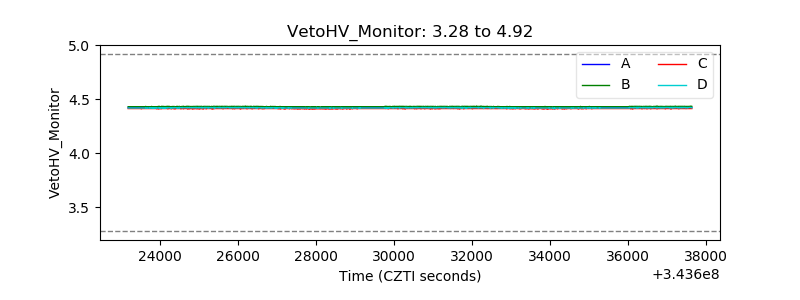 |
| Veto LLD | 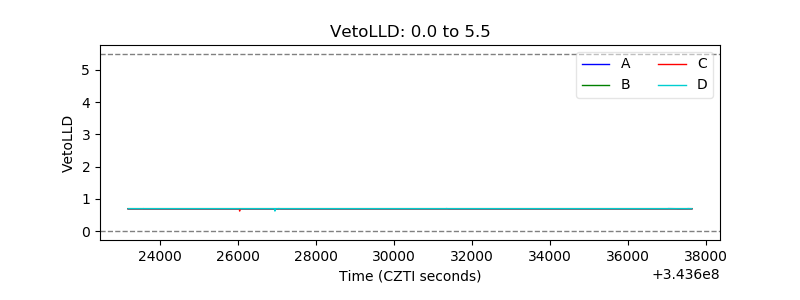 |
| Alpha Counter | 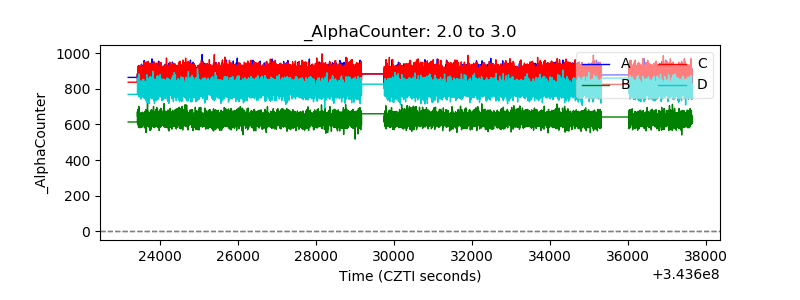 |
| _CPM_Rate |  |
| CZT Counter | 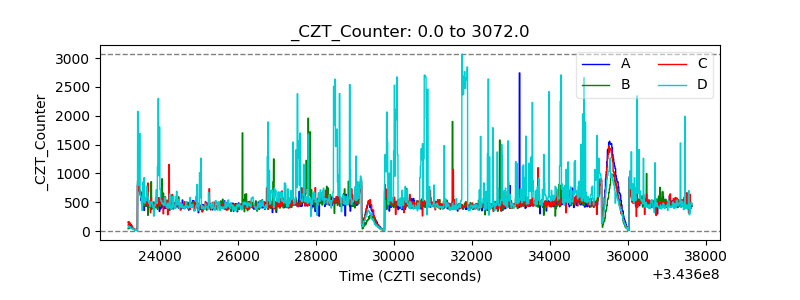 |
| +2.5 Volts monitor |  |
| +5 Volts monitor |  |
| _ROLL_ROT | 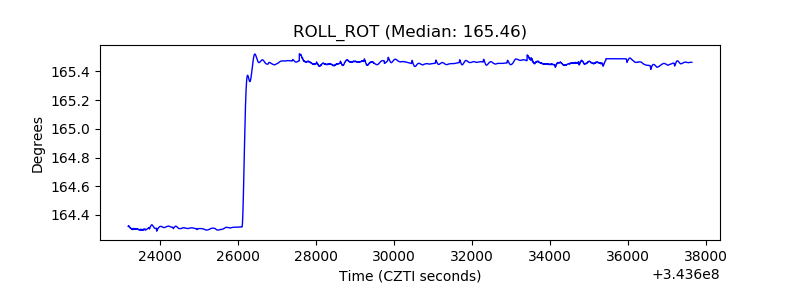 |
| _Roll_DEC | 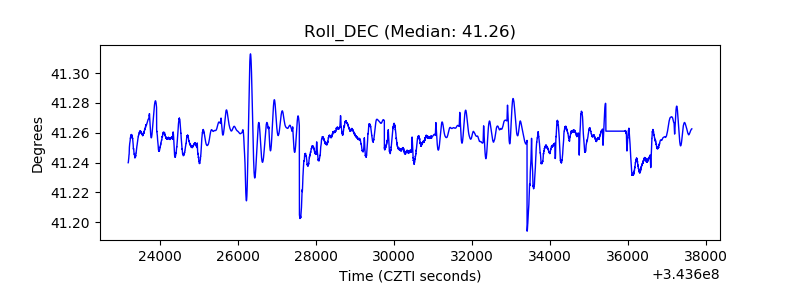 |
| _Roll_RA | 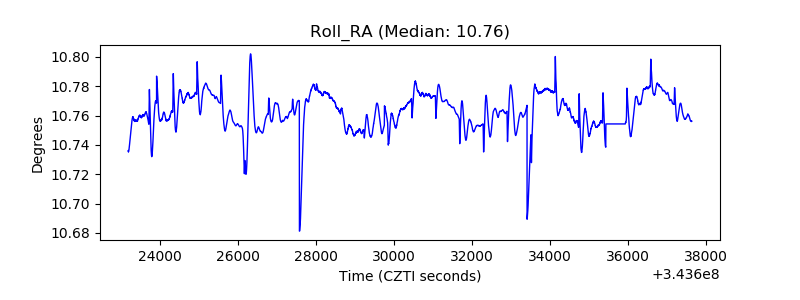 |
| Veto Counter | 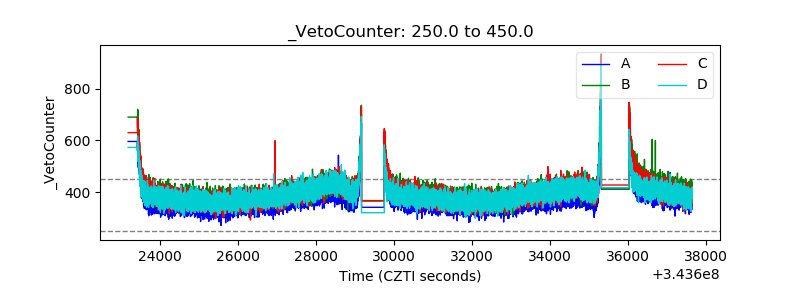 |