| Param | Original file | Final file |
|---|---|---|
| Filename | modeM0/AS1A10_002T04_9000004022_27844cztM0_level2.evt | modeM0/AS1A10_002T04_9000004022_27844cztM0_level2_quad_clean.evt |
| Size (bytes) | 1,790,873,280 | 295,997,760 |
| Size | 1.7 GB | 282.3 MB |
| Events in quadrant A | 11,476,894 | 1,891,201 |
| Events in quadrant B | 13,030,285 | 1,842,883 |
| Events in quadrant C | 12,325,925 | 1,804,404 |
| Events in quadrant D | 15,771,853 | 1,763,064 |
| Mode M9 | |||
|---|---|---|---|
| Quadrant | BADHDUFLAG | Total packets | Discarded packets |
| A | 0 | 26 | 0 |
| B | 0 | 26 | 0 |
| C | 0 | 26 | 0 |
| D | 0 | 26 | 0 |
| Mode M0 | |||
|---|---|---|---|
| Quadrant | BADHDUFLAG | Total packets | Discarded packets |
| A | 0 | 49580 | 0 |
| B | 0 | 54011 | 0 |
| C | 0 | 51753 | 0 |
| D | 0 | 63165 | 0 |
| Quadrant | Total seconds | Saturated seconds | Saturation percentage |
|---|---|---|---|
| A | 24176 | 201 | 0.831403% |
| B | 24176 | 647 | 2.676208% |
| C | 24176 | 371 | 1.534580% |
| D | 24177 | 948 | 3.921082% |
Noise dominated data is calculated using 1-second bins in cleaned event files. If a bin has >2000 counts, and if more than 50% of those come from <1% of pixels, then it is considered to be noise-dominated and hence unusable.
| Quadrant | # 1 sec bins | Bins with >0 counts | Bins with >2000 counts | High rate bins dominated by noise | Noise dominated (total time) | Noise dominated (detector-on time) | Marked lightcurve |
|---|---|---|---|---|---|---|---|
| A | 26756 | 24176 | 22 | 22 | 0.08% | 0.09% | 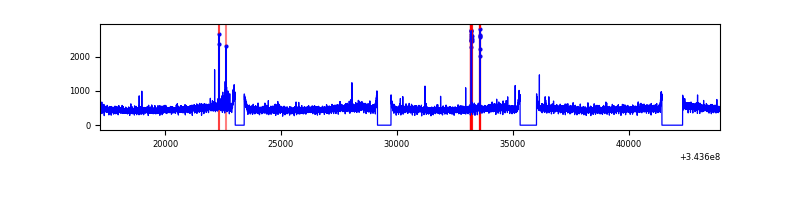 |
| B | 26756 | 24176 | 345 | 345 | 1.29% | 1.43% | 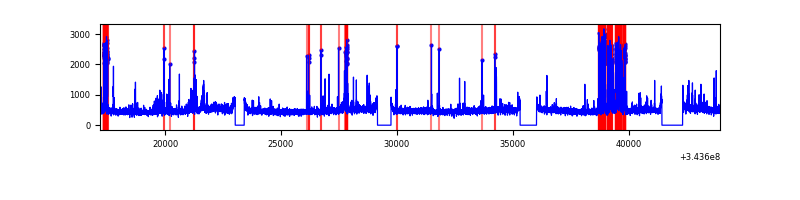 |
| C | 26756 | 24177 | 8 | 8 | 0.03% | 0.03% | 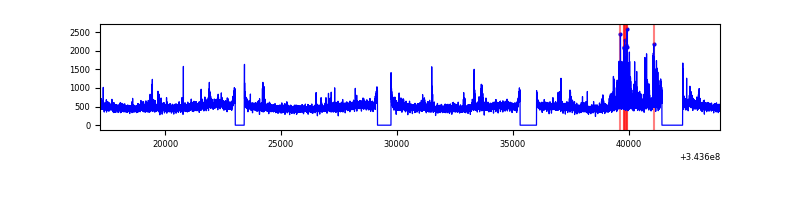 |
| D | 26757 | 24177 | 730 | 730 | 2.73% | 3.02% | 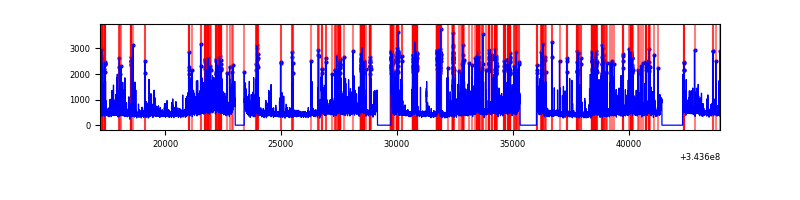 |
Top three noisy pixels from each quadrant. If the there are fewer than three noisy pixels in the level2.evt file, extra rows are filled as -1
| Pixel properties | Quadrant properties | ||||||
|---|---|---|---|---|---|---|---|
| Quadrant | DetID | PixID | Counts | Sigma | Mean | Median | Sigma |
| A | 6 | 16 | 59099 | 95.53 | 2940 | 2878 | 588.5 |
| A | 13 | 248 | 53956 | 86.79 | 2940 | 2878 | 588.5 |
| A | 13 | 254 | 42316 | 67.01 | 2940 | 2878 | 588.5 |
| B | 10 | 245 | 1367668 | 2473.1 | 2887 | 2809 | 551.9 |
| B | 0 | 190 | 162226 | 288.86 | 2887 | 2809 | 551.9 |
| B | 15 | 33 | 85779 | 150.34 | 2887 | 2809 | 551.9 |
| C | 3 | 233 | 911932 | 1382.73 | 2813 | 2826 | 657.5 |
| C | 14 | 238 | 450367 | 680.7 | 2813 | 2826 | 657.5 |
| C | 13 | 61 | 19074 | 24.71 | 2813 | 2826 | 657.5 |
| D | 1 | 52 | 4443699 | 6709.17 | 2811 | 2742 | 661.9 |
| D | 2 | 250 | 449903 | 675.55 | 2811 | 2742 | 661.9 |
| D | 2 | 120 | 132726 | 196.37 | 2811 | 2742 | 661.9 |
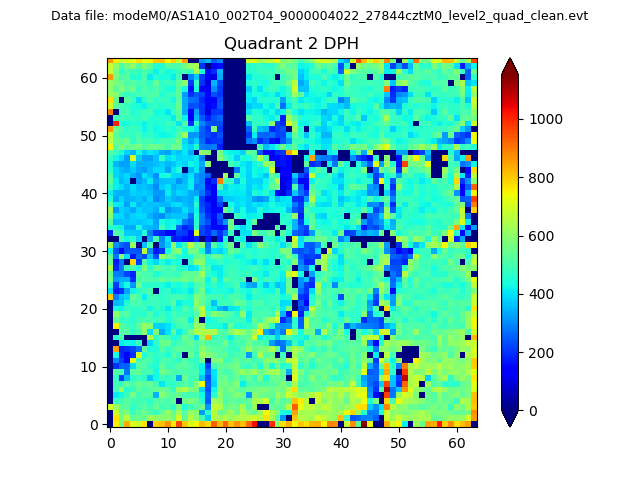
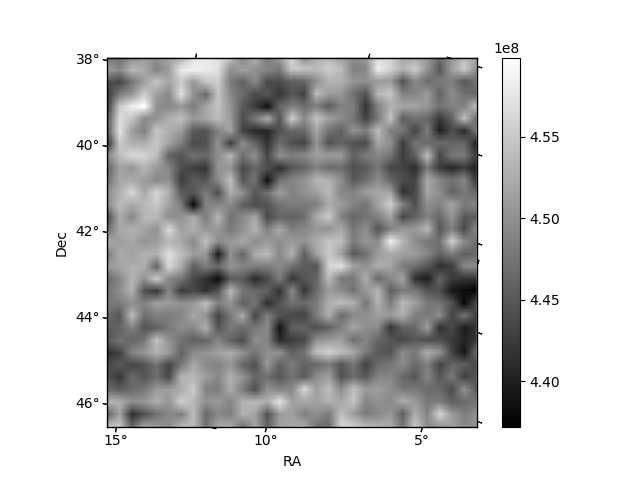
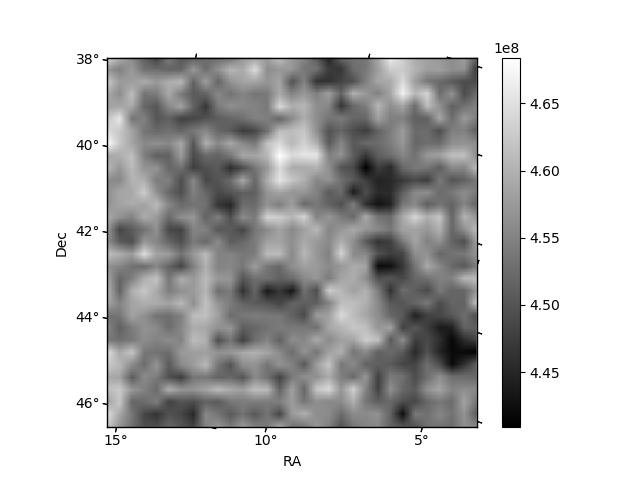
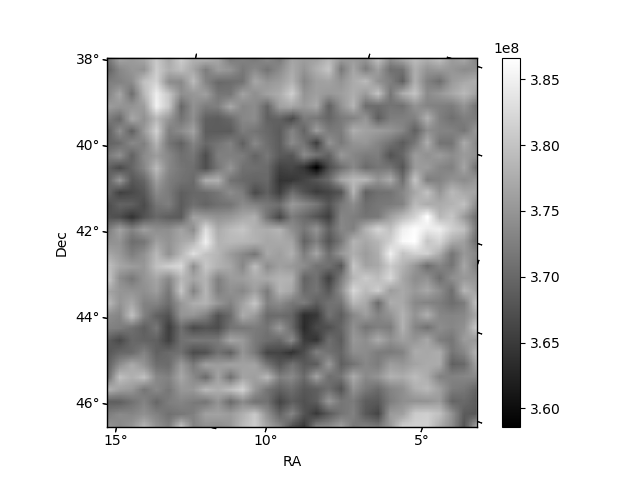
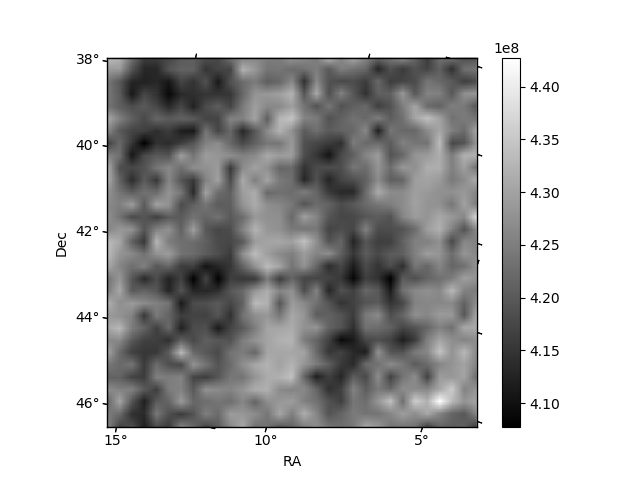
Histogram calculated using DETX and DETY for each event in the final _common_clean file
| Quadrant A | 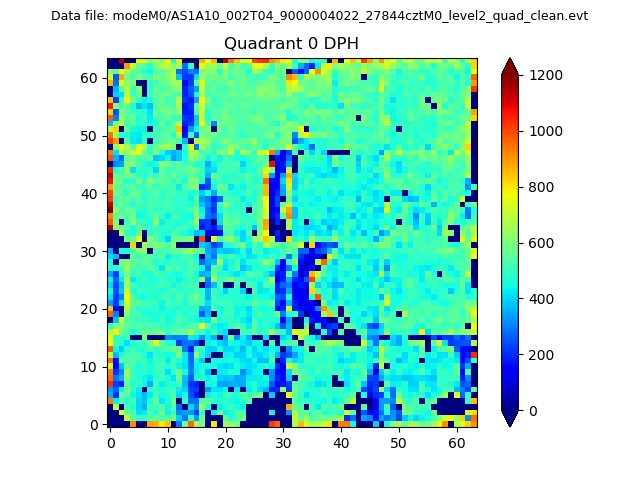 |
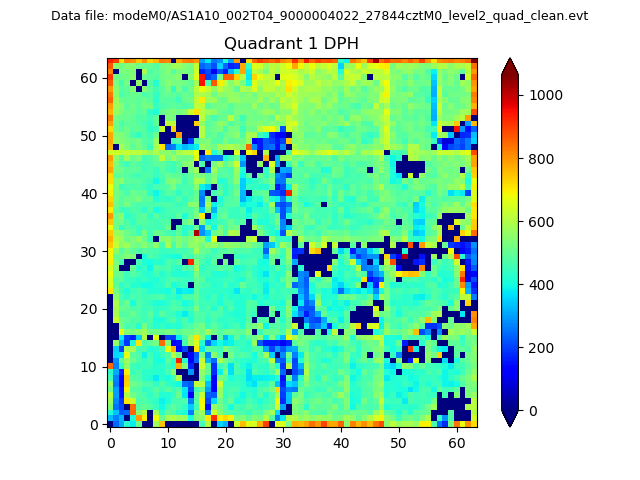 |
Quadrant B |
|---|---|---|---|
| Quadrant D | 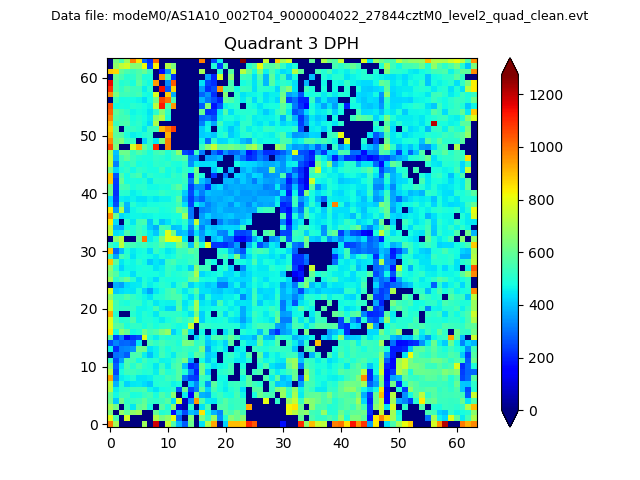 |
 |
Quadrant C |
| Plot type | Count rate plots | Images |
|---|---|---|
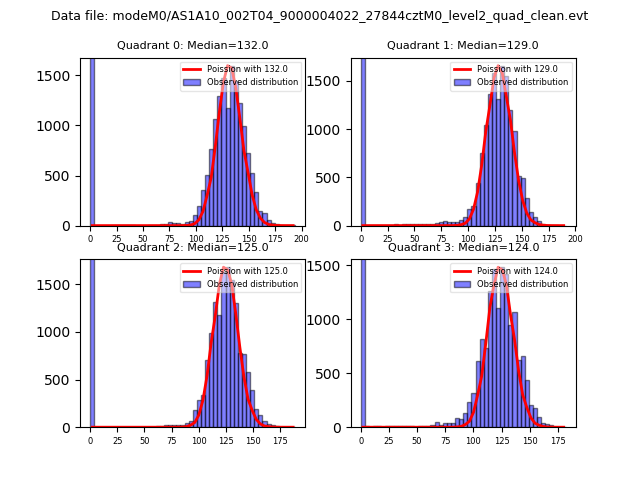
| Comparison with Poisson distribution Blue bars denote a histogram of data divided into 1 sec bins. Red curve is a Poisson curve with rate = median count rate of data. |
 |
 |
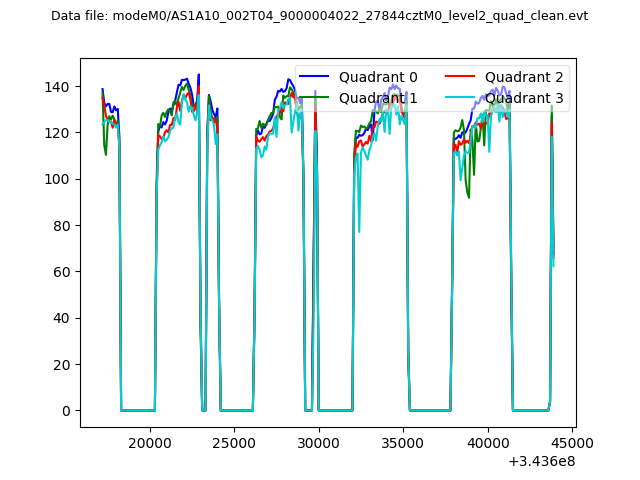
| Quadrant-wise count rates Data is divided into 100 sec bins |
 |
|
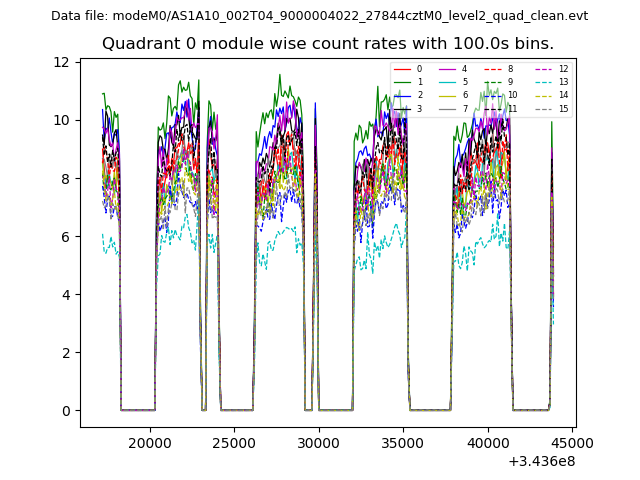
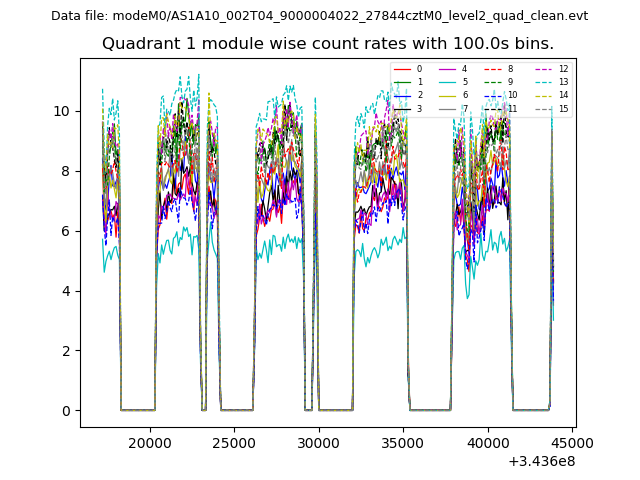
| Module-wise count rates for Quadrant A Data is divided into 100 sec bins |
 |
 |
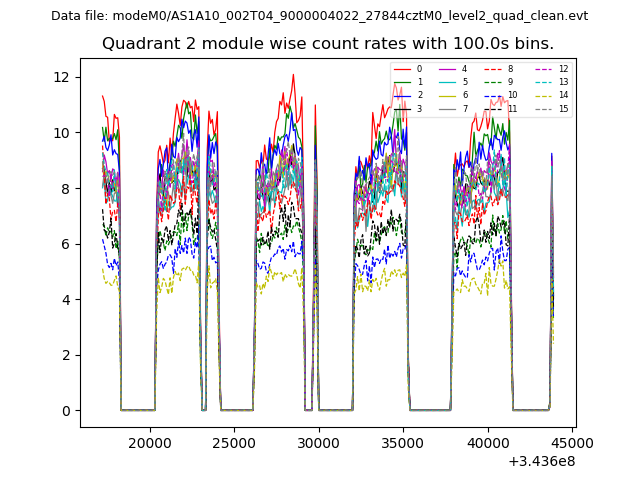
| Module-wise count rates for Quadrant B Data is divided into 100 sec bins |
 |
 |
| Module-wise count rates for Quadrant C Data is divided into 100 sec bins |
 |
 |
| Module-wise count rates for Quadrant D Data is divided into 100 sec bins |
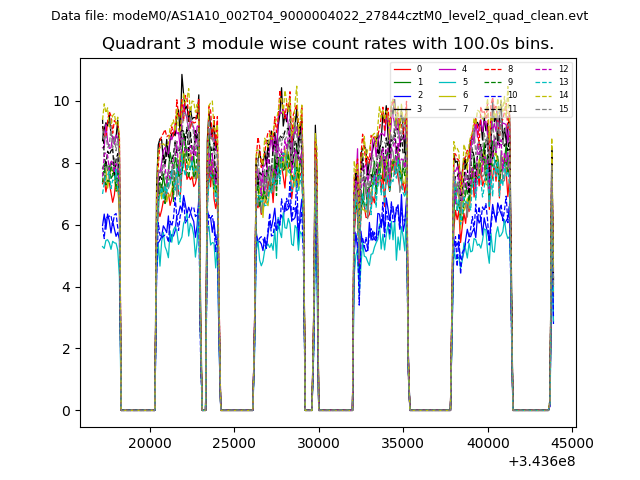 |
 |
| Parameter | Plot |
|---|---|
| CZT HV Monitor | 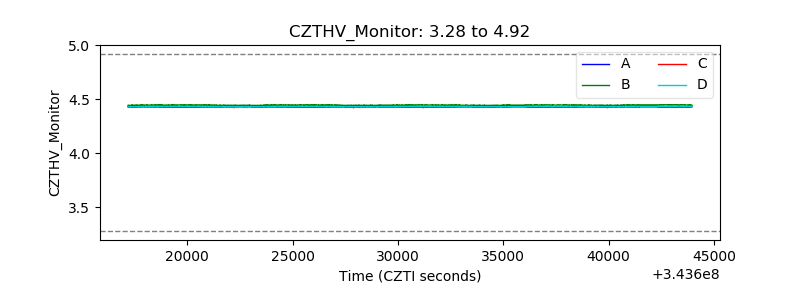 |
| D_VDD | 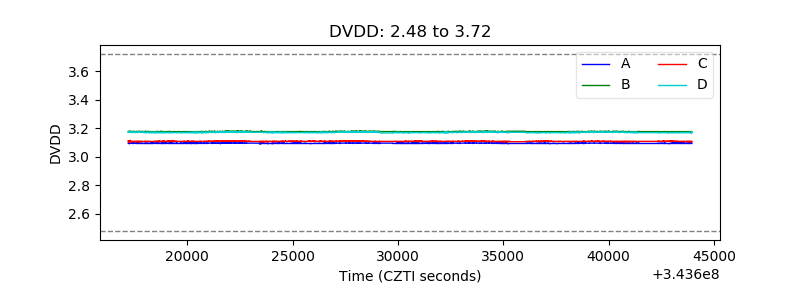 |
| Temperature 1 |  |
| Veto HV Monitor | 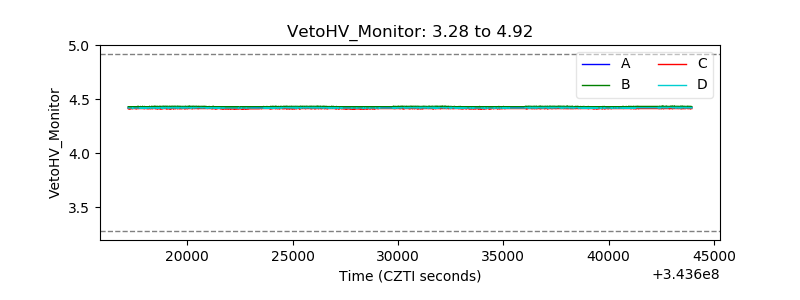 |
| Veto LLD | 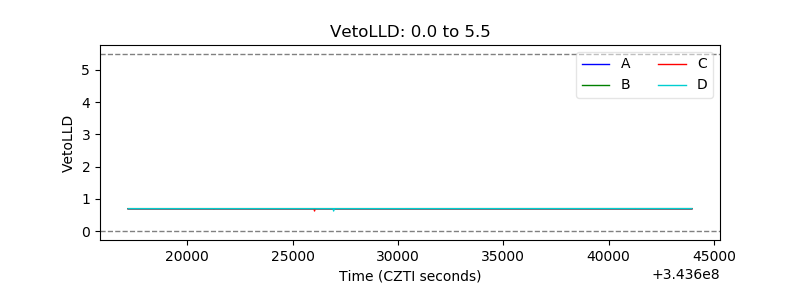 |
| Alpha Counter | 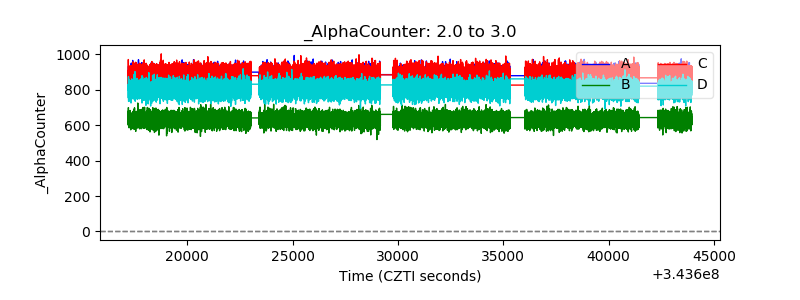 |
| _CPM_Rate | 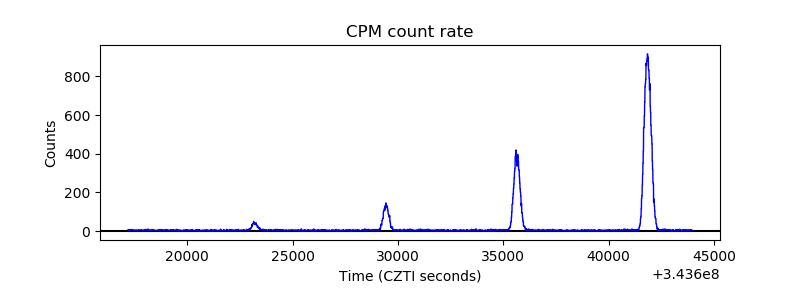 |
| CZT Counter | 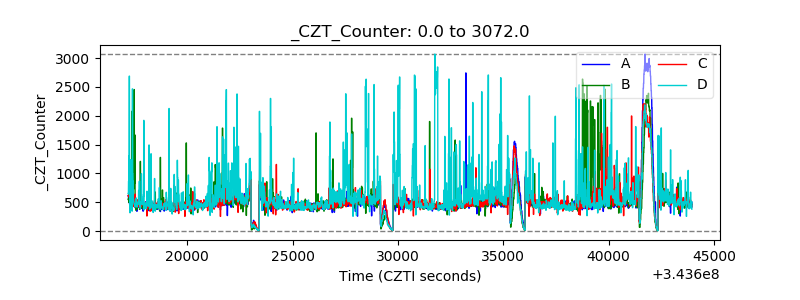 |
| +2.5 Volts monitor | 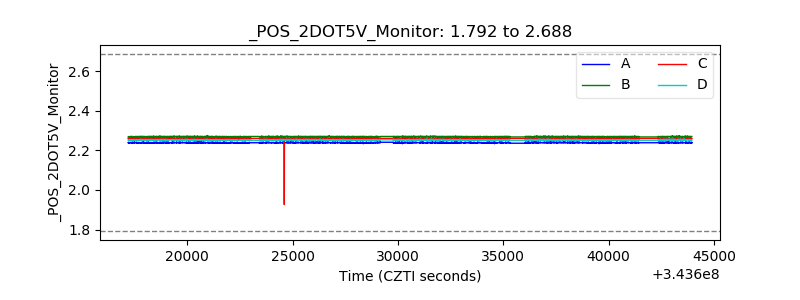 |
| +5 Volts monitor |  |
| _ROLL_ROT |  |
| _Roll_DEC | 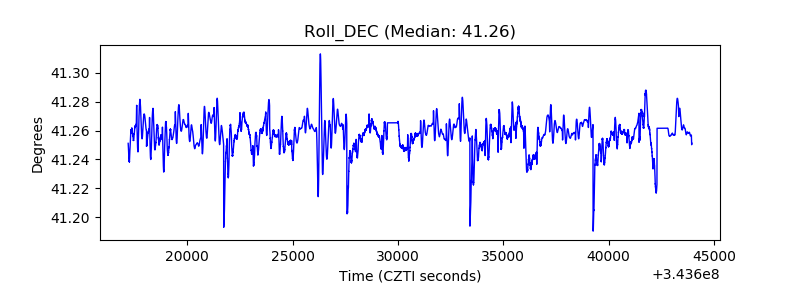 |
| _Roll_RA | 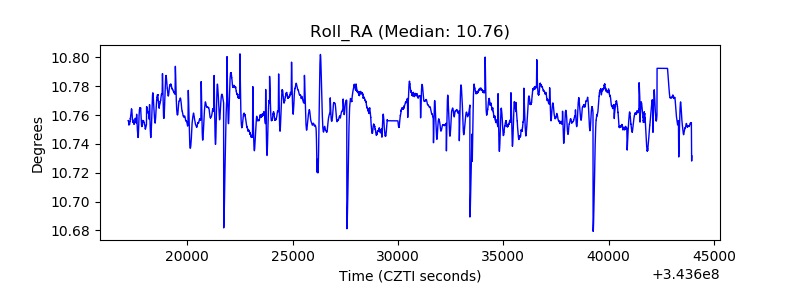 |
| Veto Counter | 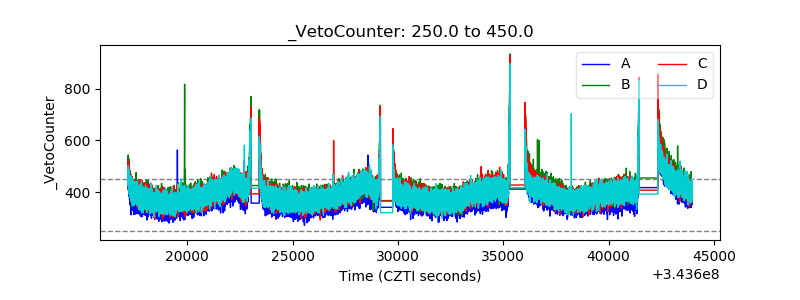 |