| Param | Original file | Final file |
|---|---|---|
| Filename | modeM0/AS1A10_002T04_9000004022_27847cztM0_level2.evt | modeM0/AS1A10_002T04_9000004022_27847cztM0_level2_quad_clean.evt |
| Size (bytes) | 481,754,880 | 96,696,000 |
| Size | 459.4 MB | 92.2 MB |
| Events in quadrant A | 3,405,817 | 644,525 |
| Events in quadrant B | 3,451,561 | 636,892 |
| Events in quadrant C | 3,339,261 | 600,622 |
| Events in quadrant D | 3,955,887 | 596,744 |
| Mode M9 | |||
|---|---|---|---|
| Quadrant | BADHDUFLAG | Total packets | Discarded packets |
| A | 0 | 12 | 0 |
| B | 0 | 12 | 0 |
| C | 0 | 12 | 0 |
| D | 0 | 12 | 0 |
| Mode M0 | |||
|---|---|---|---|
| Quadrant | BADHDUFLAG | Total packets | Discarded packets |
| A | 0 | 14217 | 0 |
| B | 0 | 14425 | 0 |
| C | 0 | 13909 | 0 |
| D | 0 | 15904 | 0 |
| Quadrant | Total seconds | Saturated seconds | Saturation percentage |
|---|---|---|---|
| A | 6447 | 67 | 1.039243% |
| B | 6448 | 67 | 1.039082% |
| C | 6448 | 90 | 1.395782% |
| D | 6447 | 144 | 2.233597% |
Noise dominated data is calculated using 1-second bins in cleaned event files. If a bin has >2000 counts, and if more than 50% of those come from <1% of pixels, then it is considered to be noise-dominated and hence unusable.
| Quadrant | # 1 sec bins | Bins with >0 counts | Bins with >2000 counts | High rate bins dominated by noise | Noise dominated (total time) | Noise dominated (detector-on time) | Marked lightcurve |
|---|---|---|---|---|---|---|---|
| A | 7597 | 6447 | 6 | 6 | 0.08% | 0.09% | 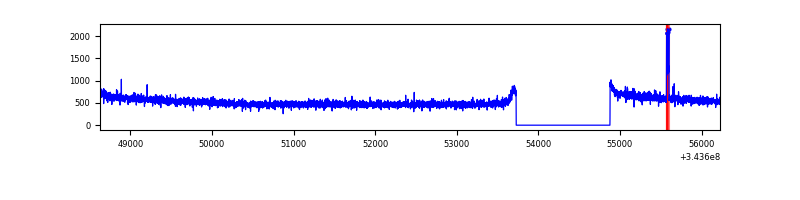 |
| B | 7598 | 6448 | 0 | 0 | 0.00% | 0.00% | 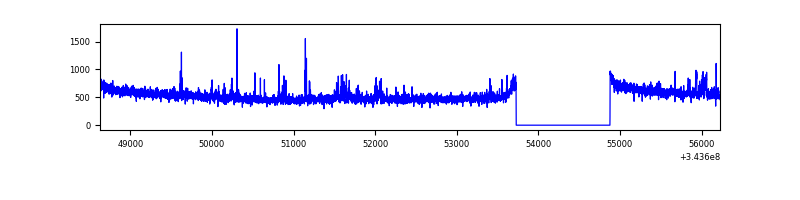 |
| C | 7598 | 6448 | 0 | 0 | 0.00% | 0.00% | 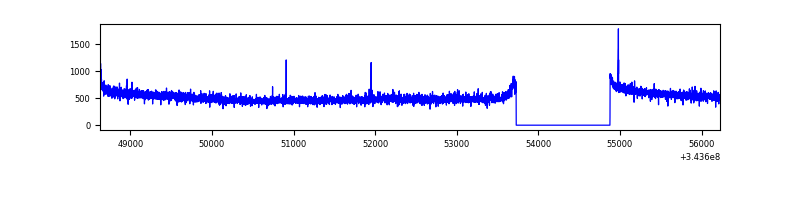 |
| D | 7597 | 6447 | 89 | 89 | 1.17% | 1.38% | 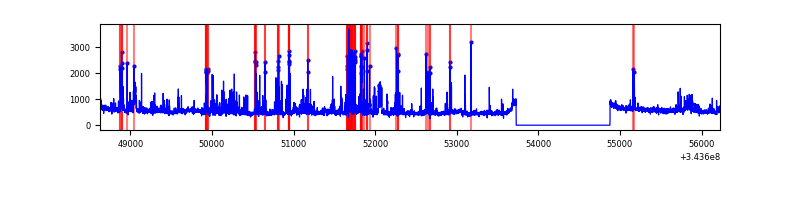 |
Top three noisy pixels from each quadrant. If the there are fewer than three noisy pixels in the level2.evt file, extra rows are filled as -1
| Pixel properties | Quadrant properties | ||||||
|---|---|---|---|---|---|---|---|
| Quadrant | DetID | PixID | Counts | Sigma | Mean | Median | Sigma |
| A | 6 | 16 | 36181 | 202.52 | 874 | 856 | 174.4 |
| A | 13 | 254 | 12045 | 64.15 | 874 | 856 | 174.4 |
| A | 3 | 137 | 7822 | 39.94 | 874 | 856 | 174.4 |
| B | 0 | 190 | 64635 | 395.78 | 852 | 834 | 161.2 |
| B | 4 | 80 | 32899 | 198.91 | 852 | 834 | 161.2 |
| B | 12 | 111 | 19403 | 115.19 | 852 | 834 | 161.2 |
| C | 14 | 238 | 132401 | 693.34 | 814 | 821 | 189.8 |
| C | 3 | 233 | 22298 | 113.17 | 814 | 821 | 189.8 |
| C | 10 | 22 | 6686 | 30.9 | 814 | 821 | 189.8 |
| D | 1 | 52 | 620154 | 3216.66 | 829 | 810 | 192.5 |
| D | 2 | 250 | 85422 | 439.45 | 829 | 810 | 192.5 |
| D | 13 | 104 | 78272 | 402.31 | 829 | 810 | 192.5 |
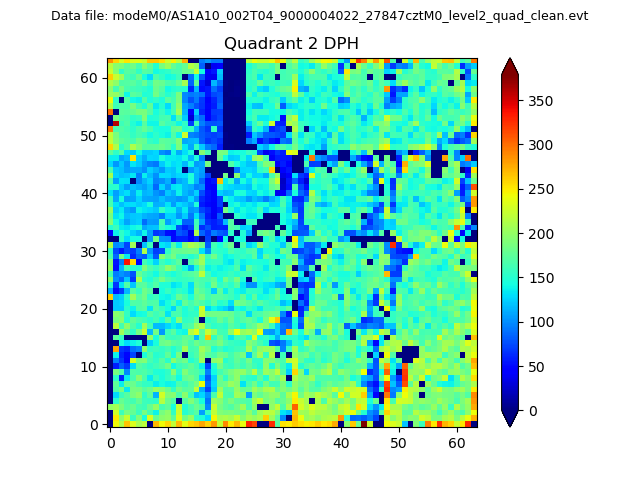
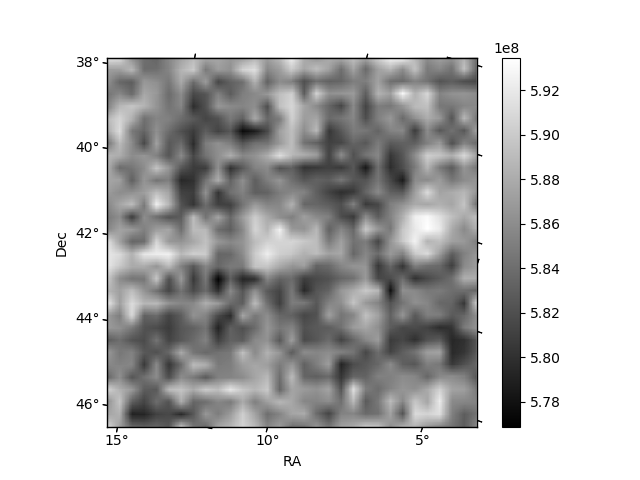
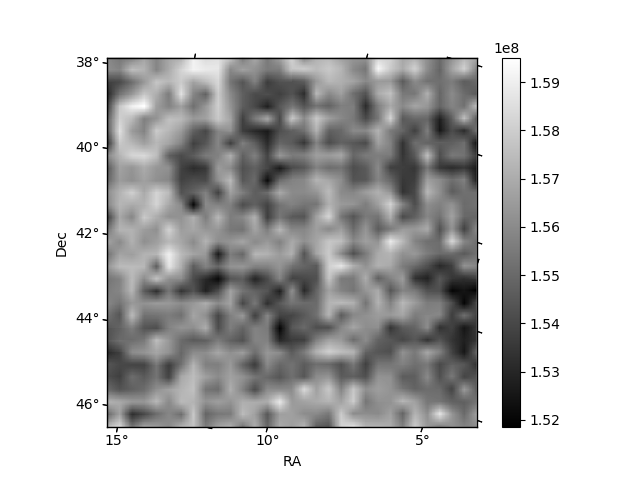
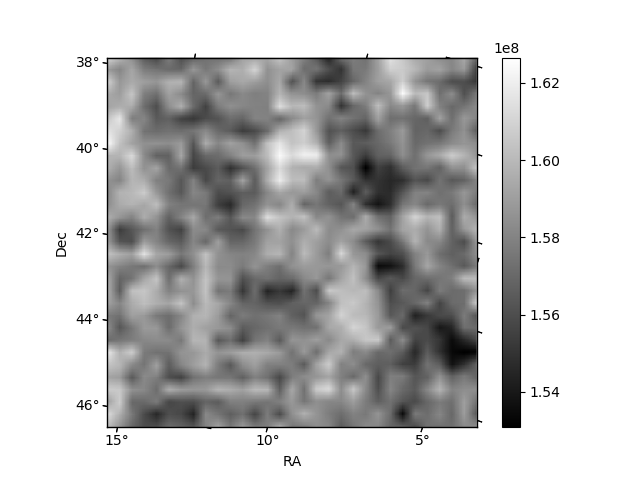
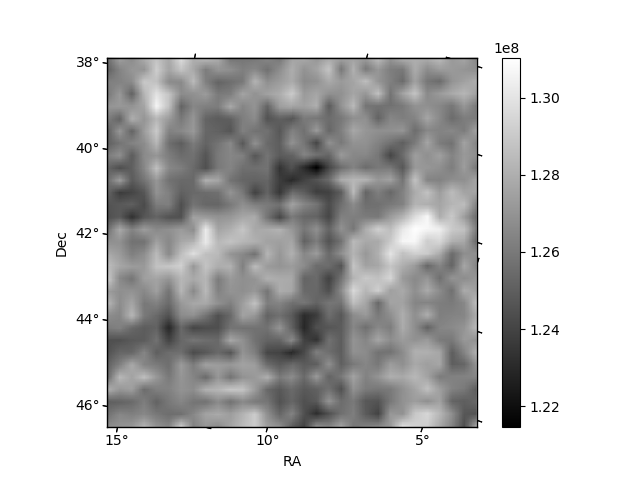
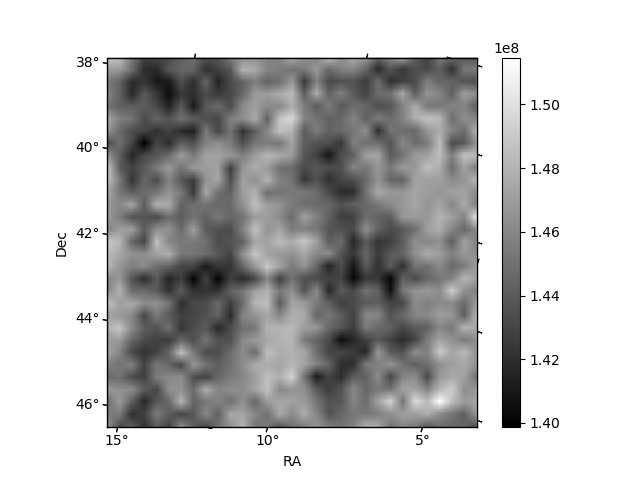
Histogram calculated using DETX and DETY for each event in the final _common_clean file
| Quadrant A | 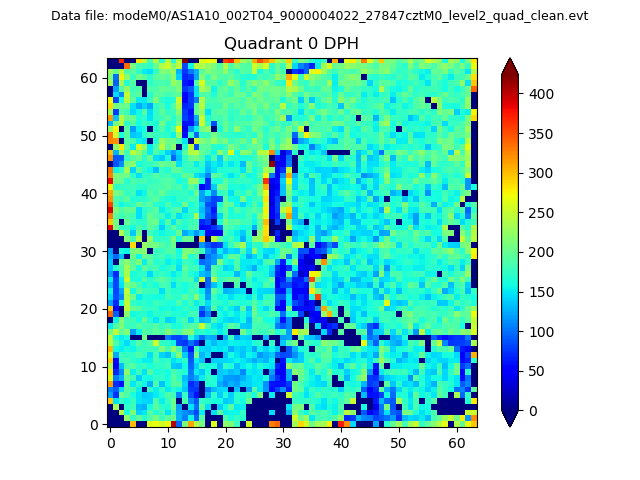 |
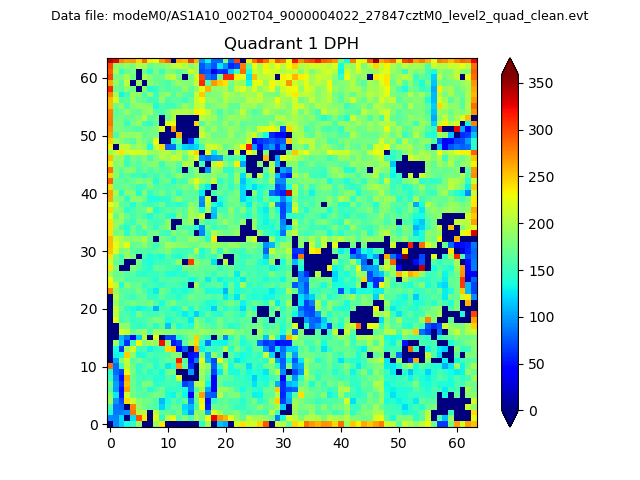 |
Quadrant B |
|---|---|---|---|
| Quadrant D | 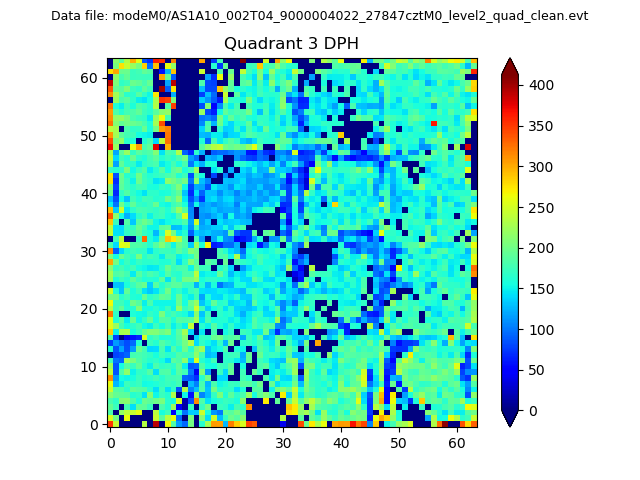 |
 |
Quadrant C |
| Plot type | Count rate plots | Images |
|---|---|---|
| Comparison with Poisson distribution Blue bars denote a histogram of data divided into 1 sec bins. Red curve is a Poisson curve with rate = median count rate of data. |
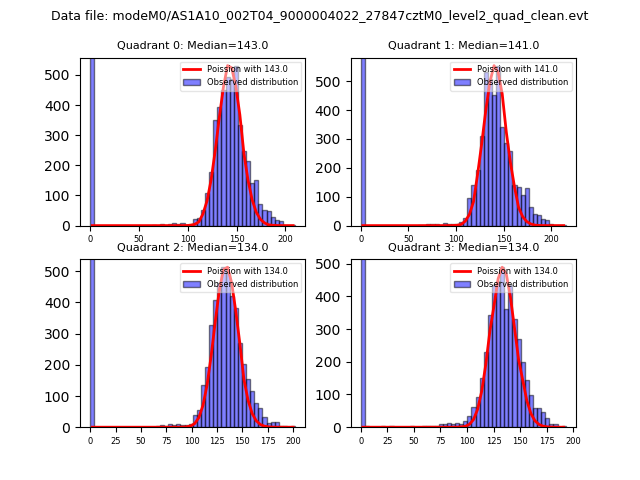 |
 |
| Quadrant-wise count rates Data is divided into 100 sec bins |
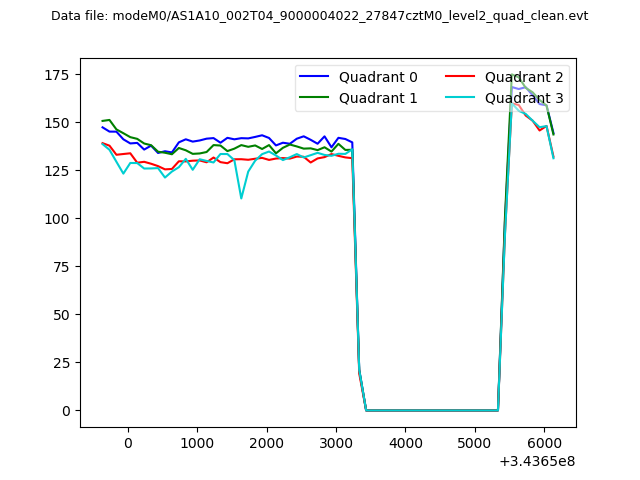 |
|
| Module-wise count rates for Quadrant A Data is divided into 100 sec bins |
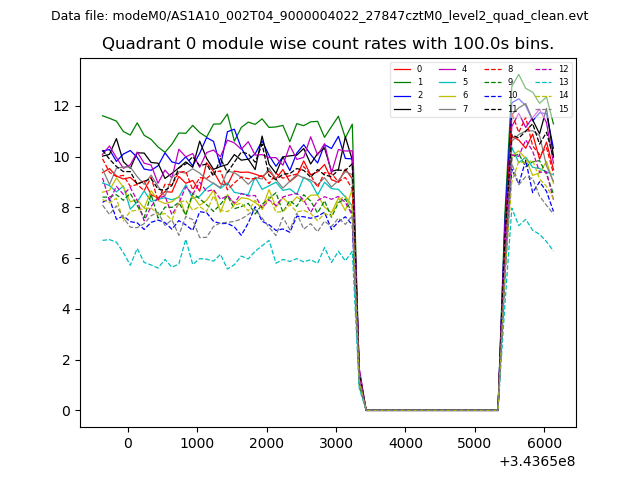 |
 |
| Module-wise count rates for Quadrant B Data is divided into 100 sec bins |
 |
 |
| Module-wise count rates for Quadrant C Data is divided into 100 sec bins |
 |
 |
| Module-wise count rates for Quadrant D Data is divided into 100 sec bins |
 |
 |
| Parameter | Plot |
|---|---|
| CZT HV Monitor |  |
| D_VDD |  |
| Temperature 1 | 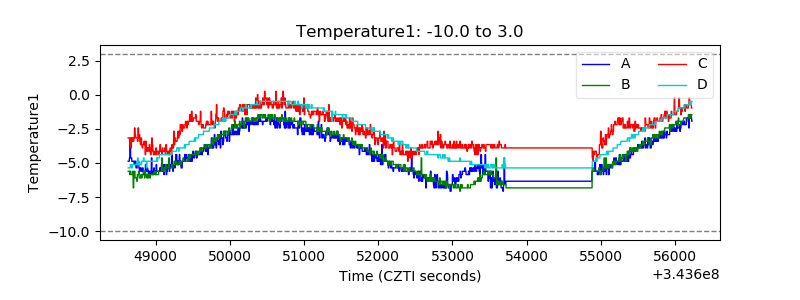 |
| Veto HV Monitor | 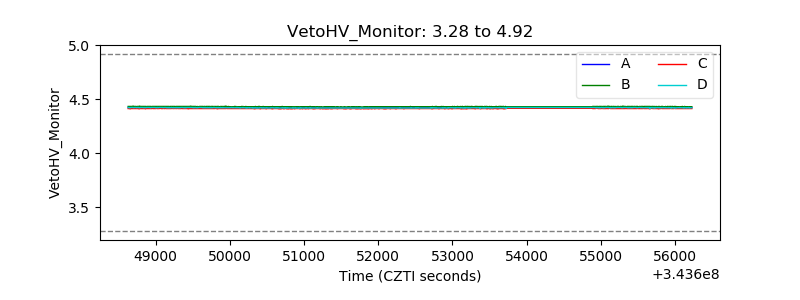 |
| Veto LLD |  |
| Alpha Counter | 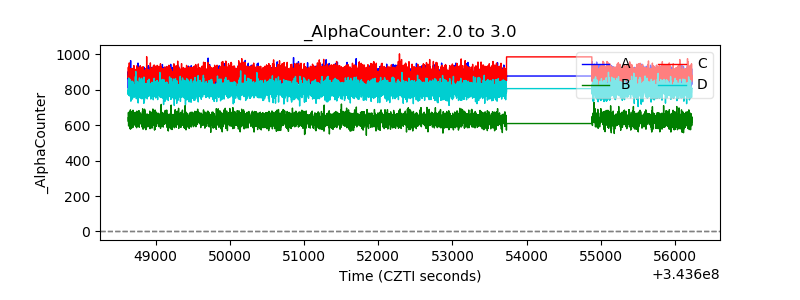 |
| _CPM_Rate | 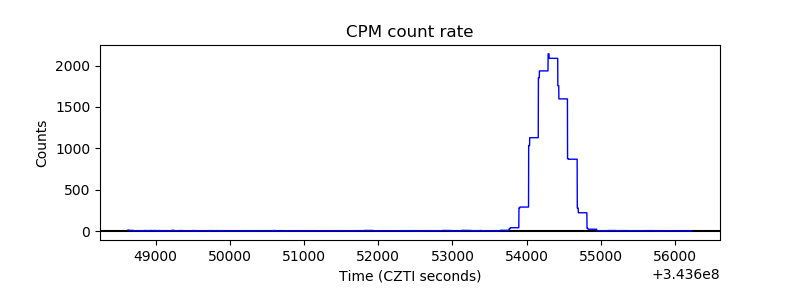 |
| CZT Counter | 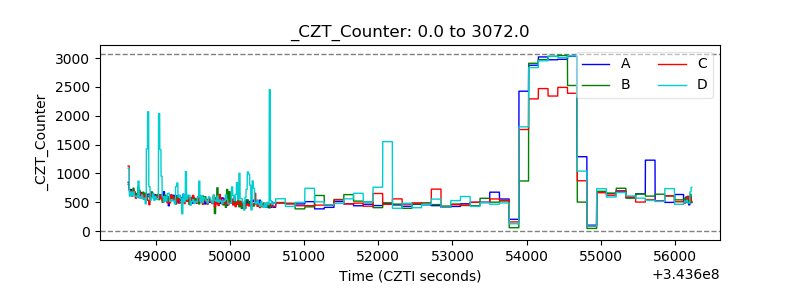 |
| +2.5 Volts monitor |  |
| +5 Volts monitor |  |
| _ROLL_ROT |  |
| _Roll_DEC | 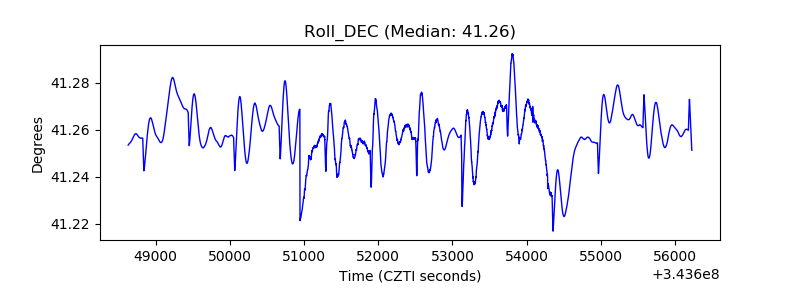 |
| _Roll_RA | 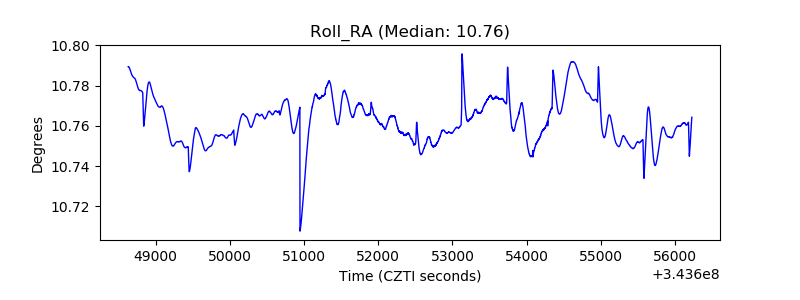 |
| Veto Counter |  |