| Param | Original file | Final file |
|---|---|---|
| Filename | modeM0/AS1A10_002T04_9000004022_27848cztM0_level2.evt | modeM0/AS1A10_002T04_9000004022_27848cztM0_level2_quad_clean.evt |
| Size (bytes) | 484,156,800 | 114,903,360 |
| Size | 461.7 MB | 109.6 MB |
| Events in quadrant A | 3,276,595 | 799,299 |
| Events in quadrant B | 3,416,595 | 787,940 |
| Events in quadrant C | 3,191,039 | 738,058 |
| Events in quadrant D | 4,367,965 | 732,286 |
| Mode M9 | |||
|---|---|---|---|
| Quadrant | BADHDUFLAG | Total packets | Discarded packets |
| A | 0 | 12 | 0 |
| B | 0 | 12 | 0 |
| C | 0 | 12 | 0 |
| D | 0 | 12 | 0 |
| Mode M0 | |||
|---|---|---|---|
| Quadrant | BADHDUFLAG | Total packets | Discarded packets |
| A | 0 | 13471 | 0 |
| B | 0 | 13995 | 0 |
| C | 0 | 13135 | 0 |
| D | 0 | 16893 | 0 |
| Quadrant | Total seconds | Saturated seconds | Saturation percentage |
|---|---|---|---|
| A | 6048 | 98 | 1.620370% |
| B | 6048 | 109 | 1.802249% |
| C | 6049 | 132 | 2.182179% |
| D | 6049 | 206 | 3.405522% |
Noise dominated data is calculated using 1-second bins in cleaned event files. If a bin has >2000 counts, and if more than 50% of those come from <1% of pixels, then it is considered to be noise-dominated and hence unusable.
| Quadrant | # 1 sec bins | Bins with >0 counts | Bins with >2000 counts | High rate bins dominated by noise | Noise dominated (total time) | Noise dominated (detector-on time) | Marked lightcurve |
|---|---|---|---|---|---|---|---|
| A | 7268 | 6048 | 6 | 6 | 0.08% | 0.10% | 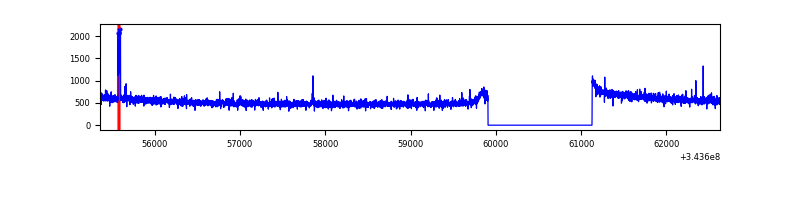 |
| B | 7268 | 6048 | 13 | 13 | 0.18% | 0.21% | 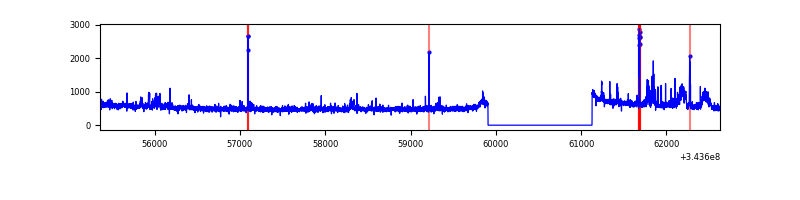 |
| C | 7269 | 6049 | 0 | 0 | 0.00% | 0.00% |  |
| D | 7269 | 6049 | 182 | 182 | 2.50% | 3.01% | 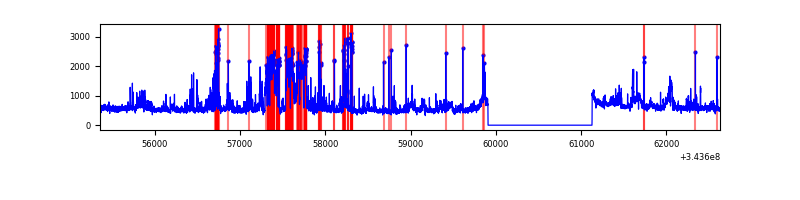 |
Top three noisy pixels from each quadrant. If the there are fewer than three noisy pixels in the level2.evt file, extra rows are filled as -1
| Pixel properties | Quadrant properties | ||||||
|---|---|---|---|---|---|---|---|
| Quadrant | DetID | PixID | Counts | Sigma | Mean | Median | Sigma |
| A | 6 | 16 | 43017 | 253.68 | 838 | 824 | 166.3 |
| A | 13 | 254 | 10767 | 59.78 | 838 | 824 | 166.3 |
| A | 3 | 137 | 7248 | 38.62 | 838 | 824 | 166.3 |
| B | 0 | 190 | 91346 | 596.84 | 810 | 793 | 151.7 |
| B | 10 | 245 | 56718 | 368.61 | 810 | 793 | 151.7 |
| B | 15 | 32 | 36890 | 237.92 | 810 | 793 | 151.7 |
| C | 14 | 238 | 127341 | 706.9 | 778 | 785 | 179.0 |
| C | 3 | 233 | 14797 | 78.27 | 778 | 785 | 179.0 |
| C | 6 | 112 | 7861 | 39.52 | 778 | 785 | 179.0 |
| D | 1 | 52 | 1008135 | 5414.41 | 798 | 778 | 186.1 |
| D | 13 | 104 | 164351 | 879.18 | 798 | 778 | 186.1 |
| D | 2 | 250 | 135373 | 723.43 | 798 | 778 | 186.1 |
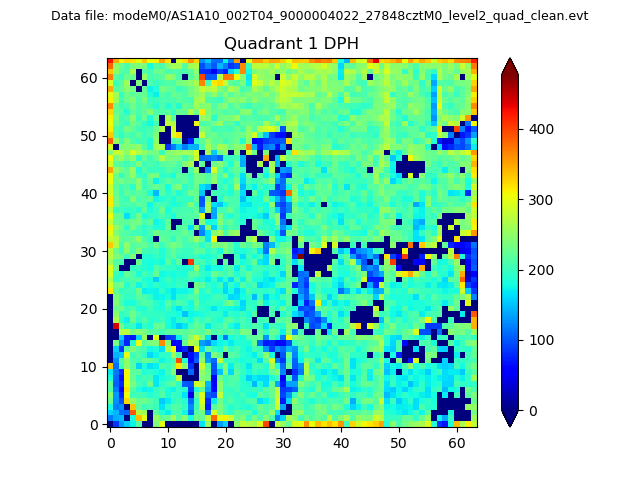
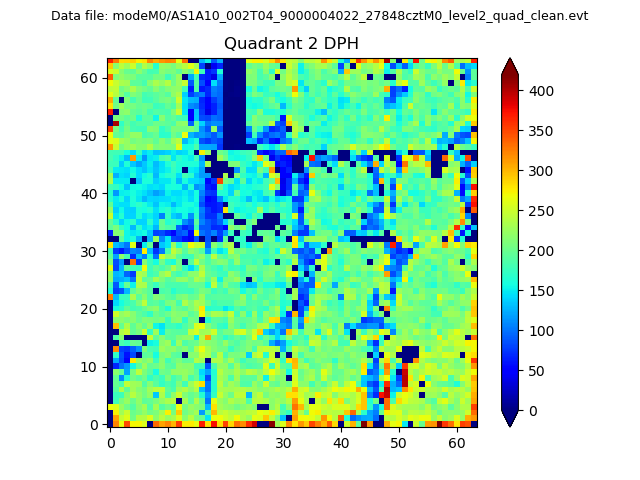
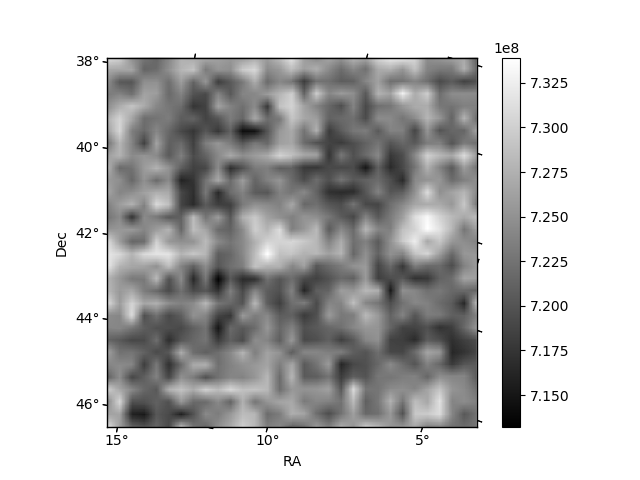
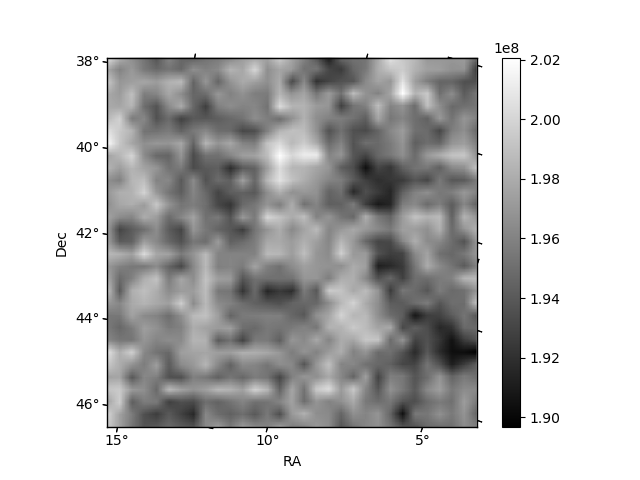
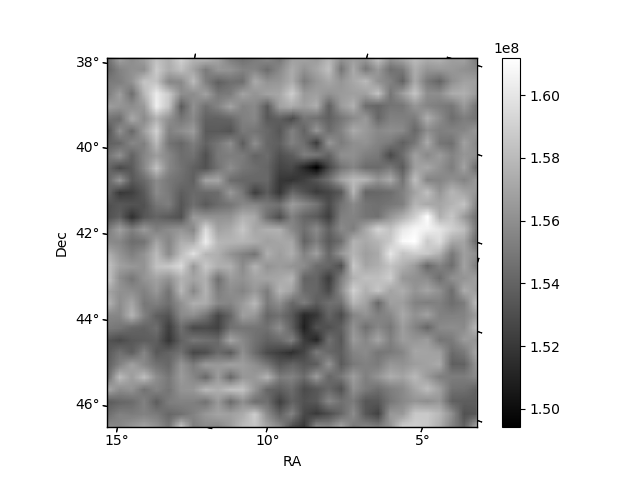
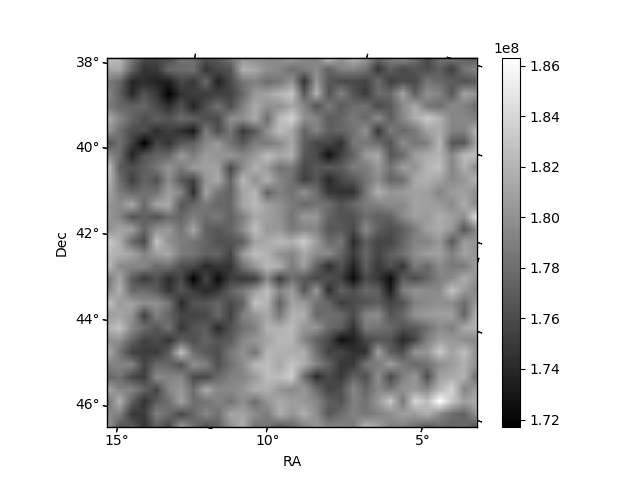
Histogram calculated using DETX and DETY for each event in the final _common_clean file
| Quadrant A | 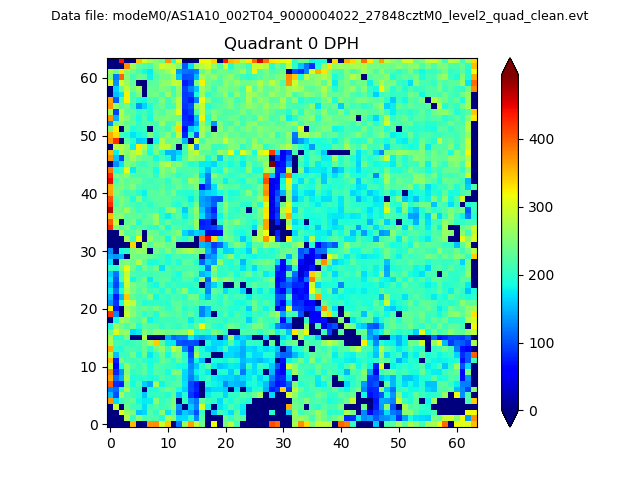 |
 |
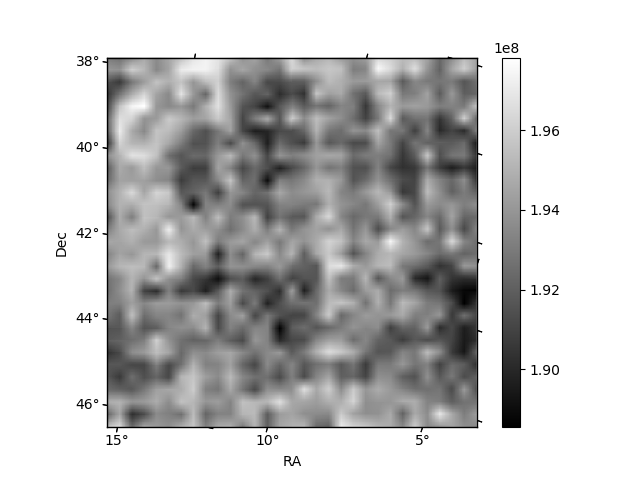
Quadrant B |
|---|---|---|---|
| Quadrant D | 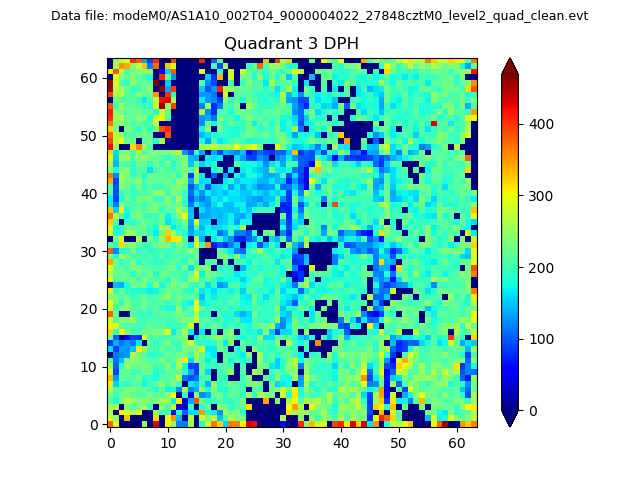 |
 |
Quadrant C |
| Plot type | Count rate plots | Images |
|---|---|---|
| Comparison with Poisson distribution Blue bars denote a histogram of data divided into 1 sec bins. Red curve is a Poisson curve with rate = median count rate of data. |
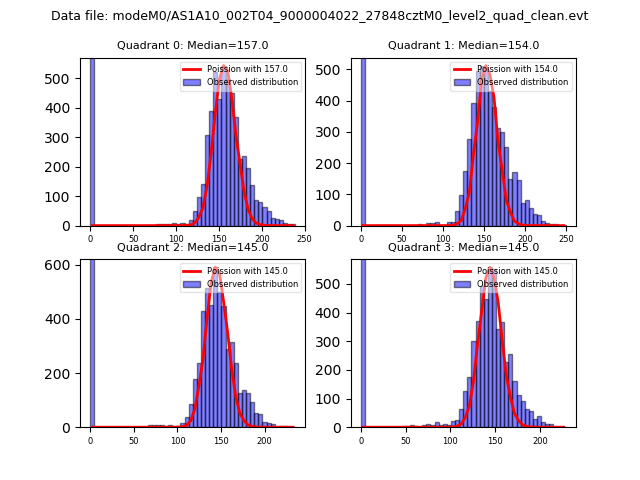 |
 |
| Quadrant-wise count rates Data is divided into 100 sec bins |
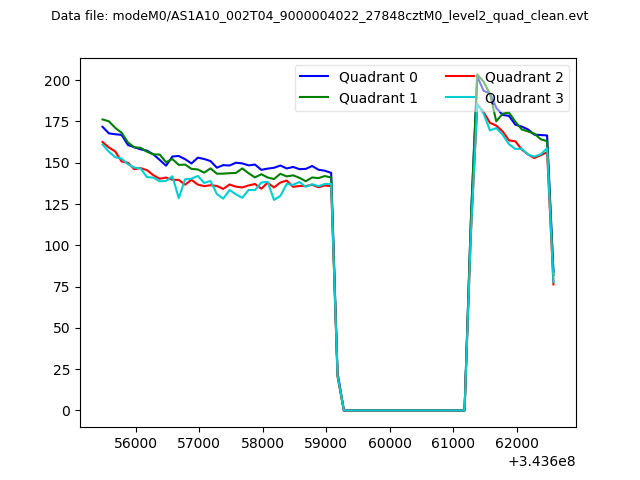 |
|
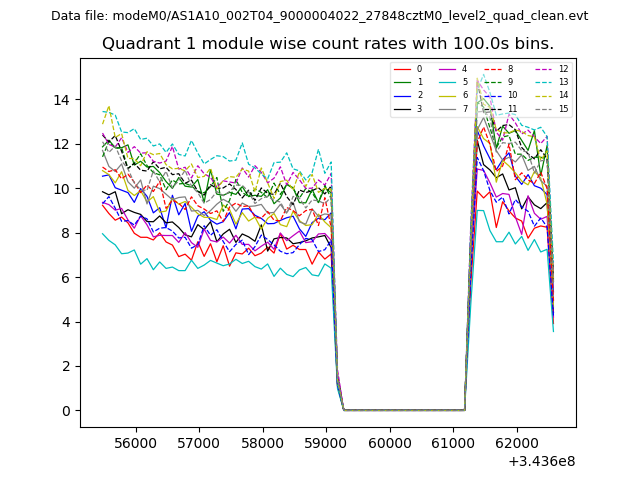
| Module-wise count rates for Quadrant A Data is divided into 100 sec bins |
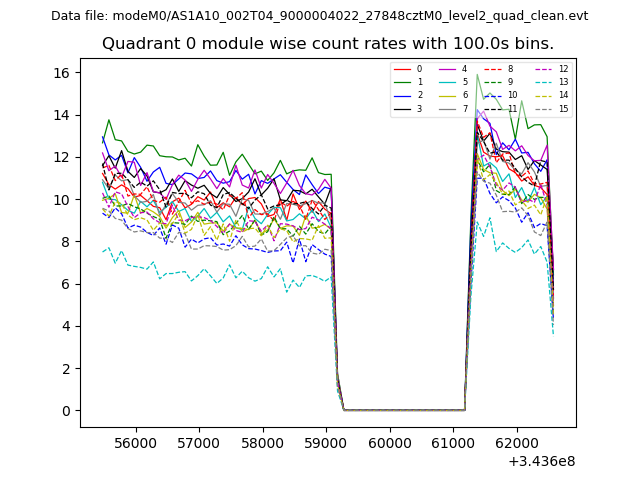 |
 |
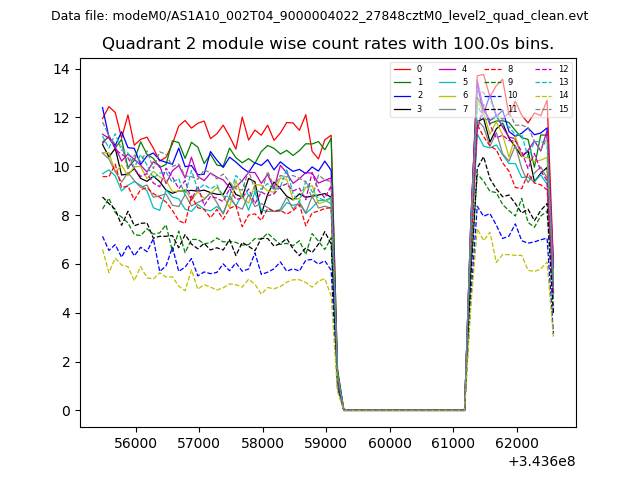
| Module-wise count rates for Quadrant B Data is divided into 100 sec bins |
 |
 |
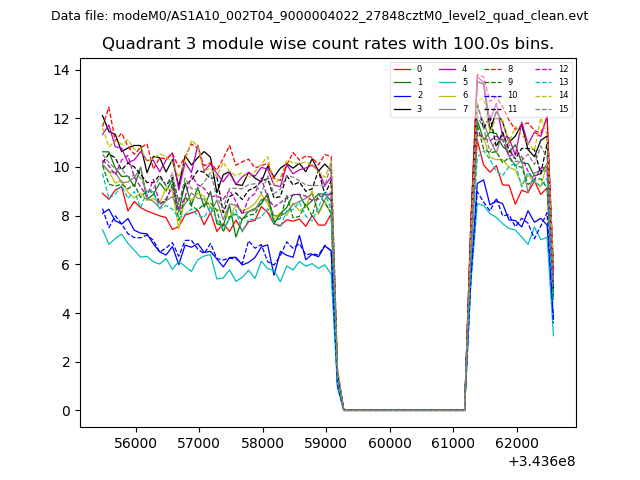
| Module-wise count rates for Quadrant C Data is divided into 100 sec bins |
 |
 |
| Module-wise count rates for Quadrant D Data is divided into 100 sec bins |
 |
 |
| Parameter | Plot |
|---|---|
| CZT HV Monitor | 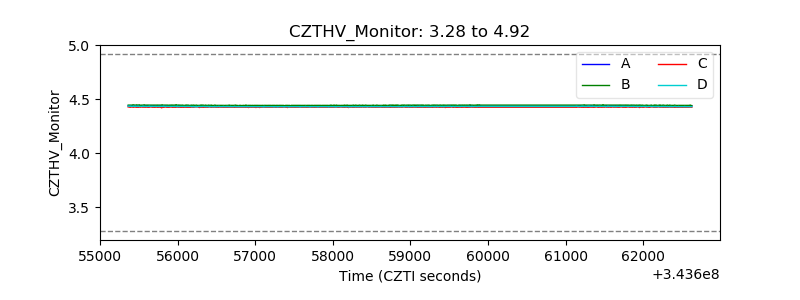 |
| D_VDD | 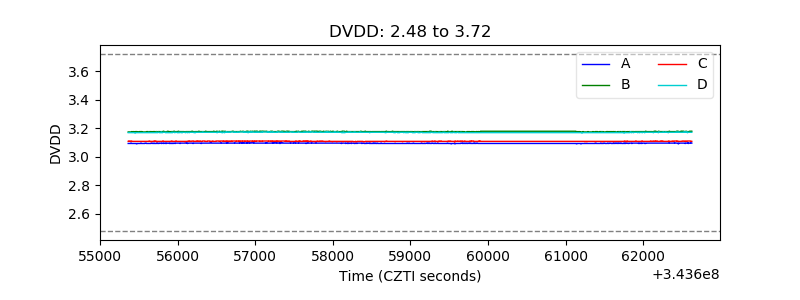 |
| Temperature 1 |  |
| Veto HV Monitor |  |
| Veto LLD | 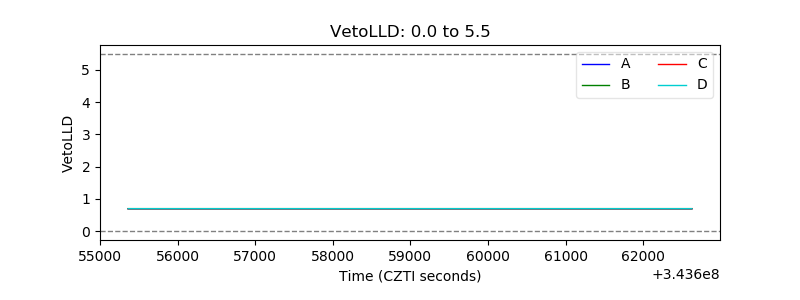 |
| Alpha Counter | 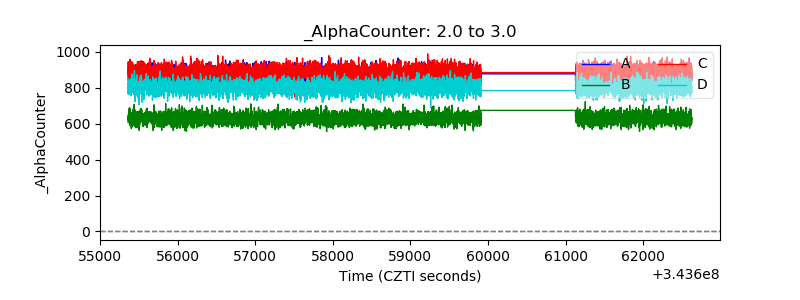 |
| _CPM_Rate | 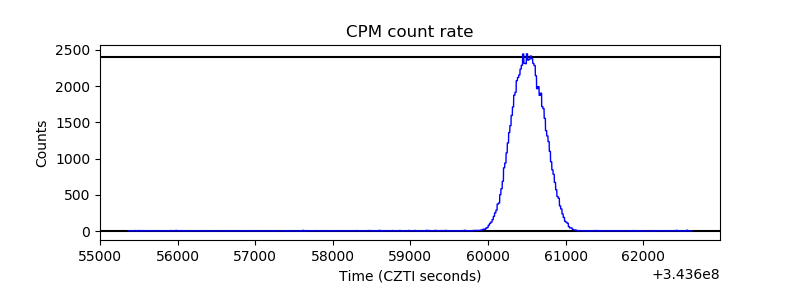 |
| CZT Counter | 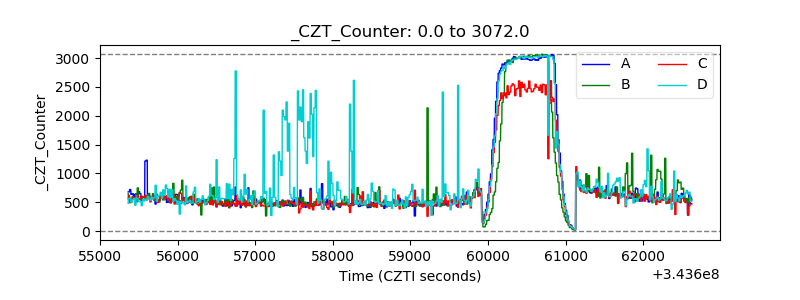 |
| +2.5 Volts monitor |  |
| +5 Volts monitor |  |
| _ROLL_ROT | 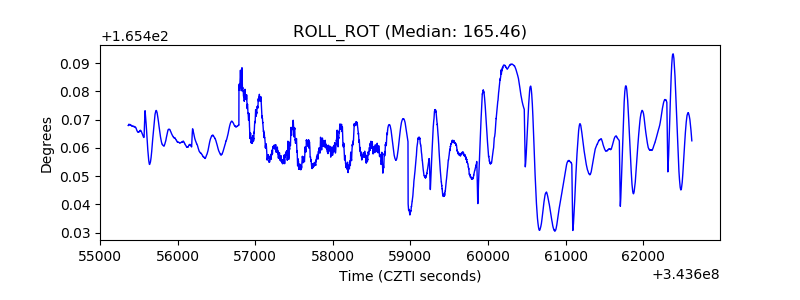 |
| _Roll_DEC | 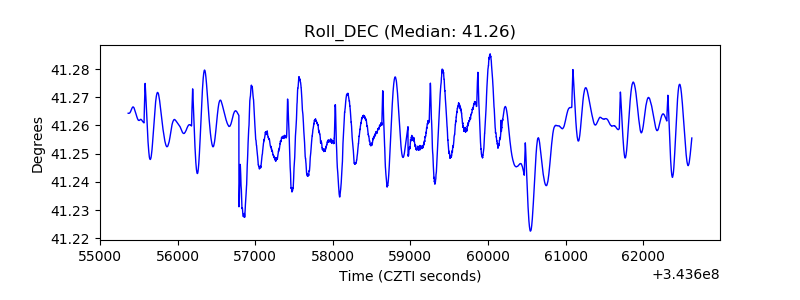 |
| _Roll_RA | 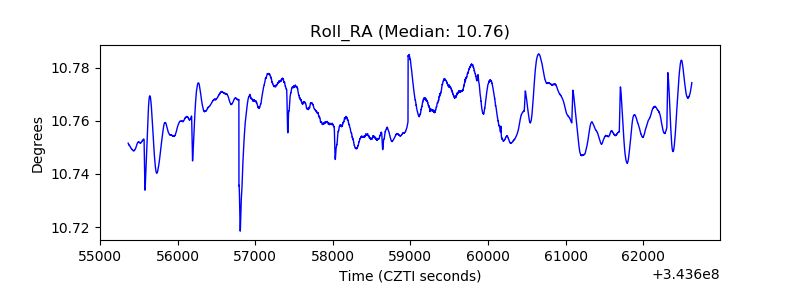 |
| Veto Counter | 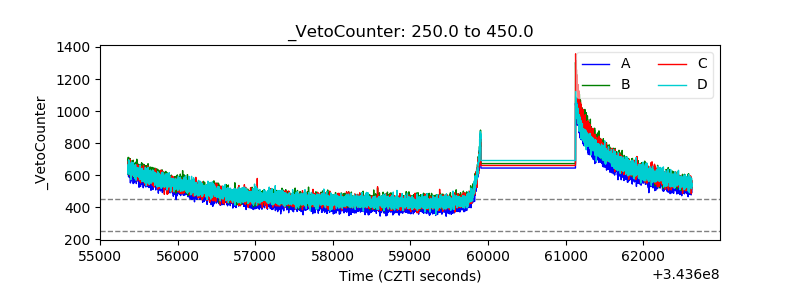 |