| Param | Original file | Final file |
|---|---|---|
| Filename | modeM0/AS1A10_002T04_9000004022_27849cztM0_level2.evt | modeM0/AS1A10_002T04_9000004022_27849cztM0_level2_quad_clean.evt |
| Size (bytes) | 481,095,360 | 118,690,560 |
| Size | 458.8 MB | 113.2 MB |
| Events in quadrant A | 3,247,897 | 831,399 |
| Events in quadrant B | 3,492,634 | 811,192 |
| Events in quadrant C | 3,215,024 | 767,571 |
| Events in quadrant D | 4,207,121 | 765,263 |
| Mode M9 | |||
|---|---|---|---|
| Quadrant | BADHDUFLAG | Total packets | Discarded packets |
| A | 0 | 14 | 0 |
| B | 0 | 14 | 0 |
| C | 0 | 14 | 0 |
| D | 0 | 14 | 0 |
| Mode M0 | |||
|---|---|---|---|
| Quadrant | BADHDUFLAG | Total packets | Discarded packets |
| A | 0 | 13339 | 0 |
| B | 0 | 14139 | 0 |
| C | 0 | 13137 | 0 |
| D | 0 | 16536 | 0 |
| Quadrant | Total seconds | Saturated seconds | Saturation percentage |
|---|---|---|---|
| A | 6013 | 69 | 1.147514% |
| B | 6014 | 86 | 1.429997% |
| C | 6013 | 94 | 1.563280% |
| D | 6013 | 135 | 2.245136% |
Noise dominated data is calculated using 1-second bins in cleaned event files. If a bin has >2000 counts, and if more than 50% of those come from <1% of pixels, then it is considered to be noise-dominated and hence unusable.
| Quadrant | # 1 sec bins | Bins with >0 counts | Bins with >2000 counts | High rate bins dominated by noise | Noise dominated (total time) | Noise dominated (detector-on time) | Marked lightcurve |
|---|---|---|---|---|---|---|---|
| A | 7318 | 6013 | 0 | 0 | 0.00% | 0.00% | 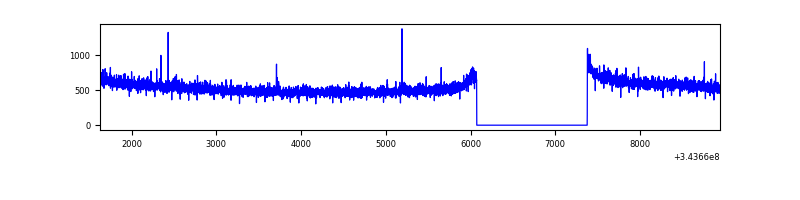 |
| B | 7319 | 6014 | 14 | 14 | 0.19% | 0.23% | 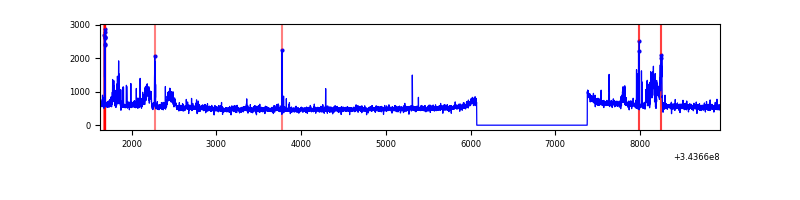 |
| C | 7318 | 6013 | 0 | 0 | 0.00% | 0.00% | 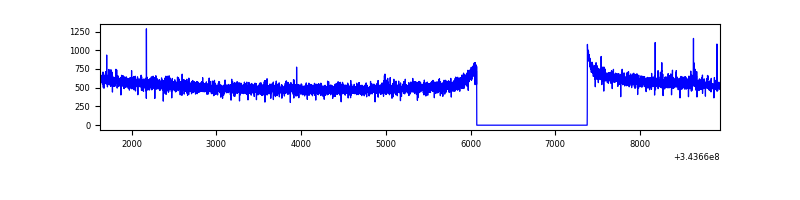 |
| D | 7318 | 6013 | 96 | 96 | 1.31% | 1.60% | 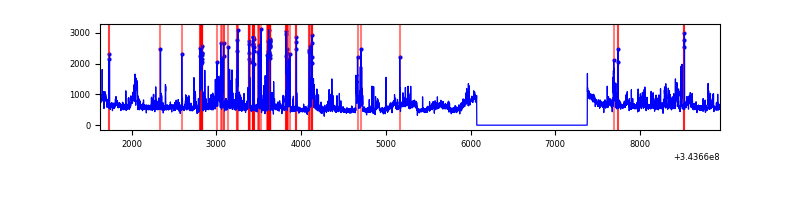 |
Top three noisy pixels from each quadrant. If the there are fewer than three noisy pixels in the level2.evt file, extra rows are filled as -1
| Pixel properties | Quadrant properties | ||||||
|---|---|---|---|---|---|---|---|
| Quadrant | DetID | PixID | Counts | Sigma | Mean | Median | Sigma |
| A | 13 | 254 | 11036 | 61.56 | 839 | 825 | 165.9 |
| A | 0 | 226 | 7381 | 39.52 | 839 | 825 | 165.9 |
| A | 3 | 137 | 7067 | 37.63 | 839 | 825 | 165.9 |
| B | 15 | 32 | 144473 | 954.38 | 812 | 794 | 150.5 |
| B | 0 | 190 | 77620 | 510.31 | 812 | 794 | 150.5 |
| B | 10 | 245 | 52012 | 340.21 | 812 | 794 | 150.5 |
| C | 14 | 238 | 128594 | 701.66 | 784 | 790 | 182.1 |
| C | 3 | 233 | 25073 | 133.31 | 784 | 790 | 182.1 |
| C | 13 | 61 | 5457 | 25.62 | 784 | 790 | 182.1 |
| D | 1 | 52 | 620412 | 3288.22 | 806 | 787 | 188.4 |
| D | 13 | 104 | 363695 | 1925.88 | 806 | 787 | 188.4 |
| D | 2 | 250 | 130156 | 686.53 | 806 | 787 | 188.4 |
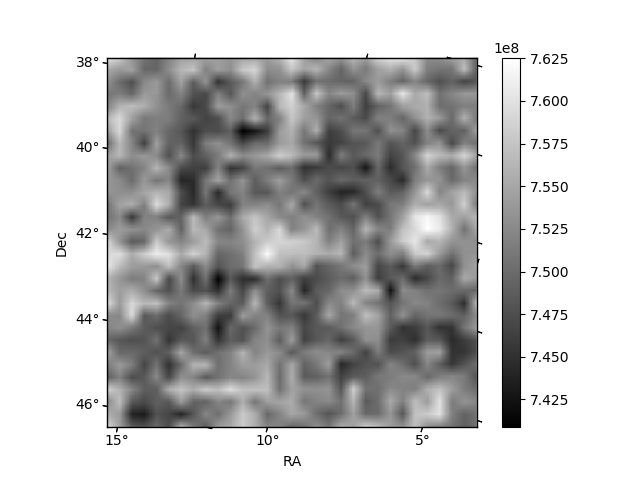
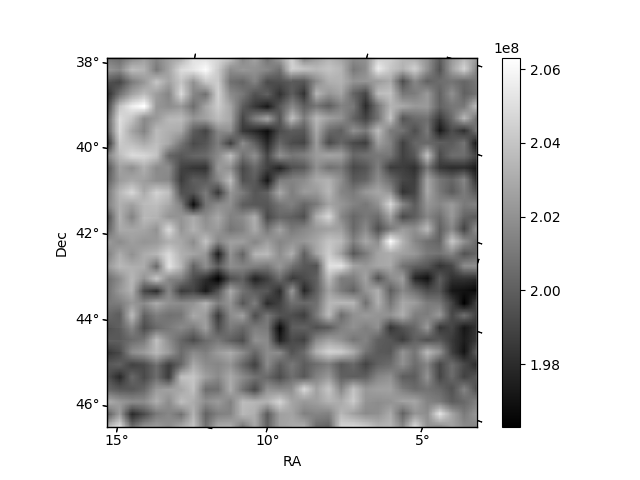
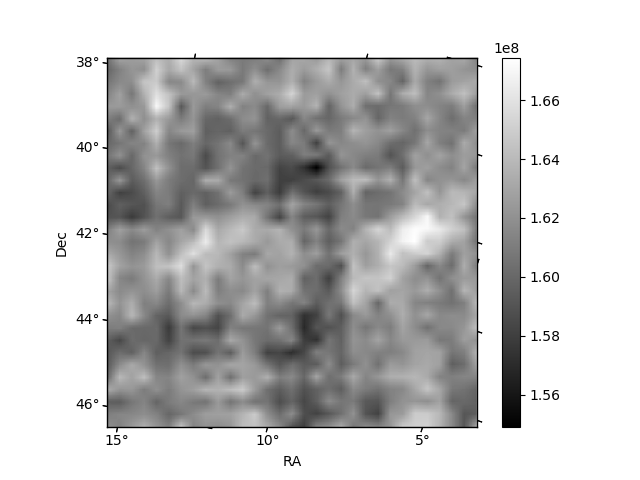
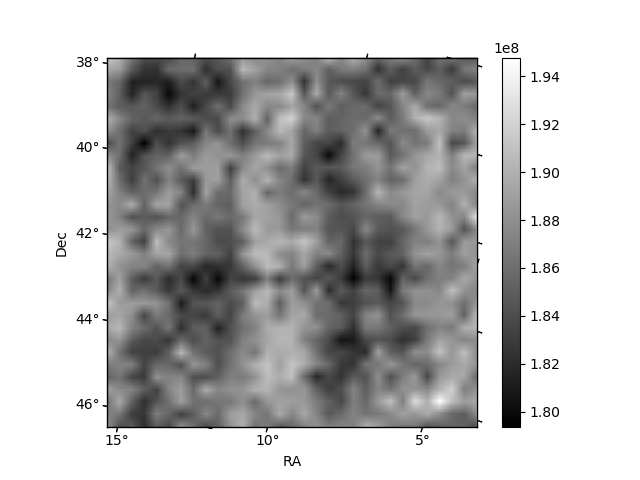
Histogram calculated using DETX and DETY for each event in the final _common_clean file
| Quadrant A | 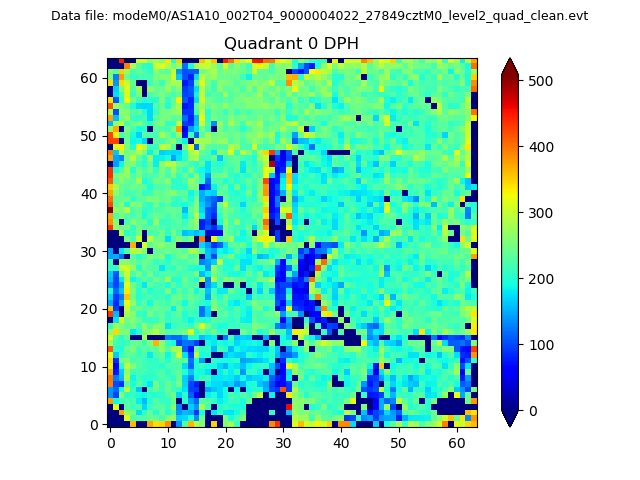 |
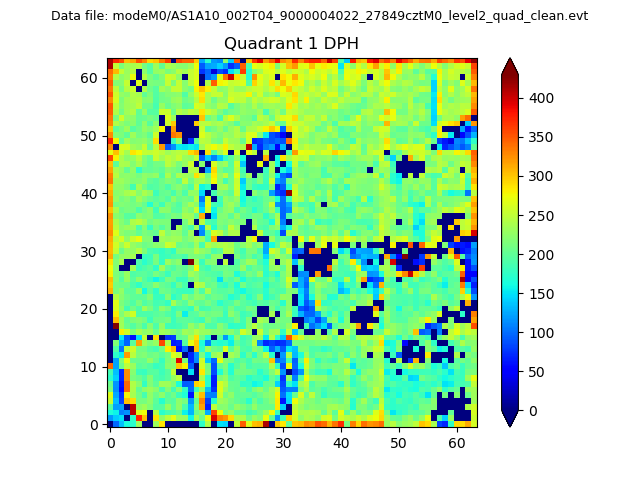 |
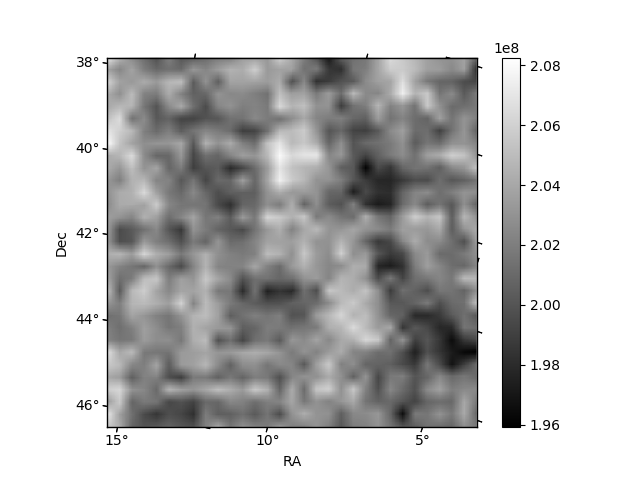
Quadrant B |
|---|---|---|---|
| Quadrant D | 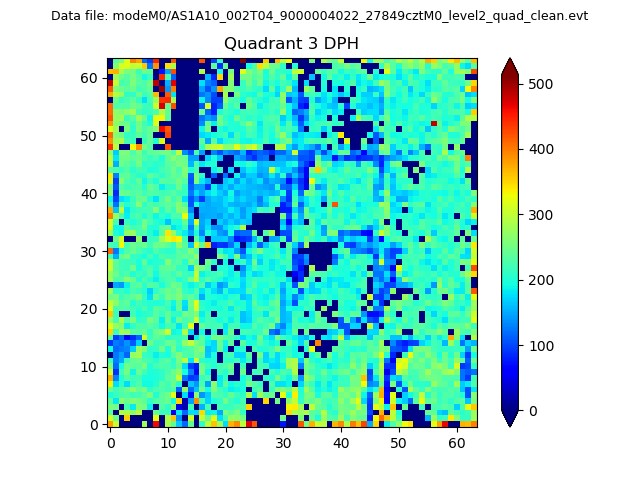 |
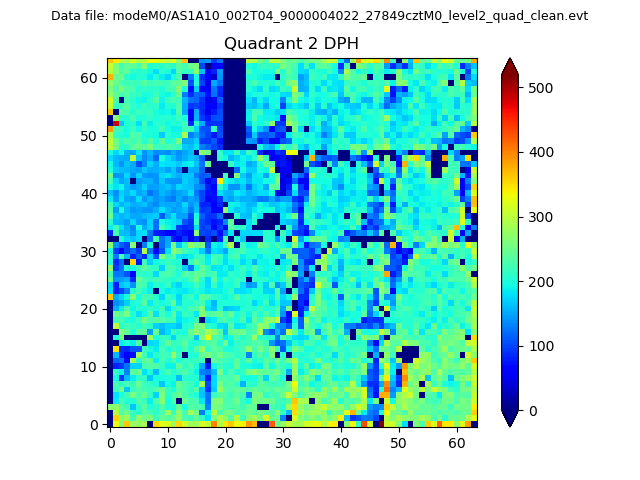 |
Quadrant C |
| Plot type | Count rate plots | Images |
|---|---|---|
| Comparison with Poisson distribution Blue bars denote a histogram of data divided into 1 sec bins. Red curve is a Poisson curve with rate = median count rate of data. |
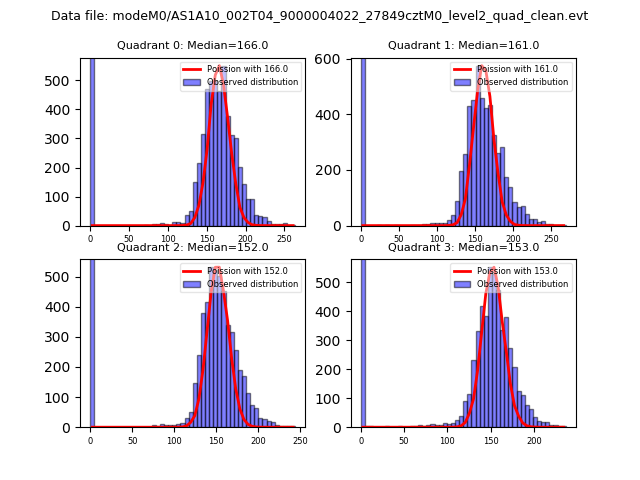 |
 |
| Quadrant-wise count rates Data is divided into 100 sec bins |
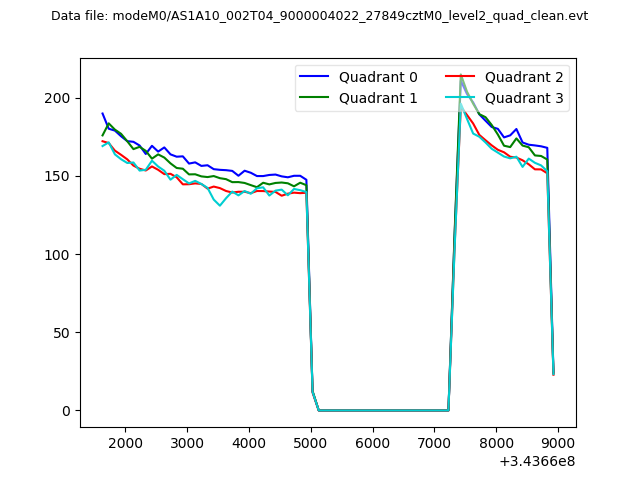 |
|
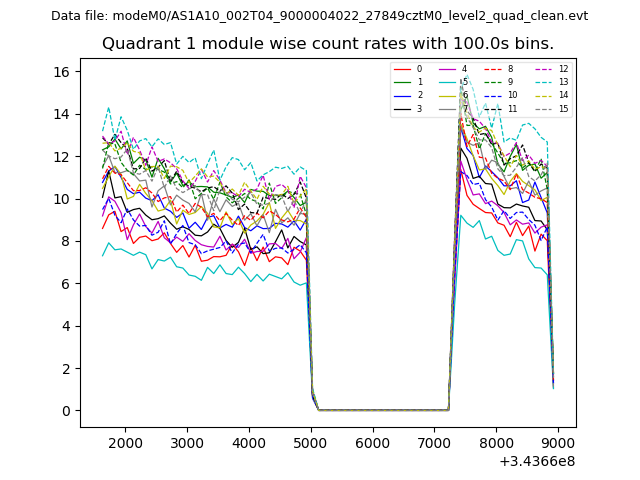
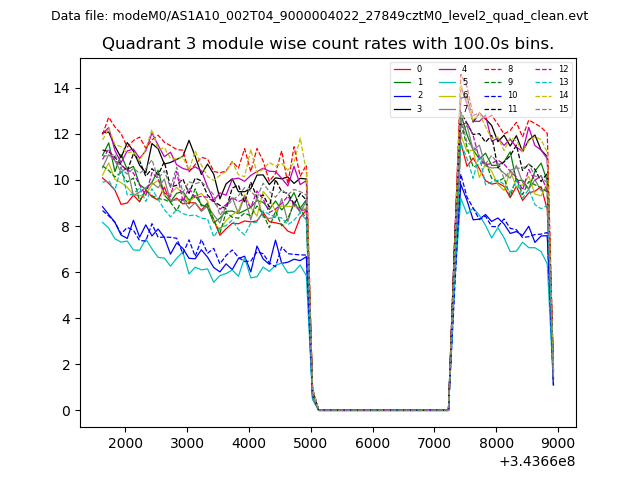
| Module-wise count rates for Quadrant A Data is divided into 100 sec bins |
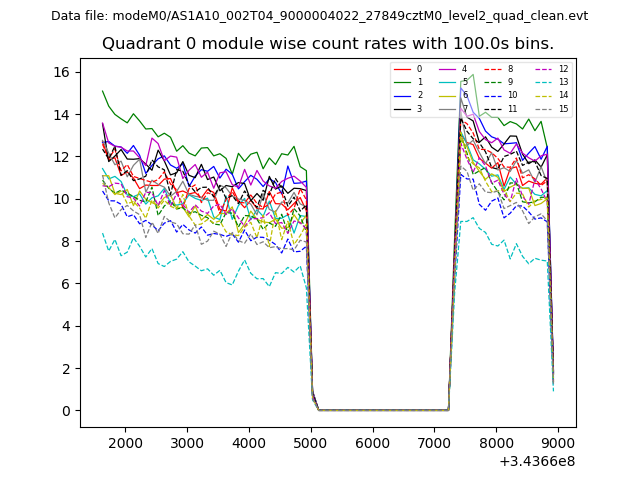 |
 |
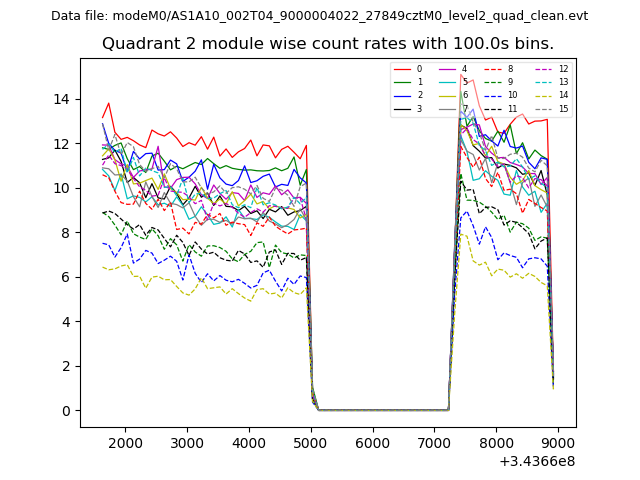
| Module-wise count rates for Quadrant B Data is divided into 100 sec bins |
 |
 |
| Module-wise count rates for Quadrant C Data is divided into 100 sec bins |
 |
 |
| Module-wise count rates for Quadrant D Data is divided into 100 sec bins |
 |
 |
| Parameter | Plot |
|---|---|
| CZT HV Monitor | 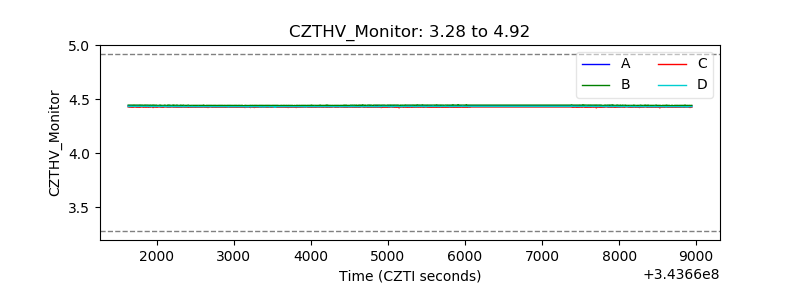 |
| D_VDD | 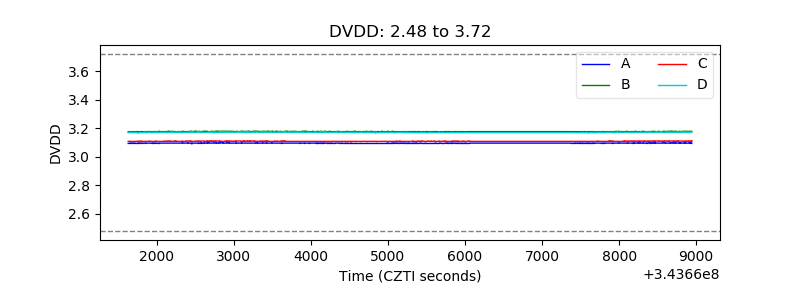 |
| Temperature 1 | 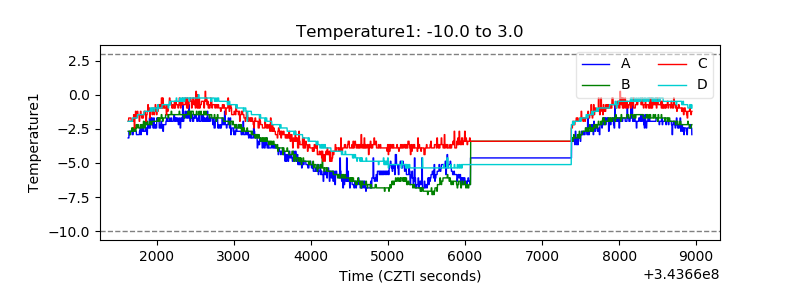 |
| Veto HV Monitor | 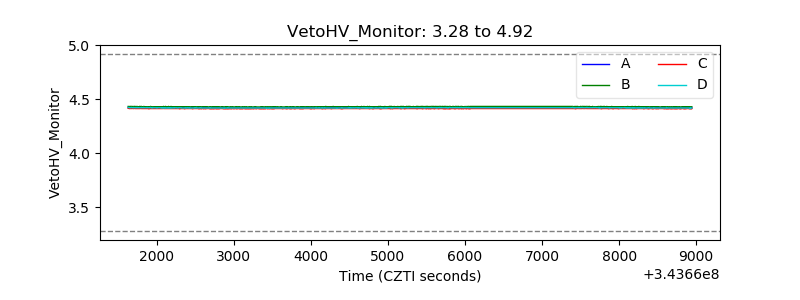 |
| Veto LLD | 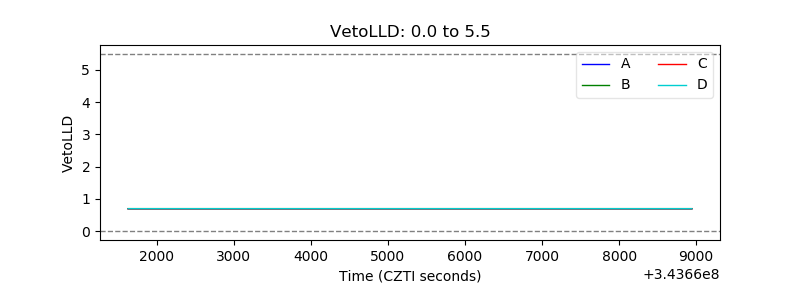 |
| Alpha Counter | 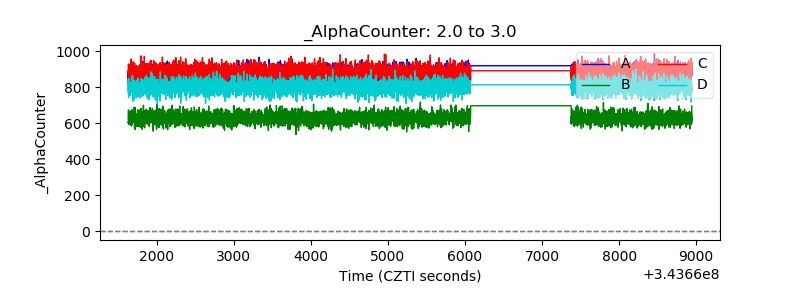 |
| _CPM_Rate | 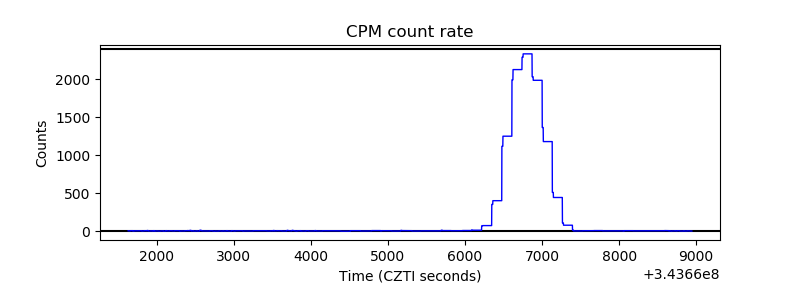 |
| CZT Counter | 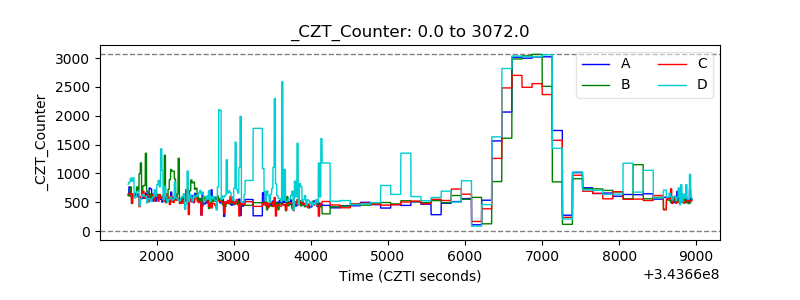 |
| +2.5 Volts monitor |  |
| +5 Volts monitor |  |
| _ROLL_ROT |  |
| _Roll_DEC | 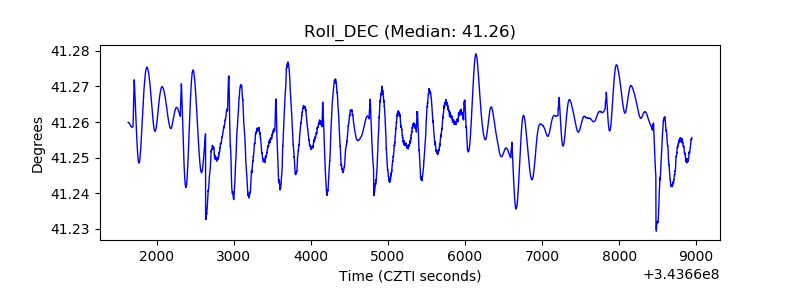 |
| _Roll_RA | 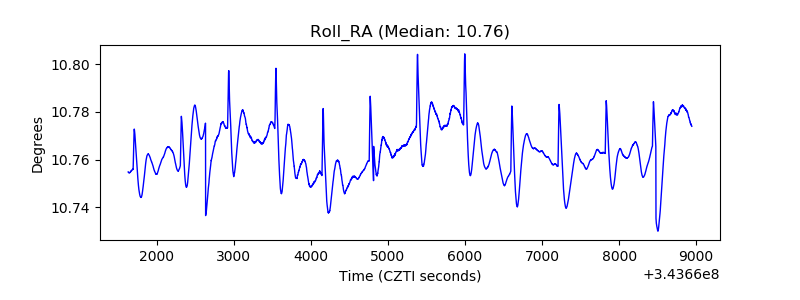 |
| Veto Counter | 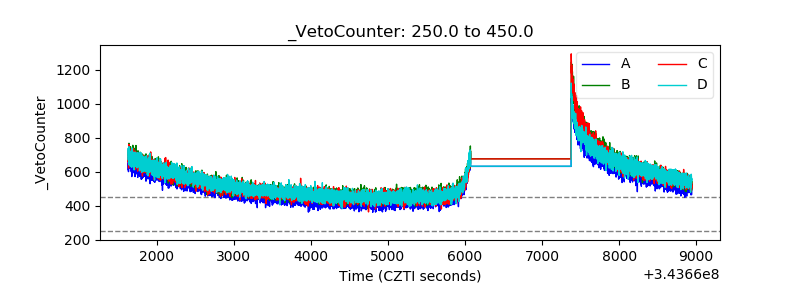 |