| Param | Original file | Final file |
|---|---|---|
| Filename | modeM0/AS1A10_002T04_9000004022_27850cztM0_level2.evt | modeM0/AS1A10_002T04_9000004022_27850cztM0_level2_quad_clean.evt |
| Size (bytes) | 518,699,520 | 120,075,840 |
| Size | 494.7 MB | 114.5 MB |
| Events in quadrant A | 3,518,302 | 833,683 |
| Events in quadrant B | 3,775,756 | 813,705 |
| Events in quadrant C | 3,489,410 | 775,774 |
| Events in quadrant D | 4,489,430 | 765,046 |
| Mode M9 | |||
|---|---|---|---|
| Quadrant | BADHDUFLAG | Total packets | Discarded packets |
| A | 0 | 14 | 0 |
| B | 0 | 15 | 0 |
| C | 0 | 15 | 0 |
| D | 0 | 15 | 0 |
| Mode M0 | |||
|---|---|---|---|
| Quadrant | BADHDUFLAG | Total packets | Discarded packets |
| A | 0 | 14440 | 0 |
| B | 0 | 15315 | 0 |
| C | 0 | 14276 | 0 |
| D | 0 | 17734 | 0 |
| Quadrant | Total seconds | Saturated seconds | Saturation percentage |
|---|---|---|---|
| A | 6432 | 94 | 1.461443% |
| B | 6432 | 118 | 1.834577% |
| C | 6432 | 133 | 2.067786% |
| D | 6431 | 214 | 3.327632% |
Noise dominated data is calculated using 1-second bins in cleaned event files. If a bin has >2000 counts, and if more than 50% of those come from <1% of pixels, then it is considered to be noise-dominated and hence unusable.
| Quadrant | # 1 sec bins | Bins with >0 counts | Bins with >2000 counts | High rate bins dominated by noise | Noise dominated (total time) | Noise dominated (detector-on time) | Marked lightcurve |
|---|---|---|---|---|---|---|---|
| A | 7707 | 6432 | 0 | 0 | 0.00% | 0.00% | 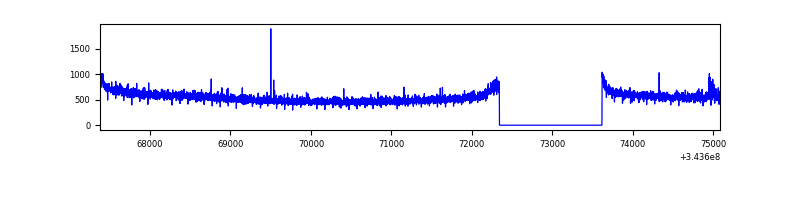 |
| B | 7707 | 6432 | 7 | 7 | 0.09% | 0.11% | 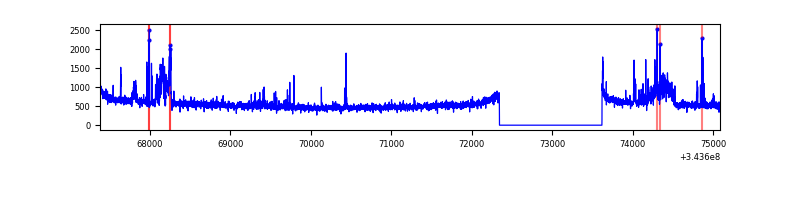 |
| C | 7707 | 6432 | 0 | 0 | 0.00% | 0.00% | 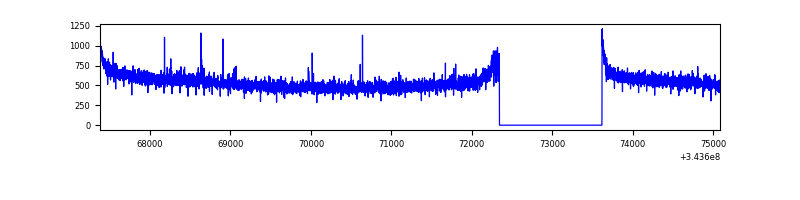 |
| D | 7706 | 6431 | 143 | 143 | 1.86% | 2.22% | 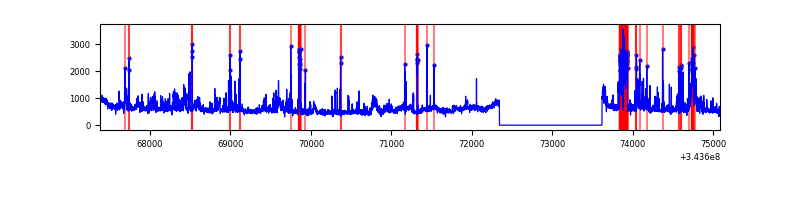 |
Top three noisy pixels from each quadrant. If the there are fewer than three noisy pixels in the level2.evt file, extra rows are filled as -1
| Pixel properties | Quadrant properties | ||||||
|---|---|---|---|---|---|---|---|
| Quadrant | DetID | PixID | Counts | Sigma | Mean | Median | Sigma |
| A | 6 | 16 | 24281 | 131.98 | 901 | 885 | 177.3 |
| A | 13 | 109 | 18677 | 100.37 | 901 | 885 | 177.3 |
| A | 13 | 254 | 11516 | 59.97 | 901 | 885 | 177.3 |
| B | 15 | 32 | 157597 | 973.72 | 873 | 852 | 161.0 |
| B | 15 | 33 | 100739 | 620.51 | 873 | 852 | 161.0 |
| B | 0 | 190 | 42735 | 260.18 | 873 | 852 | 161.0 |
| C | 14 | 238 | 138871 | 702.96 | 849 | 856 | 196.3 |
| C | 3 | 233 | 35582 | 176.87 | 849 | 856 | 196.3 |
| C | 13 | 61 | 5840 | 25.39 | 849 | 856 | 196.3 |
| D | 1 | 52 | 550797 | 2673.72 | 865 | 843 | 205.7 |
| D | 13 | 104 | 367131 | 1780.79 | 865 | 843 | 205.7 |
| D | 2 | 250 | 169756 | 821.21 | 865 | 843 | 205.7 |
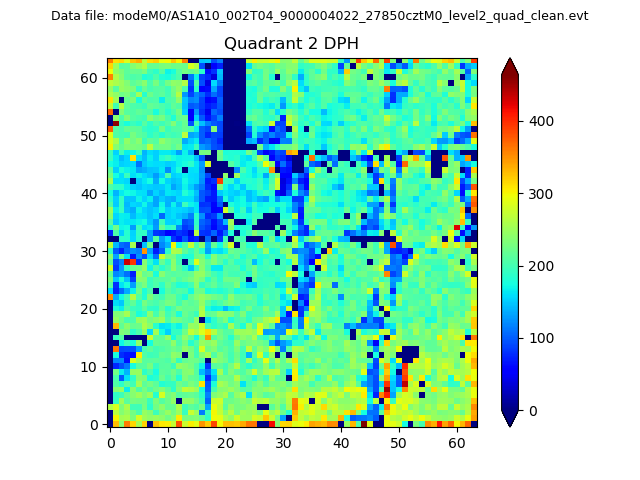
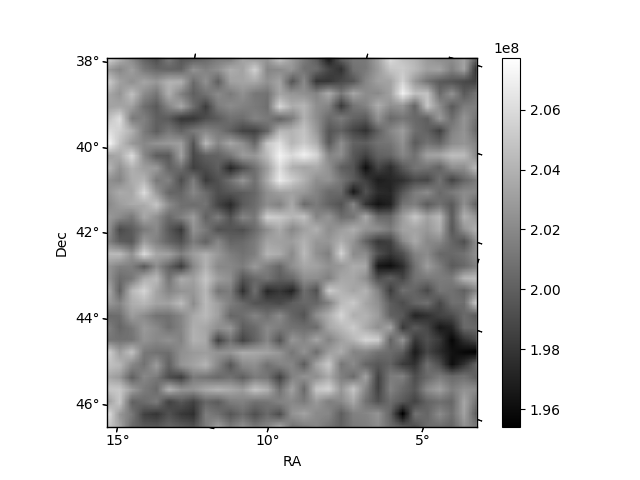
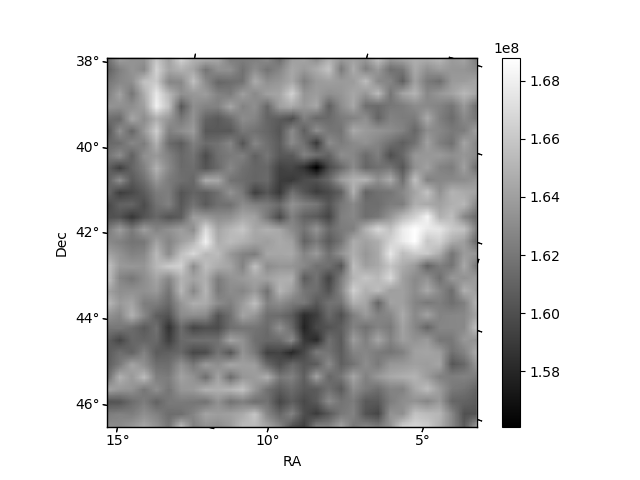
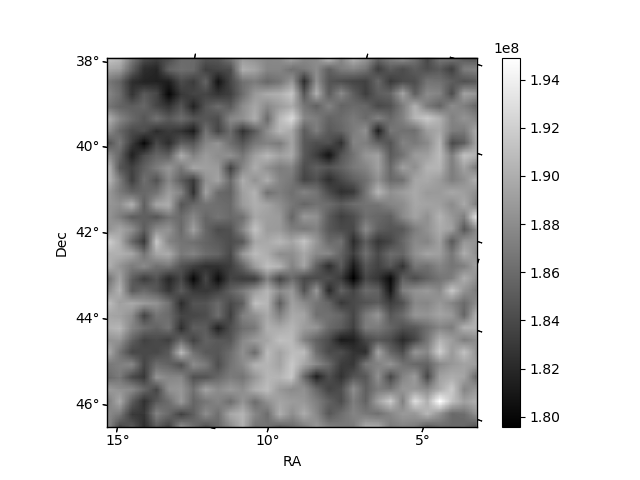
Histogram calculated using DETX and DETY for each event in the final _common_clean file
| Quadrant A |  |
 |
Quadrant B |
|---|---|---|---|
| Quadrant D | 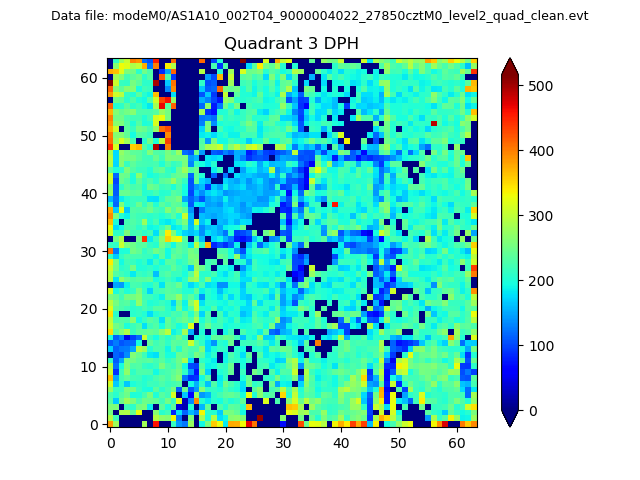 |
 |
Quadrant C |
| Plot type | Count rate plots | Images |
|---|---|---|
| Comparison with Poisson distribution Blue bars denote a histogram of data divided into 1 sec bins. Red curve is a Poisson curve with rate = median count rate of data. |
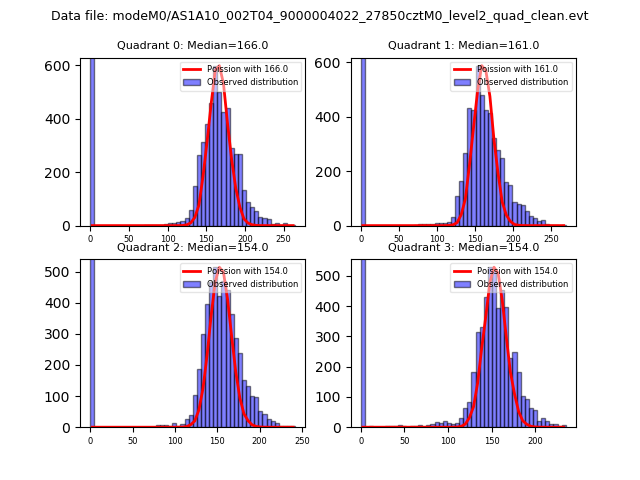 |
 |
| Quadrant-wise count rates Data is divided into 100 sec bins |
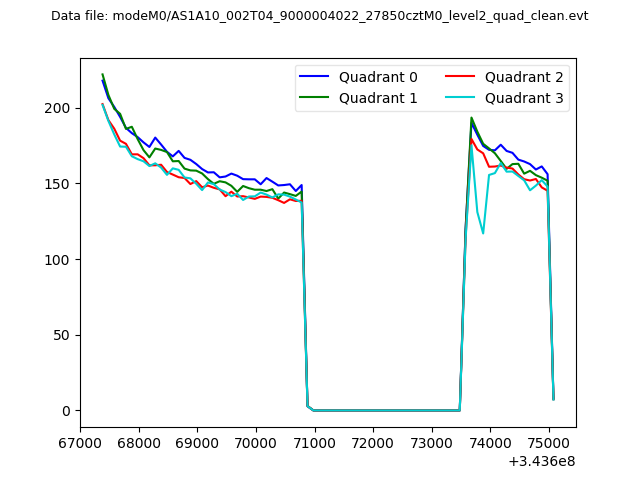 |
|
| Module-wise count rates for Quadrant A Data is divided into 100 sec bins |
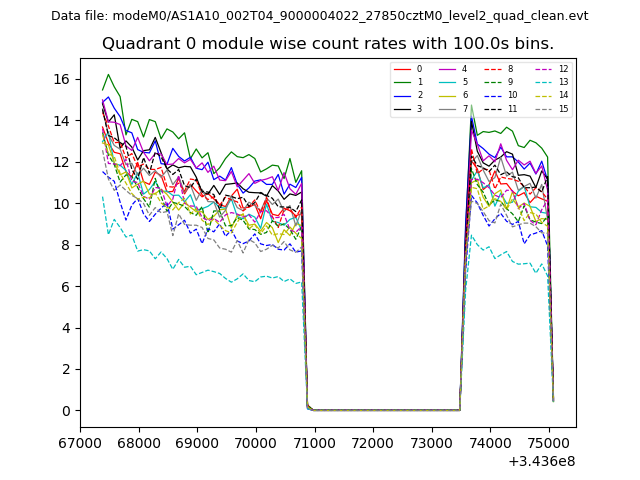 |
 |
| Module-wise count rates for Quadrant B Data is divided into 100 sec bins |
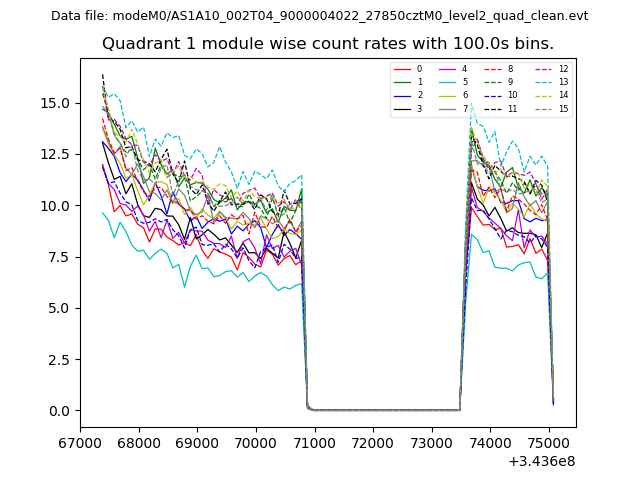 |
 |
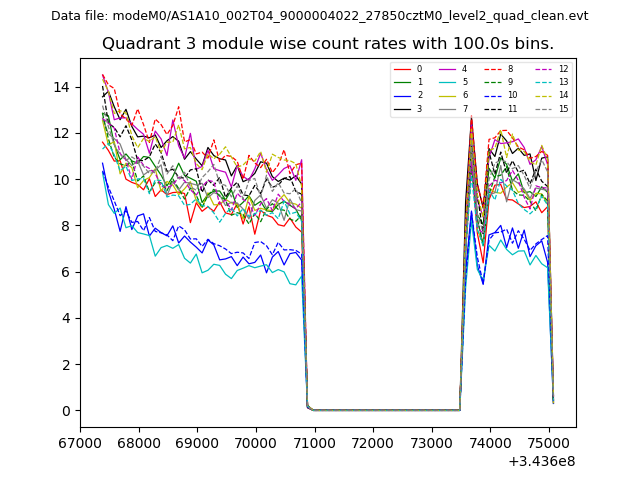
| Module-wise count rates for Quadrant C Data is divided into 100 sec bins |
 |
 |
| Module-wise count rates for Quadrant D Data is divided into 100 sec bins |
 |
 |
| Parameter | Plot |
|---|---|
| CZT HV Monitor | 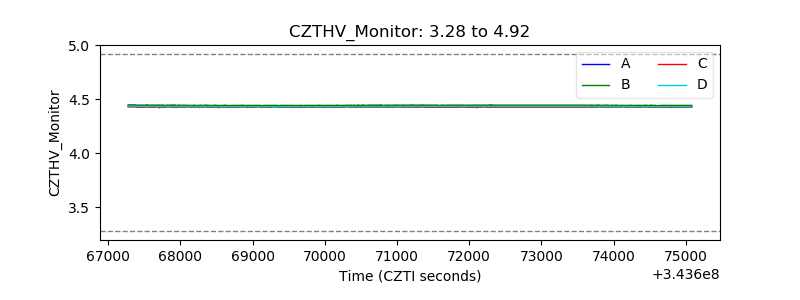 |
| D_VDD | 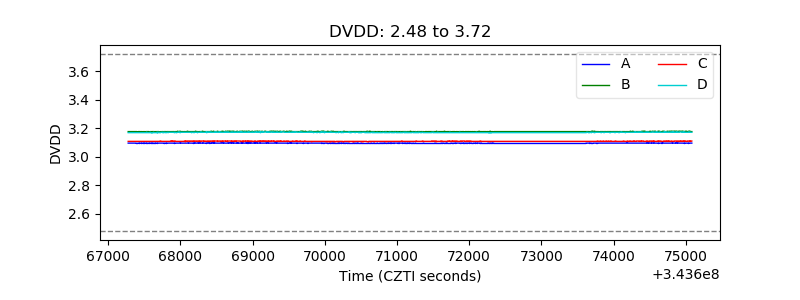 |
| Temperature 1 | 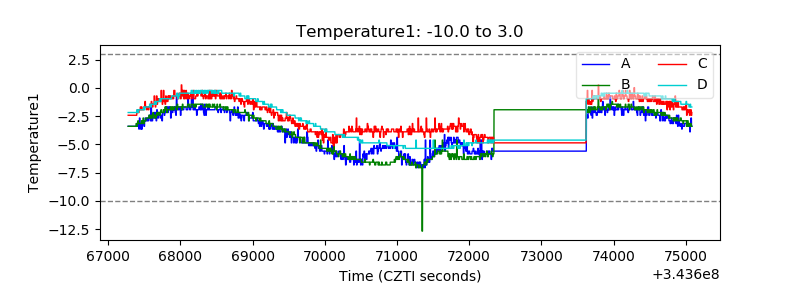 |
| Veto HV Monitor | 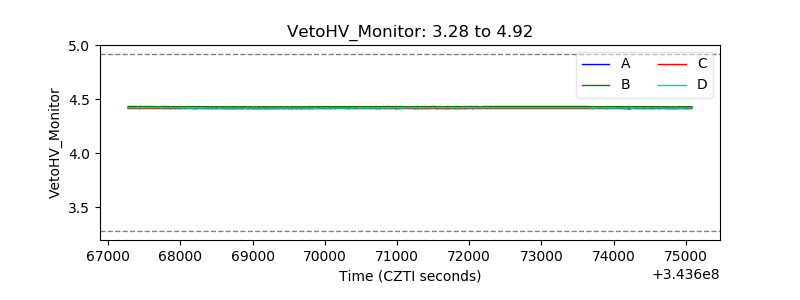 |
| Veto LLD | 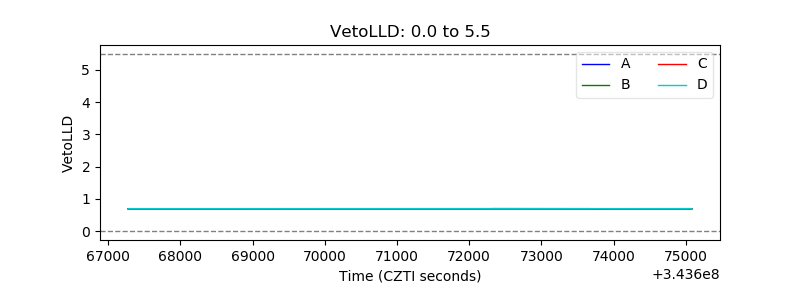 |
| Alpha Counter | 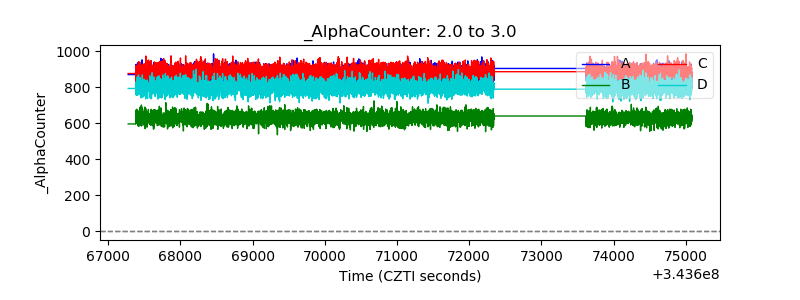 |
| _CPM_Rate | 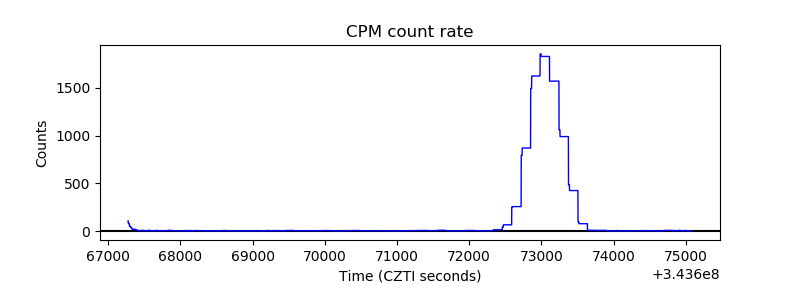 |
| CZT Counter | 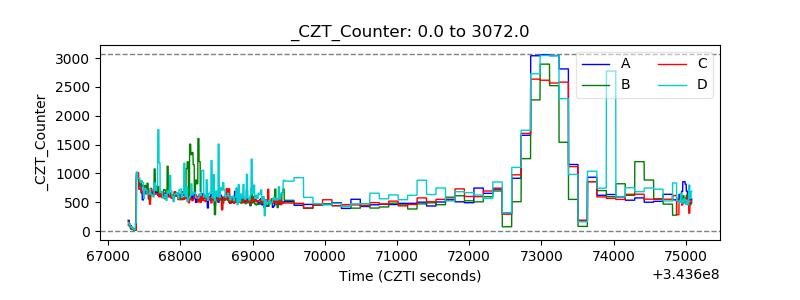 |
| +2.5 Volts monitor |  |
| +5 Volts monitor |  |
| _ROLL_ROT | 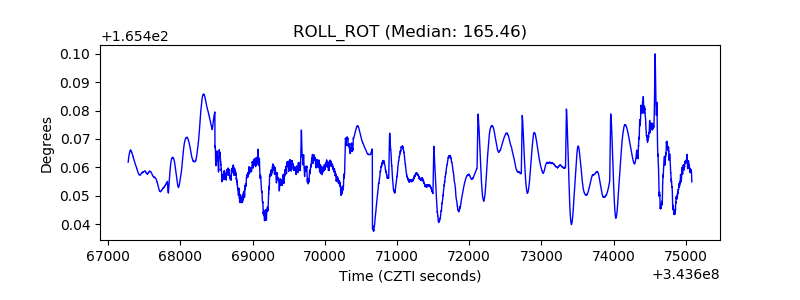 |
| _Roll_DEC | 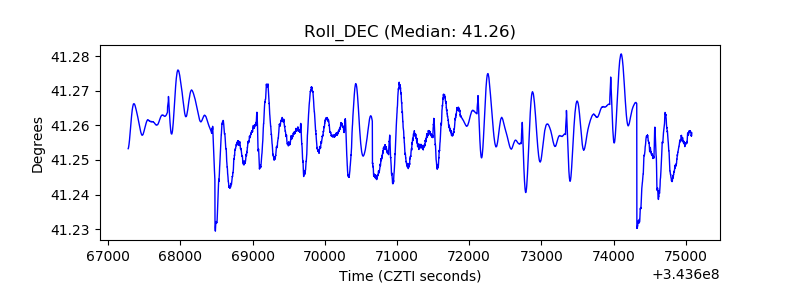 |
| _Roll_RA | 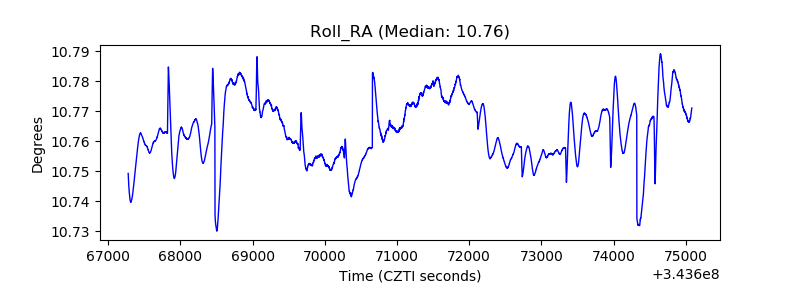 |
| Veto Counter | 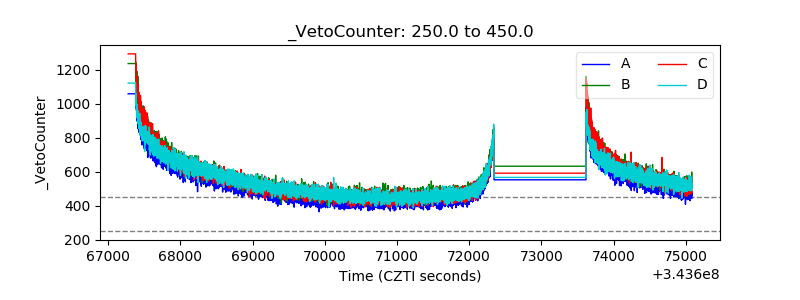 |