| Param | Original file | Final file |
|---|---|---|
| Filename | modeM0/AS1A10_002T04_9000004022_27851cztM0_level2.evt | modeM0/AS1A10_002T04_9000004022_27851cztM0_level2_quad_clean.evt |
| Size (bytes) | 555,960,960 | 106,335,360 |
| Size | 530.2 MB | 101.4 MB |
| Events in quadrant A | 3,453,445 | 722,178 |
| Events in quadrant B | 3,588,330 | 704,490 |
| Events in quadrant C | 3,443,534 | 680,588 |
| Events in quadrant D | 5,905,863 | 654,126 |
| Mode M9 | |||
|---|---|---|---|
| Quadrant | BADHDUFLAG | Total packets | Discarded packets |
| A | 0 | 11 | 0 |
| B | 0 | 11 | 0 |
| C | 0 | 11 | 0 |
| D | 0 | 11 | 0 |
| Mode M0 | |||
|---|---|---|---|
| Quadrant | BADHDUFLAG | Total packets | Discarded packets |
| A | 0 | 14301 | 0 |
| B | 0 | 14785 | 0 |
| C | 0 | 14157 | 0 |
| D | 0 | 21924 | 0 |
| Quadrant | Total seconds | Saturated seconds | Saturation percentage |
|---|---|---|---|
| A | 6580 | 83 | 1.261398% |
| B | 6581 | 109 | 1.656283% |
| C | 6581 | 140 | 2.127336% |
| D | 6580 | 704 | 10.699088% |
Noise dominated data is calculated using 1-second bins in cleaned event files. If a bin has >2000 counts, and if more than 50% of those come from <1% of pixels, then it is considered to be noise-dominated and hence unusable.
| Quadrant | # 1 sec bins | Bins with >0 counts | Bins with >2000 counts | High rate bins dominated by noise | Noise dominated (total time) | Noise dominated (detector-on time) | Marked lightcurve |
|---|---|---|---|---|---|---|---|
| A | 7750 | 6580 | 1 | 1 | 0.01% | 0.02% | 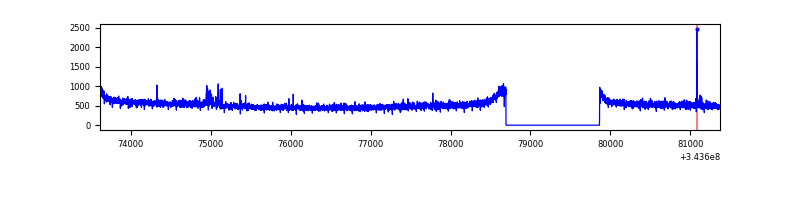 |
| B | 7751 | 6581 | 3 | 3 | 0.04% | 0.05% | 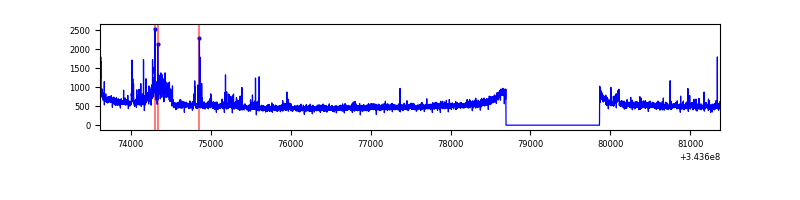 |
| C | 7751 | 6581 | 0 | 0 | 0.00% | 0.00% | 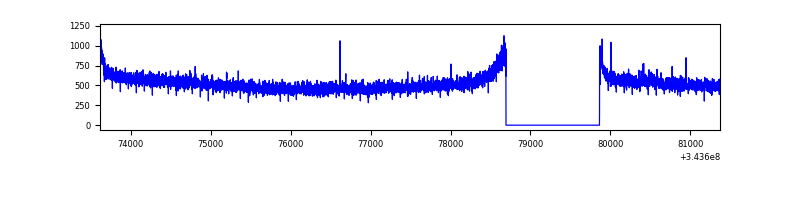 |
| D | 7750 | 6580 | 634 | 634 | 8.18% | 9.64% | 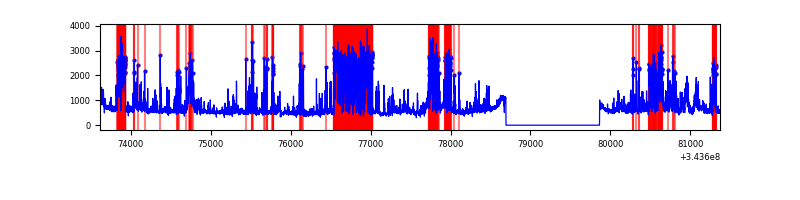 |
Top three noisy pixels from each quadrant. If the there are fewer than three noisy pixels in the level2.evt file, extra rows are filled as -1
| Pixel properties | Quadrant properties | ||||||
|---|---|---|---|---|---|---|---|
| Quadrant | DetID | PixID | Counts | Sigma | Mean | Median | Sigma |
| A | 6 | 16 | 56020 | 316.3 | 878 | 861 | 174.4 |
| A | 0 | 13 | 11782 | 62.62 | 878 | 861 | 174.4 |
| A | 13 | 254 | 11298 | 59.85 | 878 | 861 | 174.4 |
| B | 15 | 33 | 113885 | 700.65 | 859 | 838 | 161.3 |
| B | 15 | 32 | 61718 | 377.32 | 859 | 838 | 161.3 |
| B | 12 | 111 | 18751 | 111.02 | 859 | 838 | 161.3 |
| C | 14 | 238 | 135447 | 683.58 | 839 | 846 | 196.9 |
| C | 3 | 233 | 37188 | 184.57 | 839 | 846 | 196.9 |
| C | 13 | 61 | 5658 | 24.44 | 839 | 846 | 196.9 |
| D | 1 | 52 | 2086283 | 10610.95 | 822 | 802 | 196.5 |
| D | 2 | 250 | 293809 | 1490.82 | 822 | 802 | 196.5 |
| D | 13 | 104 | 252366 | 1279.96 | 822 | 802 | 196.5 |
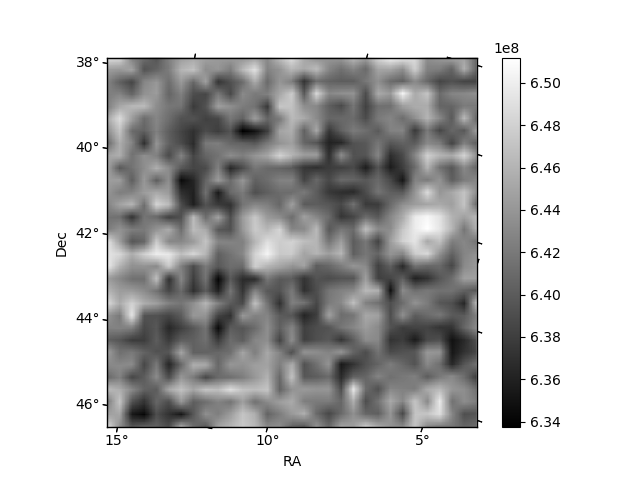
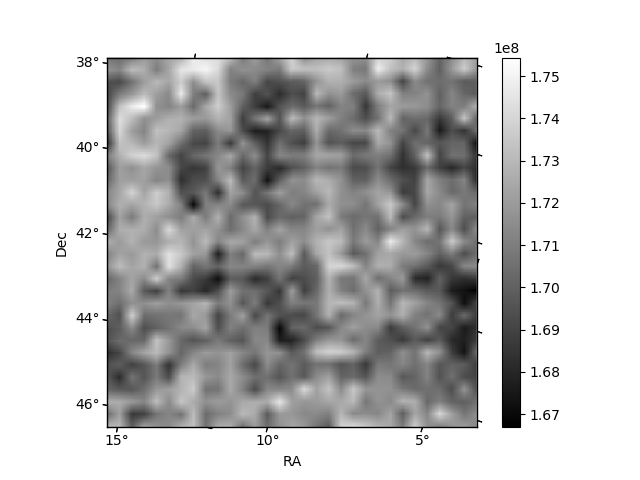
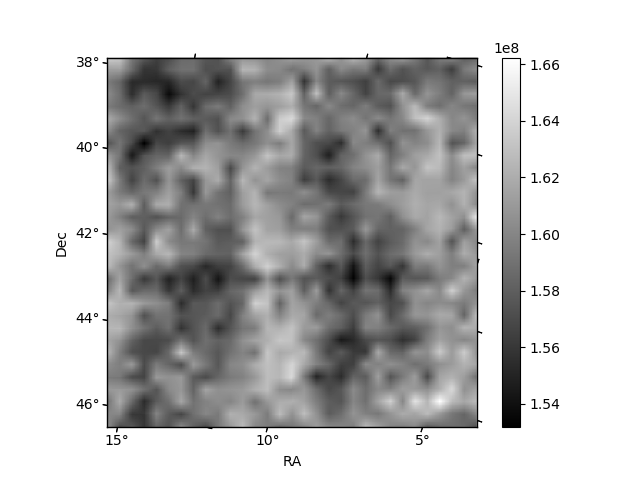
Histogram calculated using DETX and DETY for each event in the final _common_clean file
| Quadrant A | 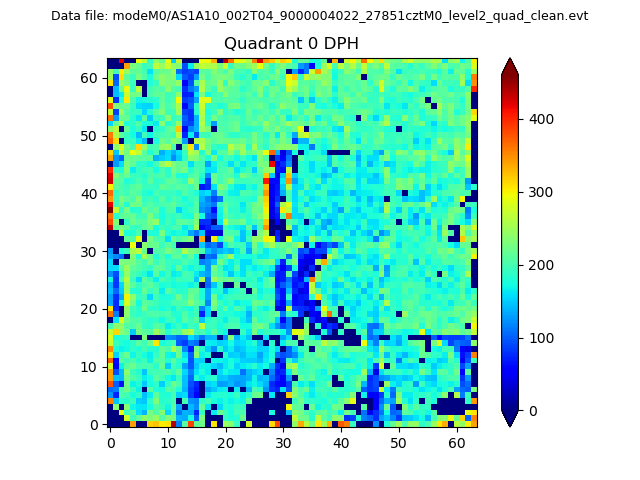 |
 |
Quadrant B |
|---|---|---|---|
| Quadrant D | 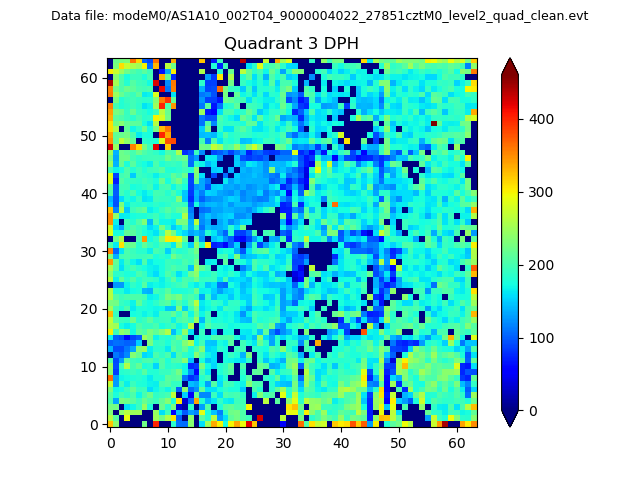 |
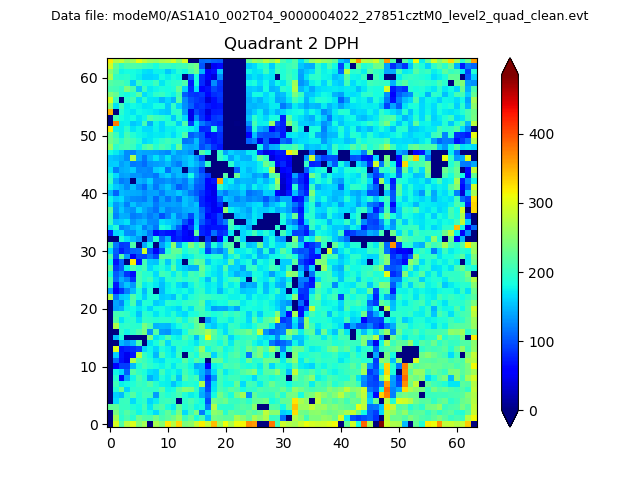 |
Quadrant C |
| Plot type | Count rate plots | Images |
|---|---|---|
| Comparison with Poisson distribution Blue bars denote a histogram of data divided into 1 sec bins. Red curve is a Poisson curve with rate = median count rate of data. |
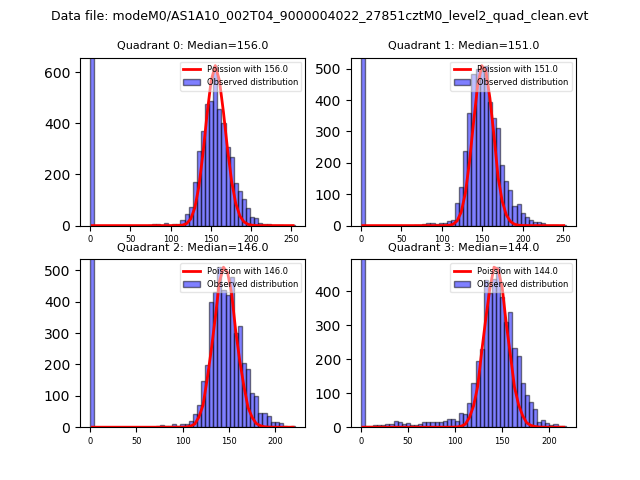 |
 |
| Quadrant-wise count rates Data is divided into 100 sec bins |
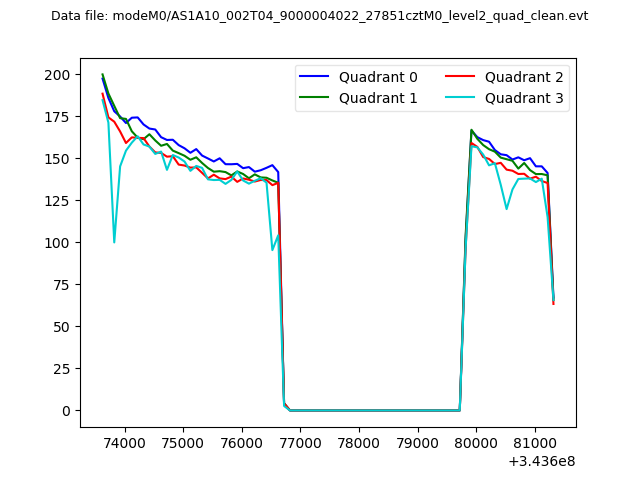 |
|
| Module-wise count rates for Quadrant A Data is divided into 100 sec bins |
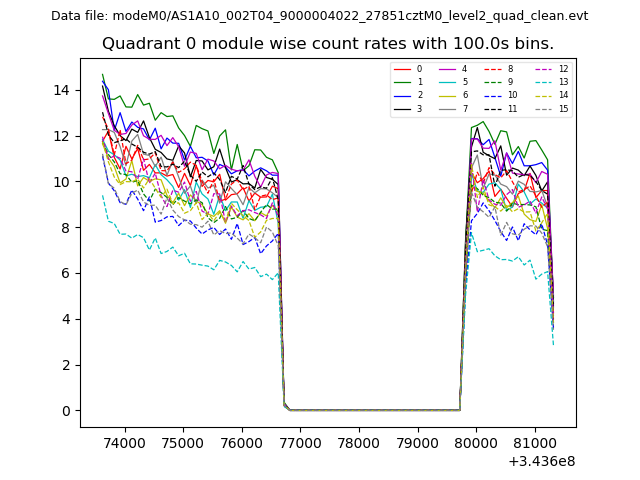 |
 |
| Module-wise count rates for Quadrant B Data is divided into 100 sec bins |
 |
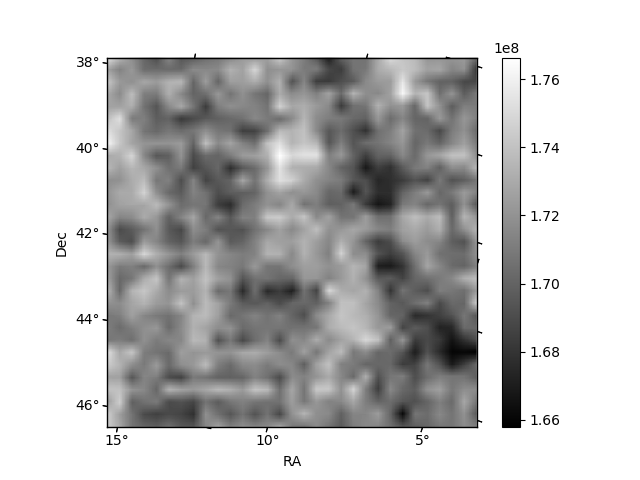 |
| Module-wise count rates for Quadrant C Data is divided into 100 sec bins |
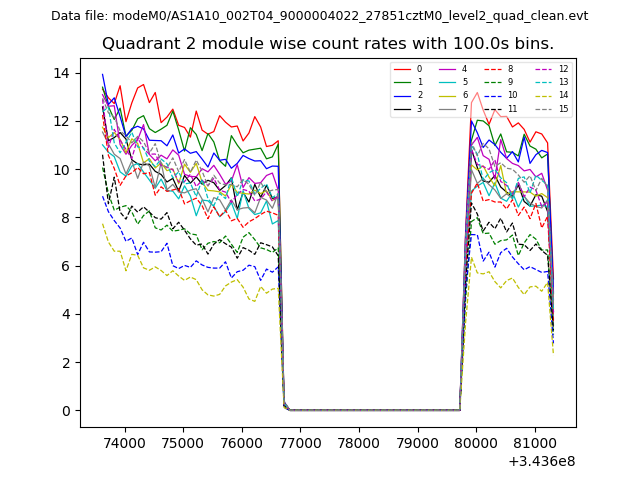 |
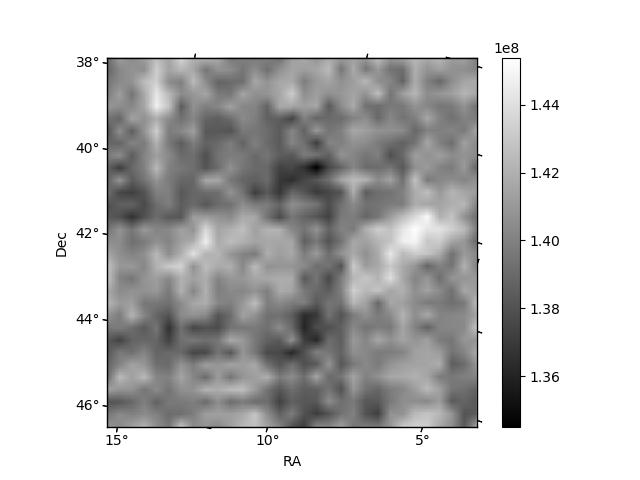 |
| Module-wise count rates for Quadrant D Data is divided into 100 sec bins |
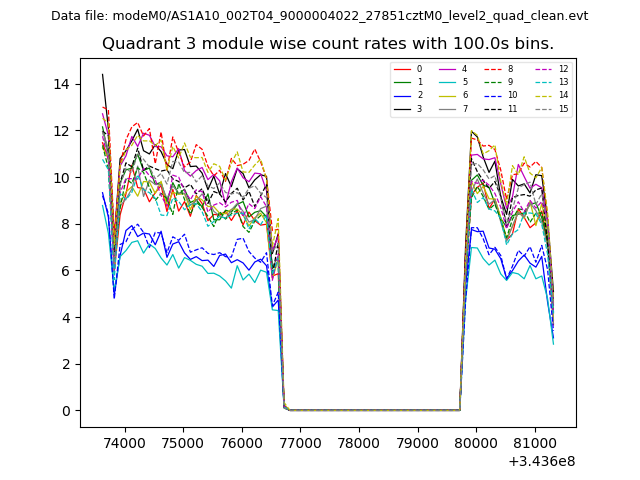 |
 |
| Parameter | Plot |
|---|---|
| CZT HV Monitor | 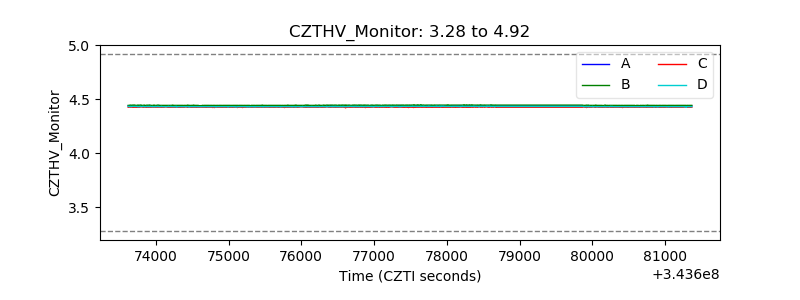 |
| D_VDD | 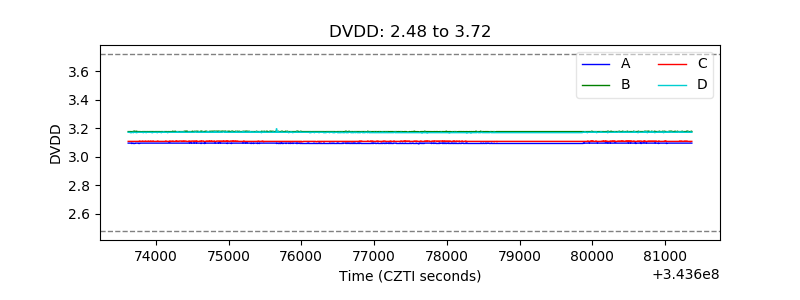 |
| Temperature 1 | 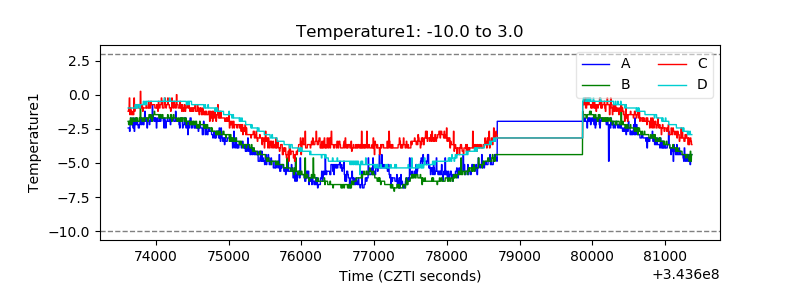 |
| Veto HV Monitor | 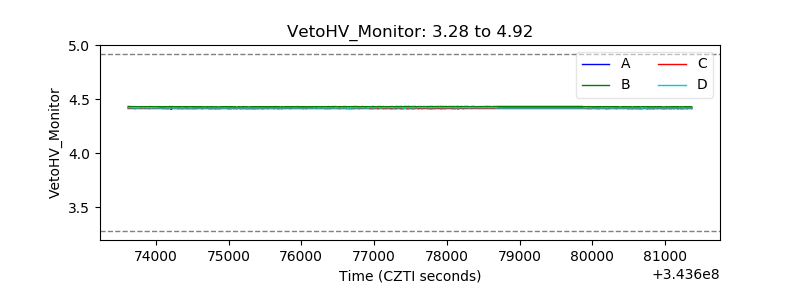 |
| Veto LLD | 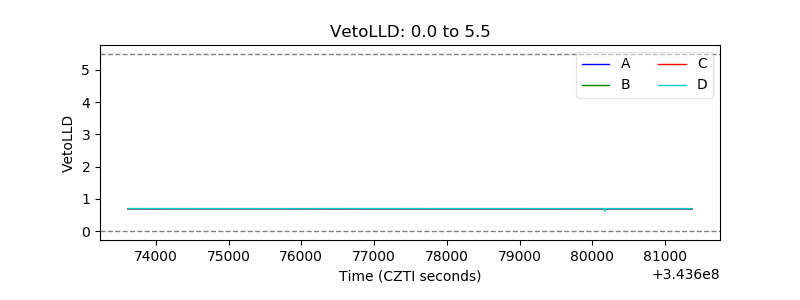 |
| Alpha Counter | 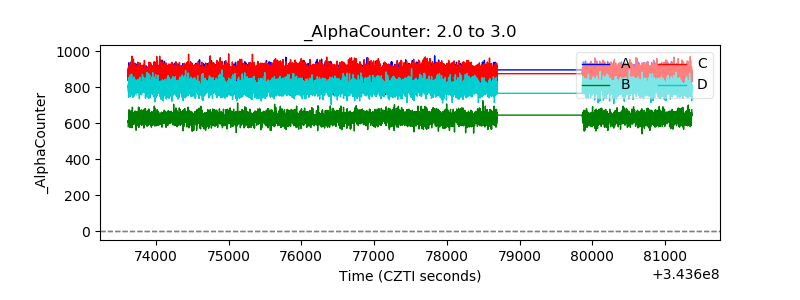 |
| _CPM_Rate | 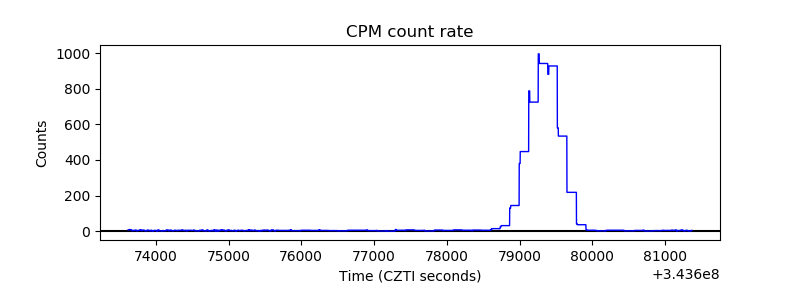 |
| CZT Counter | 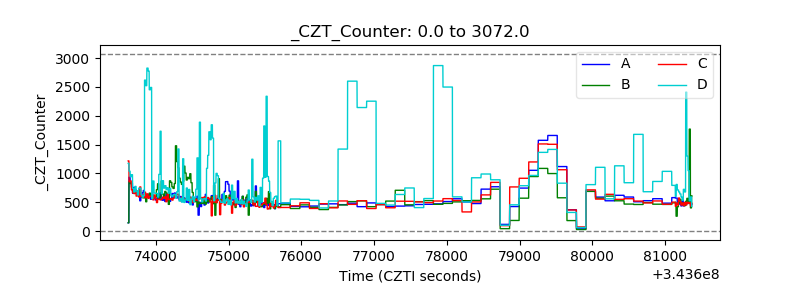 |
| +2.5 Volts monitor |  |
| +5 Volts monitor |  |
| _ROLL_ROT | 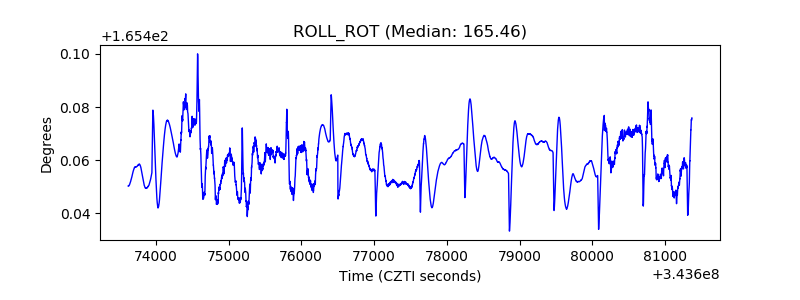 |
| _Roll_DEC | 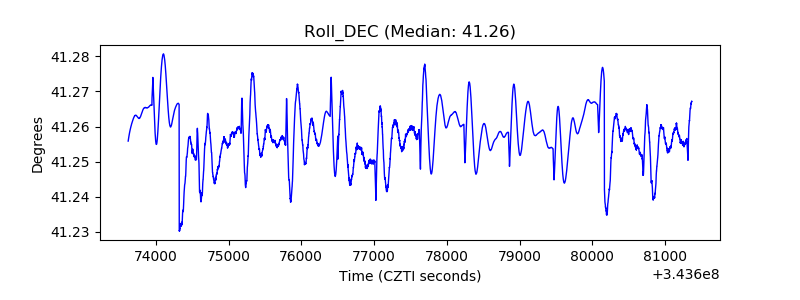 |
| _Roll_RA | 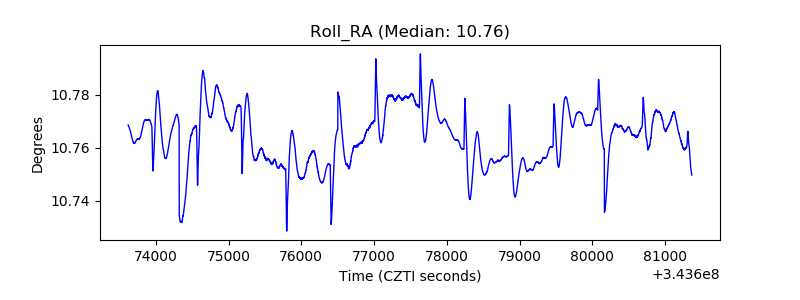 |
| Veto Counter |  |