| Param | Original file | Final file |
|---|---|---|
| Filename | modeM0/AS1A10_002T04_9000004022_27852cztM0_level2.evt | modeM0/AS1A10_002T04_9000004022_27852cztM0_level2_quad_clean.evt |
| Size (bytes) | 505,612,800 | 95,970,240 |
| Size | 482.2 MB | 91.5 MB |
| Events in quadrant A | 3,252,599 | 639,530 |
| Events in quadrant B | 3,265,800 | 624,751 |
| Events in quadrant C | 3,493,845 | 601,214 |
| Events in quadrant D | 4,856,422 | 584,857 |
| Mode M9 | |||
|---|---|---|---|
| Quadrant | BADHDUFLAG | Total packets | Discarded packets |
| A | 0 | 10 | 0 |
| B | 0 | 10 | 0 |
| C | 0 | 10 | 0 |
| D | 0 | 10 | 0 |
| Mode M0 | |||
|---|---|---|---|
| Quadrant | BADHDUFLAG | Total packets | Discarded packets |
| A | 0 | 13730 | 0 |
| B | 0 | 13763 | 0 |
| C | 0 | 14525 | 0 |
| D | 0 | 18842 | 0 |
| Quadrant | Total seconds | Saturated seconds | Saturation percentage |
|---|---|---|---|
| A | 6542 | 44 | 0.672577% |
| B | 6542 | 50 | 0.764292% |
| C | 6543 | 139 | 2.124408% |
| D | 6542 | 336 | 5.136044% |
Noise dominated data is calculated using 1-second bins in cleaned event files. If a bin has >2000 counts, and if more than 50% of those come from <1% of pixels, then it is considered to be noise-dominated and hence unusable.
| Quadrant | # 1 sec bins | Bins with >0 counts | Bins with >2000 counts | High rate bins dominated by noise | Noise dominated (total time) | Noise dominated (detector-on time) | Marked lightcurve |
|---|---|---|---|---|---|---|---|
| A | 7477 | 6543 | 2 | 2 | 0.03% | 0.03% | 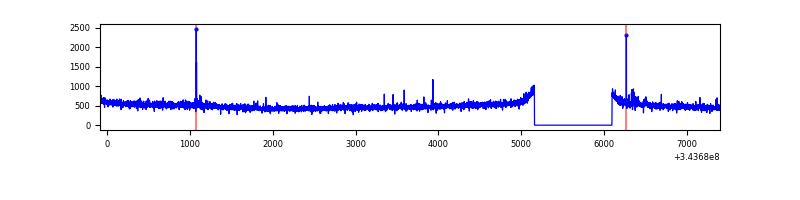 |
| B | 7477 | 6542 | 0 | 0 | 0.00% | 0.00% | 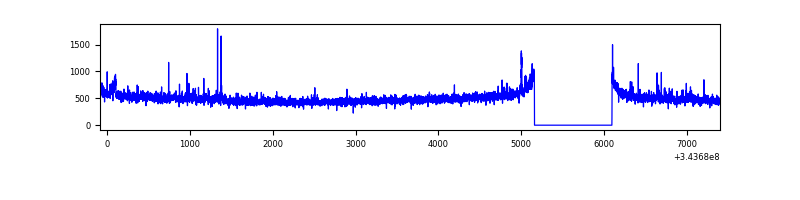 |
| C | 7478 | 6543 | 22 | 22 | 0.29% | 0.34% | 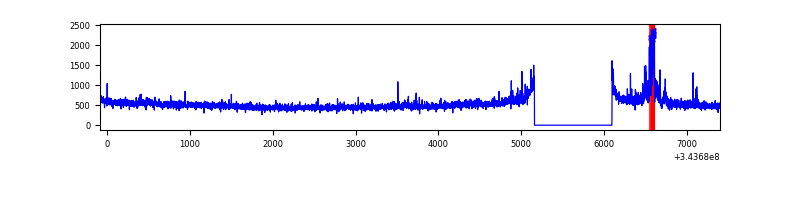 |
| D | 7477 | 6543 | 301 | 301 | 4.03% | 4.60% | 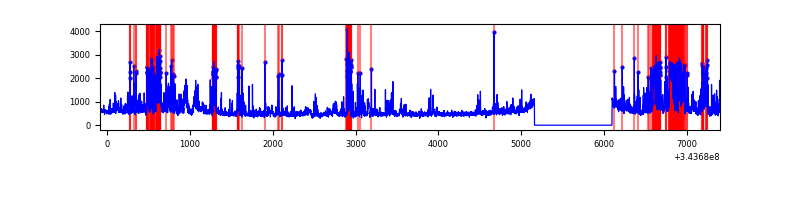 |
Top three noisy pixels from each quadrant. If the there are fewer than three noisy pixels in the level2.evt file, extra rows are filled as -1
| Pixel properties | Quadrant properties | ||||||
|---|---|---|---|---|---|---|---|
| Quadrant | DetID | PixID | Counts | Sigma | Mean | Median | Sigma |
| A | 6 | 16 | 45008 | 265.88 | 828 | 810 | 166.2 |
| A | 0 | 13 | 12665 | 71.32 | 828 | 810 | 166.2 |
| A | 13 | 254 | 11791 | 66.06 | 828 | 810 | 166.2 |
| B | 0 | 190 | 29582 | 188.13 | 811 | 789 | 153.0 |
| B | 12 | 111 | 18374 | 114.9 | 811 | 789 | 153.0 |
| B | 10 | 245 | 16781 | 104.49 | 811 | 789 | 153.0 |
| C | 3 | 233 | 279623 | 1502.9 | 791 | 795 | 185.5 |
| C | 14 | 238 | 126949 | 679.98 | 791 | 795 | 185.5 |
| C | 13 | 61 | 5304 | 24.3 | 791 | 795 | 185.5 |
| D | 1 | 52 | 1133378 | 6022.48 | 790 | 773 | 188.1 |
| D | 2 | 250 | 401823 | 2132.53 | 790 | 773 | 188.1 |
| D | 13 | 104 | 270045 | 1431.82 | 790 | 773 | 188.1 |
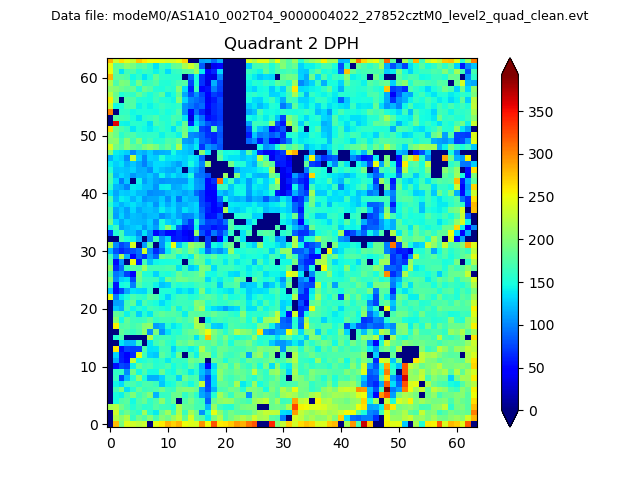
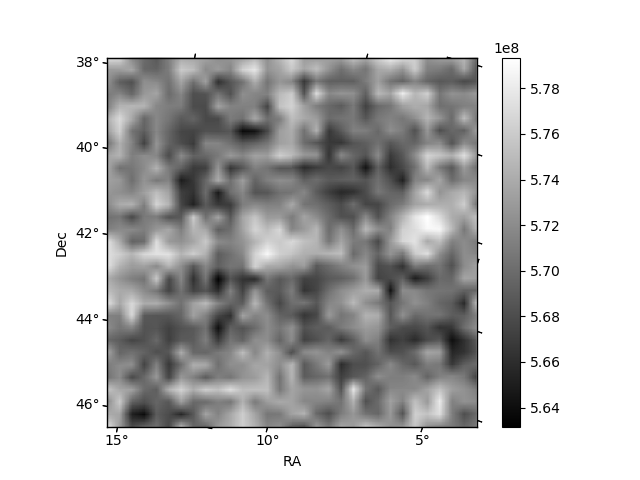
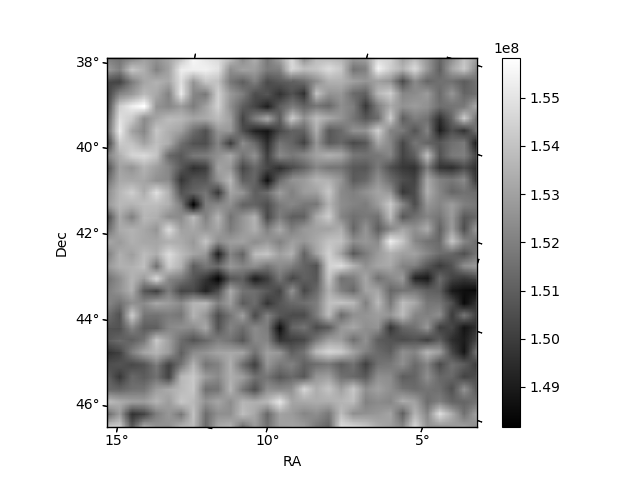
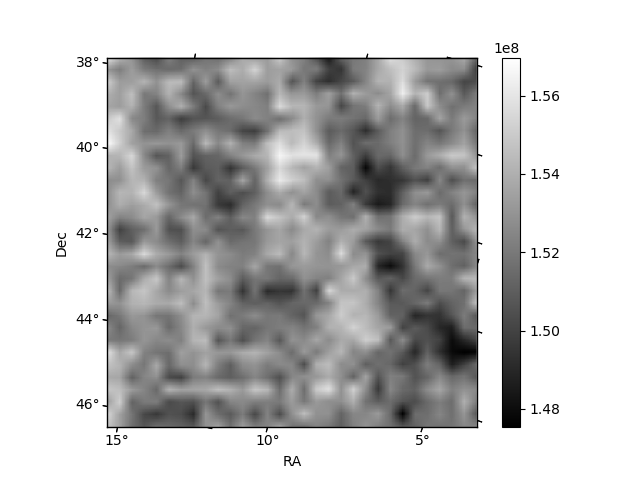
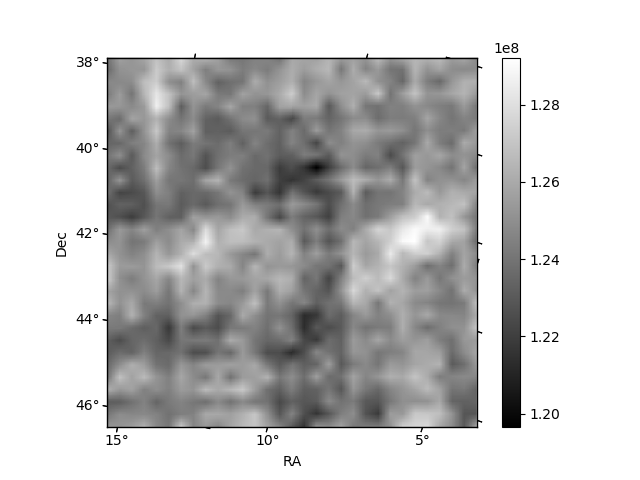
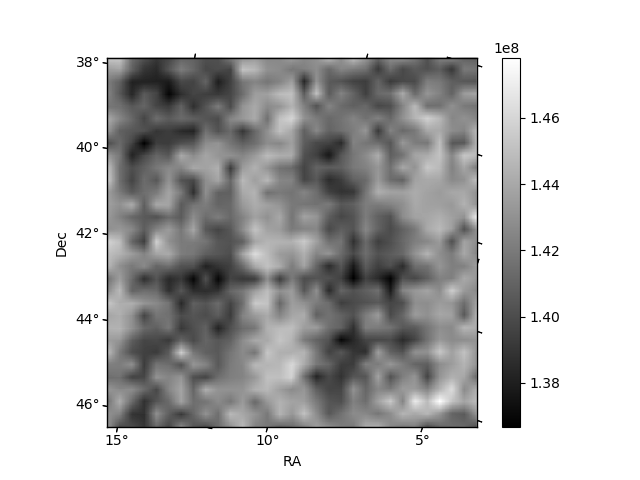
Histogram calculated using DETX and DETY for each event in the final _common_clean file
| Quadrant A | 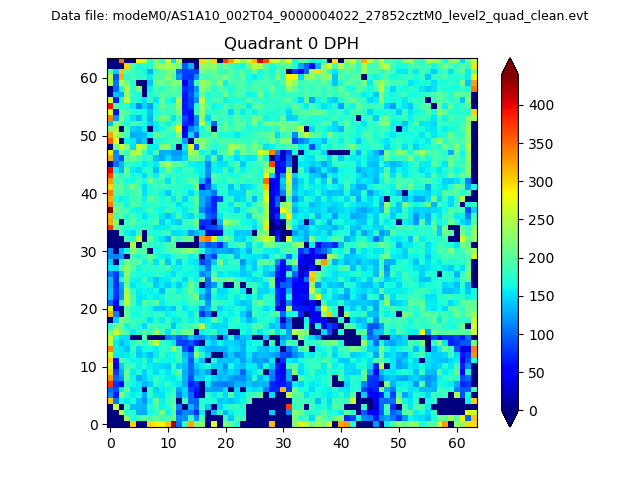 |
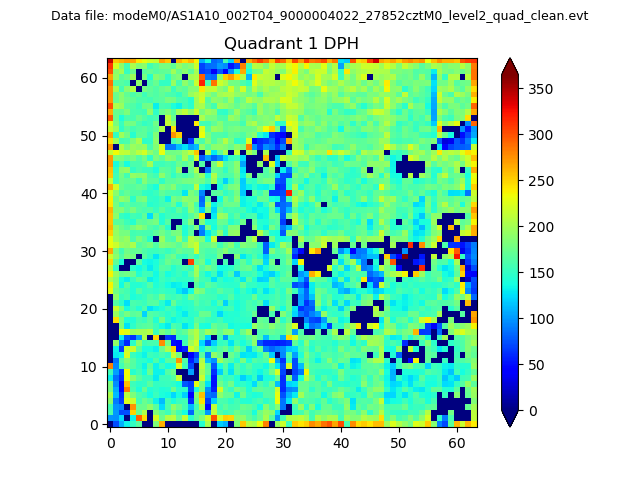 |
Quadrant B |
|---|---|---|---|
| Quadrant D | 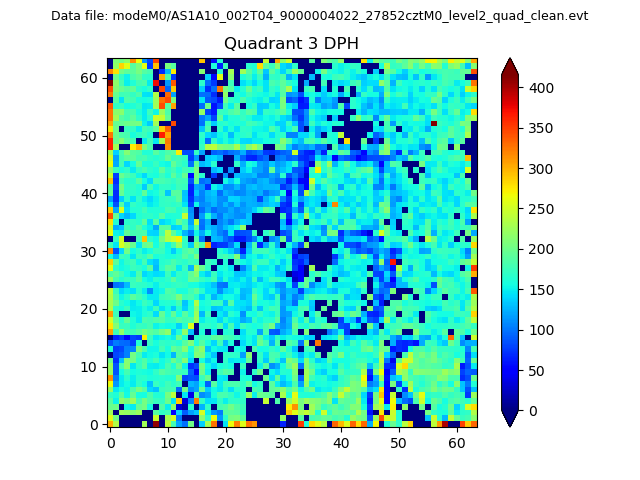 |
 |
Quadrant C |
| Plot type | Count rate plots | Images |
|---|---|---|
| Comparison with Poisson distribution Blue bars denote a histogram of data divided into 1 sec bins. Red curve is a Poisson curve with rate = median count rate of data. |
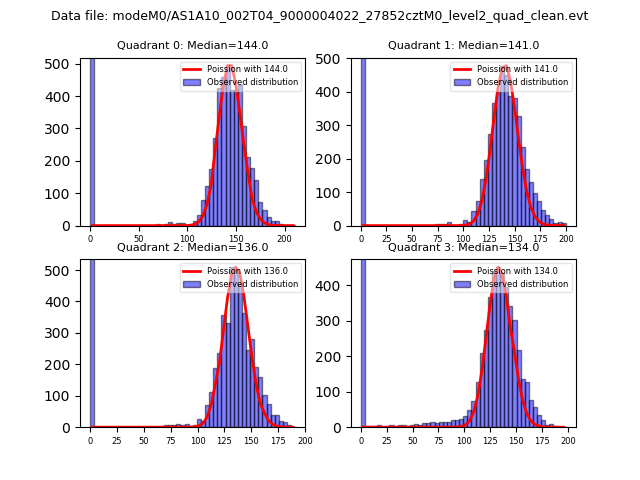 |
 |
| Quadrant-wise count rates Data is divided into 100 sec bins |
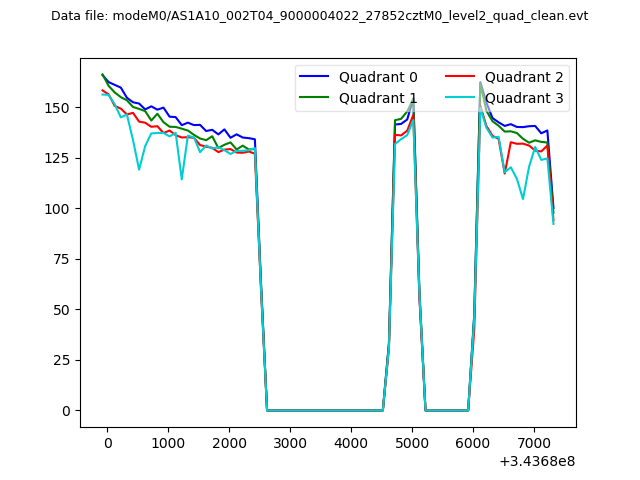 |
|
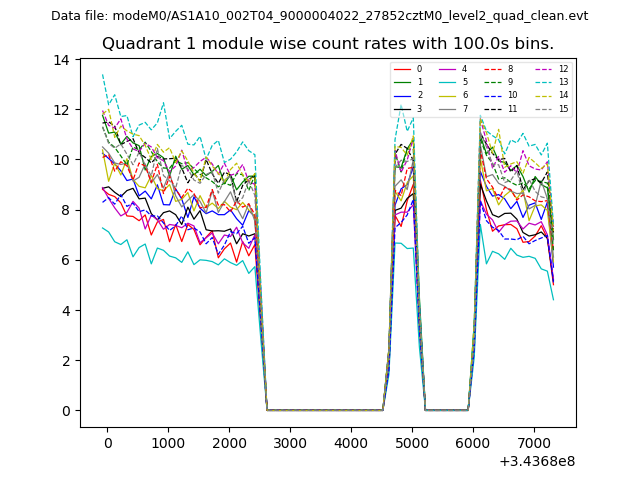
| Module-wise count rates for Quadrant A Data is divided into 100 sec bins |
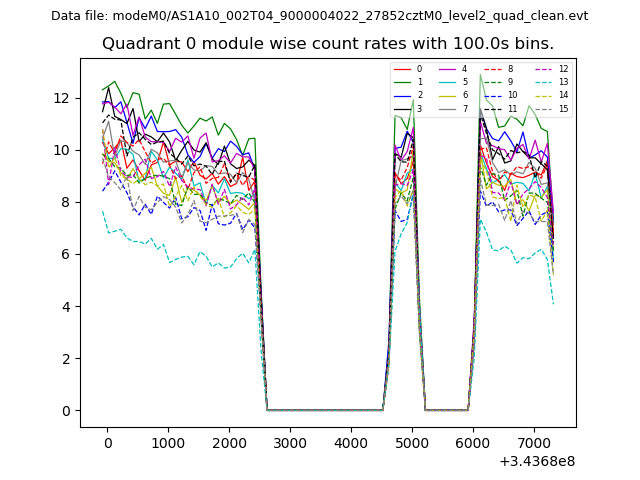 |
 |
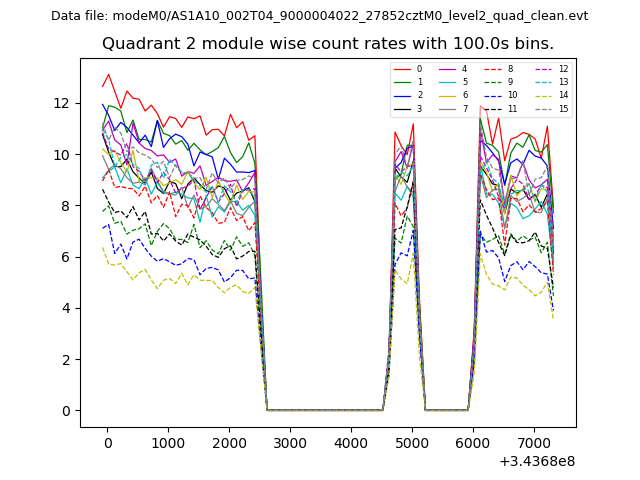
| Module-wise count rates for Quadrant B Data is divided into 100 sec bins |
 |
 |
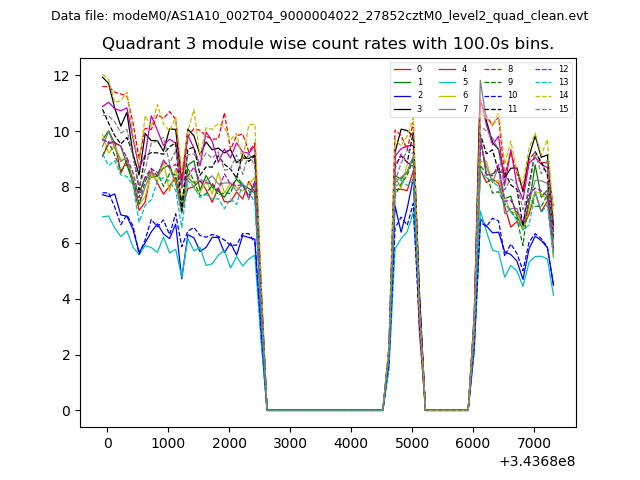
| Module-wise count rates for Quadrant C Data is divided into 100 sec bins |
 |
 |
| Module-wise count rates for Quadrant D Data is divided into 100 sec bins |
 |
 |
| Parameter | Plot |
|---|---|
| CZT HV Monitor | 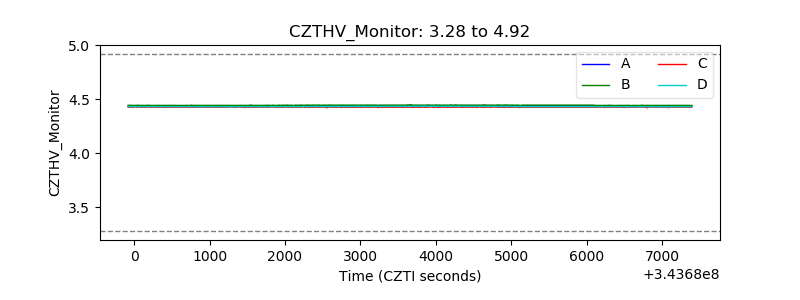 |
| D_VDD | 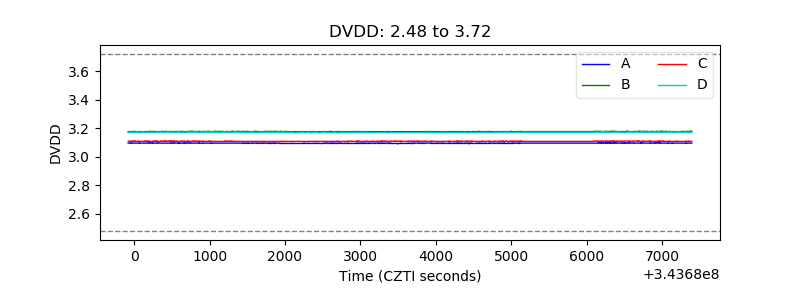 |
| Temperature 1 | 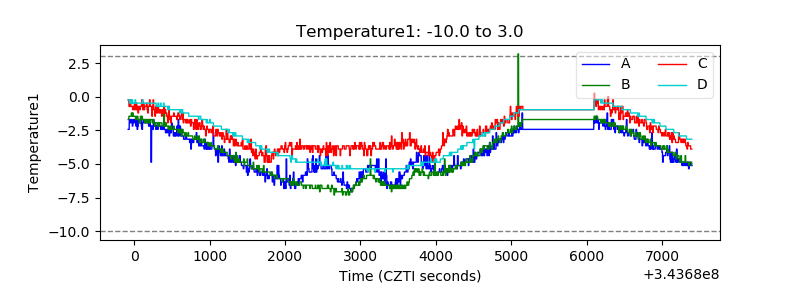 |
| Veto HV Monitor | 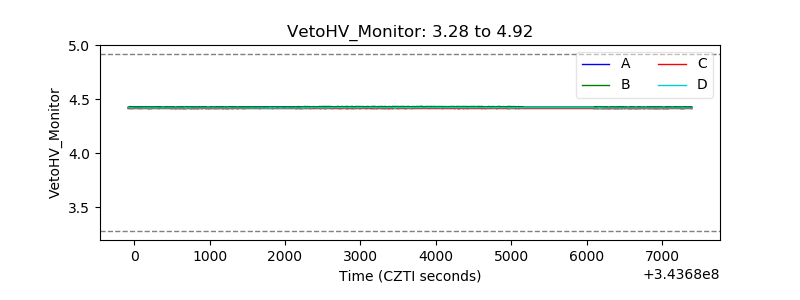 |
| Veto LLD |  |
| Alpha Counter | 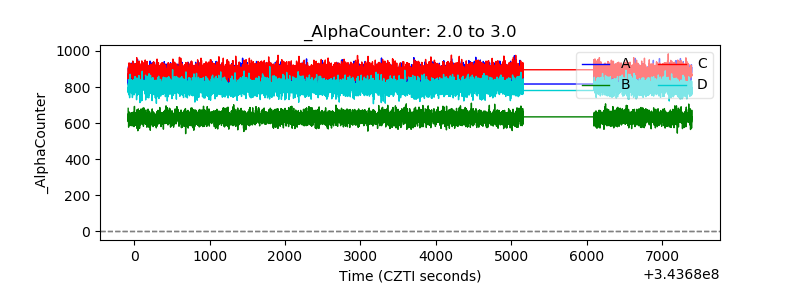 |
| _CPM_Rate | 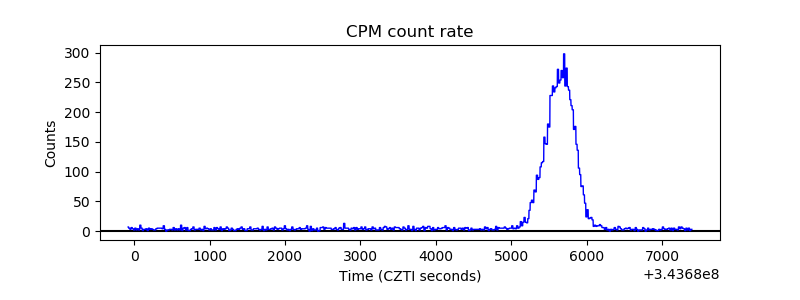 |
| CZT Counter | 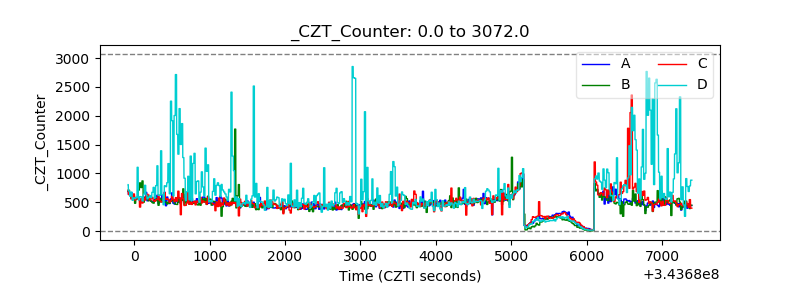 |
| +2.5 Volts monitor |  |
| +5 Volts monitor |  |
| _ROLL_ROT | 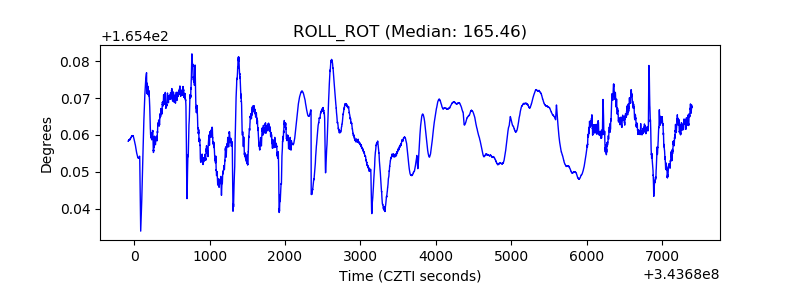 |
| _Roll_DEC | 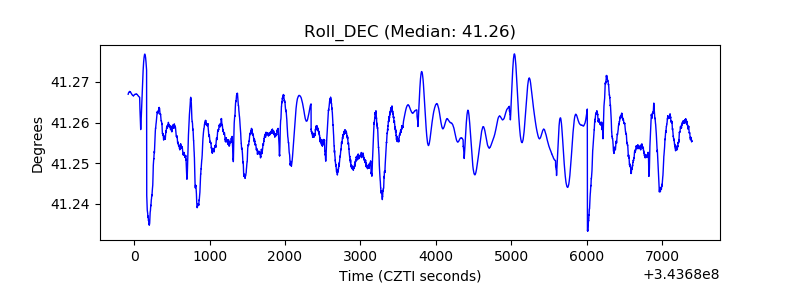 |
| _Roll_RA | 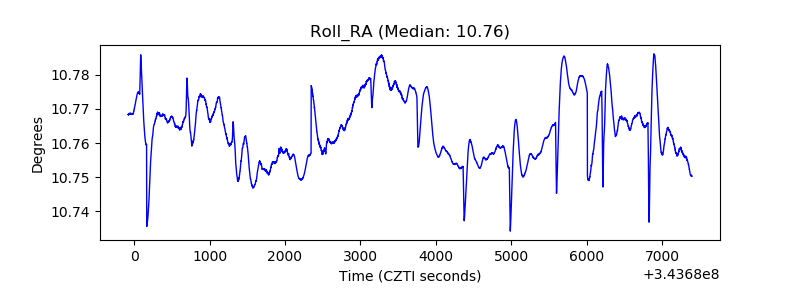 |
| Veto Counter | 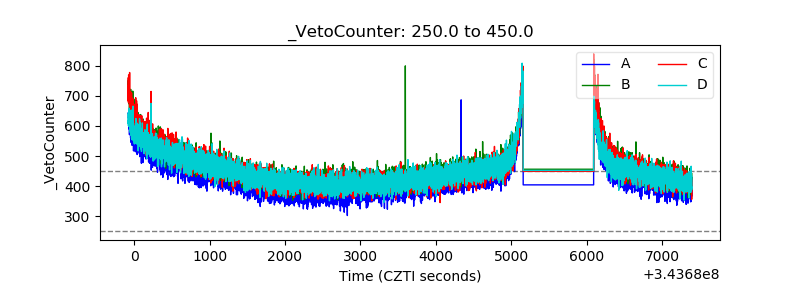 |