| Param | Original file | Final file |
|---|---|---|
| Filename | modeM0/AS1A10_002T04_9000004022_27853cztM0_level2.evt | modeM0/AS1A10_002T04_9000004022_27853cztM0_level2_quad_clean.evt |
| Size (bytes) | 170,611,200 | 40,239,360 |
| Size | 162.7 MB | 38.4 MB |
| Events in quadrant A | 980,992 | 281,983 |
| Events in quadrant B | 983,855 | 272,644 |
| Events in quadrant C | 1,180,236 | 262,404 |
| Events in quadrant D | 1,882,249 | 254,251 |
| Mode M9 | |||
|---|---|---|---|
| Quadrant | BADHDUFLAG | Total packets | Discarded packets |
| A | 0 | 7 | 0 |
| B | 0 | 8 | 0 |
| C | 0 | 8 | 0 |
| D | 0 | 8 | 0 |
| Mode M0 | |||
|---|---|---|---|
| Quadrant | BADHDUFLAG | Total packets | Discarded packets |
| A | 0 | 4266 | 0 |
| B | 0 | 4250 | 0 |
| C | 0 | 4888 | 0 |
| D | 0 | 7007 | 0 |
| Quadrant | Total seconds | Saturated seconds | Saturation percentage |
|---|---|---|---|
| A | 2022 | 9 | 0.445104% |
| B | 2022 | 12 | 0.593472% |
| C | 2022 | 78 | 3.857567% |
| D | 2022 | 187 | 9.248269% |
Noise dominated data is calculated using 1-second bins in cleaned event files. If a bin has >2000 counts, and if more than 50% of those come from <1% of pixels, then it is considered to be noise-dominated and hence unusable.
| Quadrant | # 1 sec bins | Bins with >0 counts | Bins with >2000 counts | High rate bins dominated by noise | Noise dominated (total time) | Noise dominated (detector-on time) | Marked lightcurve |
|---|---|---|---|---|---|---|---|
| A | 2022 | 2022 | 1 | 1 | 0.05% | 0.05% | 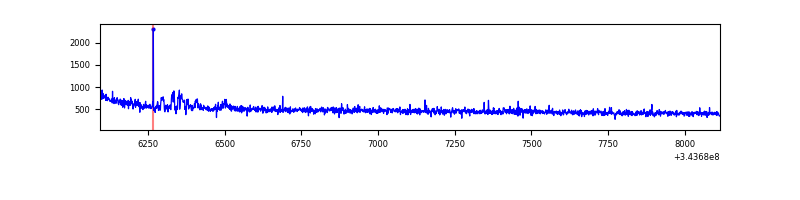 |
| B | 2022 | 2022 | 0 | 0 | 0.00% | 0.00% | 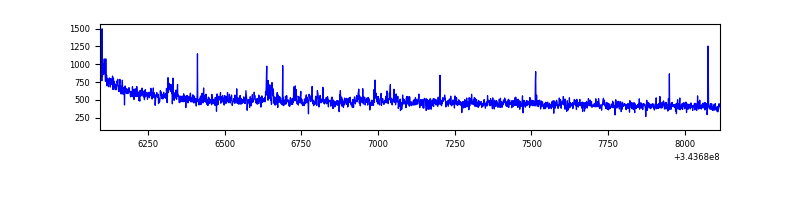 |
| C | 2022 | 2022 | 22 | 22 | 1.09% | 1.09% | 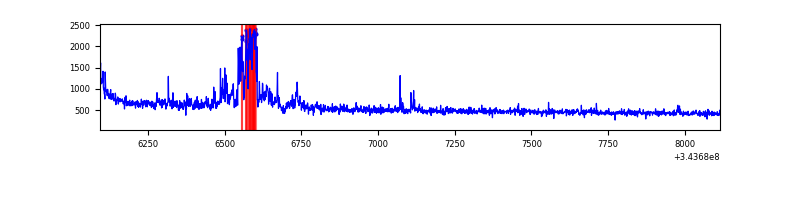 |
| D | 2022 | 2022 | 177 | 177 | 8.75% | 8.75% | 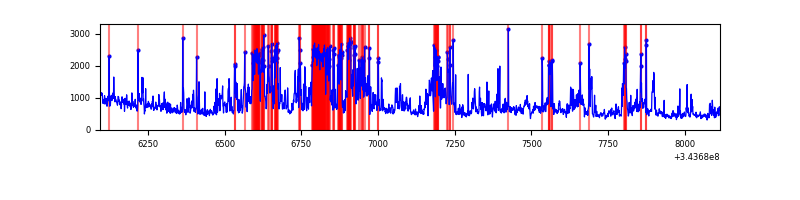 |
Top three noisy pixels from each quadrant. If the there are fewer than three noisy pixels in the level2.evt file, extra rows are filled as -1
| Pixel properties | Quadrant properties | ||||||
|---|---|---|---|---|---|---|---|
| Quadrant | DetID | PixID | Counts | Sigma | Mean | Median | Sigma |
| A | 6 | 16 | 20175 | 386.67 | 248 | 242 | 51.6 |
| A | 13 | 254 | 4342 | 79.53 | 248 | 242 | 51.6 |
| A | 13 | 248 | 2355 | 40.99 | 248 | 242 | 51.6 |
| B | 0 | 190 | 9548 | 195.48 | 243 | 237 | 47.6 |
| B | 10 | 245 | 5494 | 110.37 | 243 | 237 | 47.6 |
| B | 12 | 111 | 5238 | 104.99 | 243 | 237 | 47.6 |
| C | 3 | 233 | 208886 | 3619.15 | 238 | 239 | 57.7 |
| C | 14 | 238 | 37980 | 654.65 | 238 | 239 | 57.7 |
| C | 0 | 207 | 2668 | 42.13 | 238 | 239 | 57.7 |
| D | 1 | 52 | 510289 | 8749.91 | 236 | 231 | 58.3 |
| D | 2 | 250 | 224215 | 3842.39 | 236 | 231 | 58.3 |
| D | 13 | 104 | 222170 | 3807.31 | 236 | 231 | 58.3 |
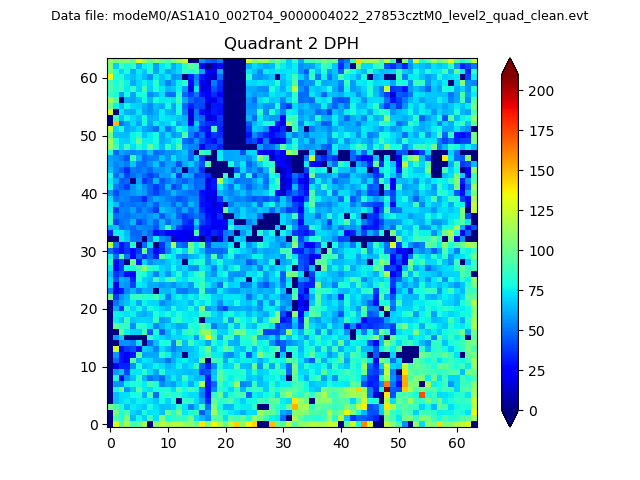
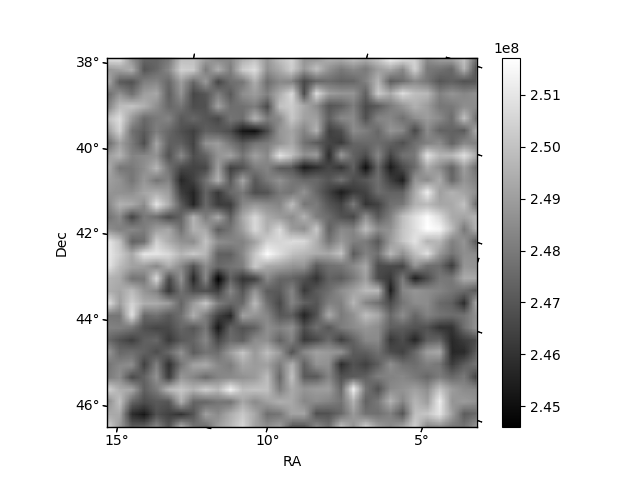
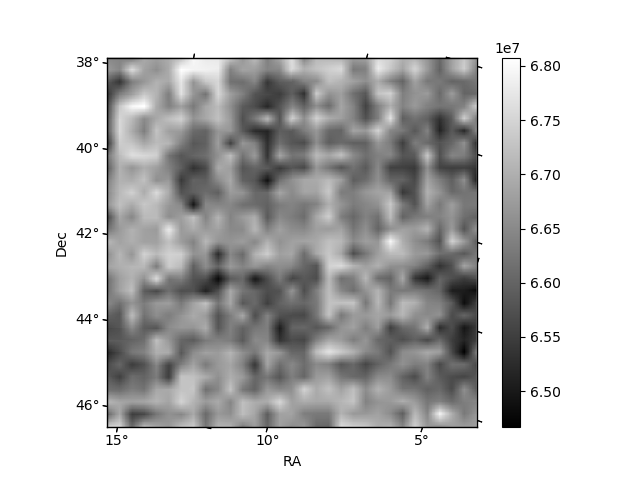
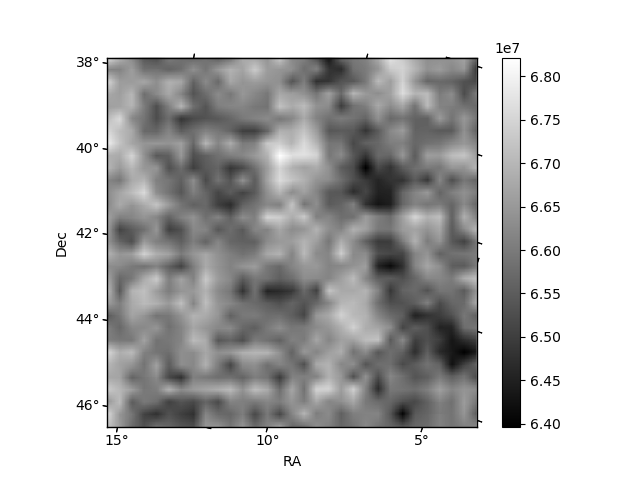
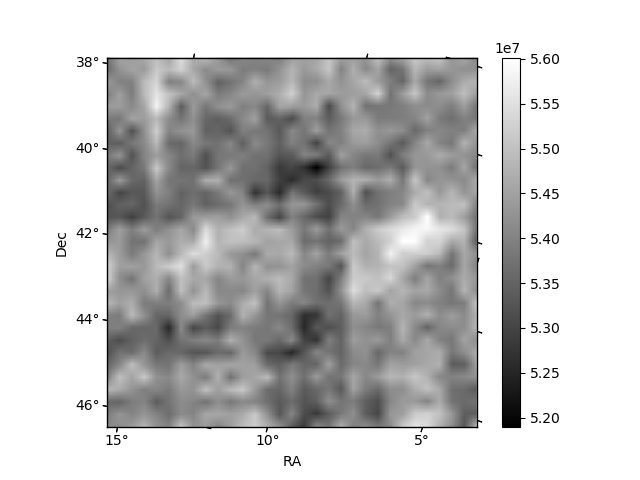
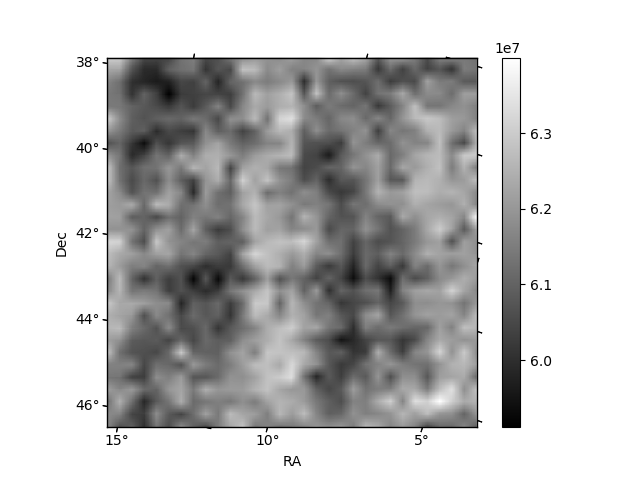
Histogram calculated using DETX and DETY for each event in the final _common_clean file
| Quadrant A | 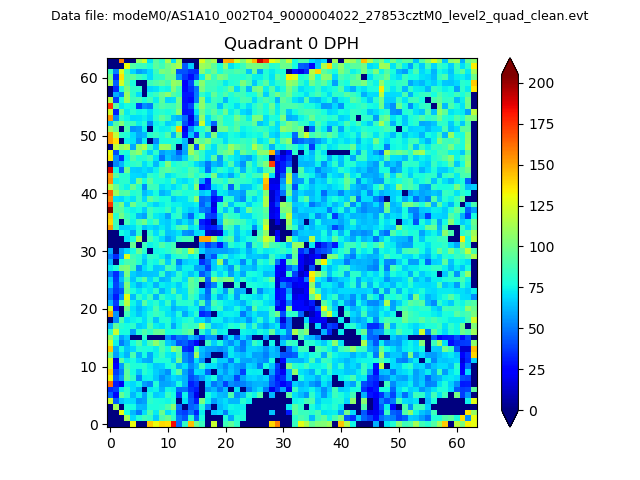 |
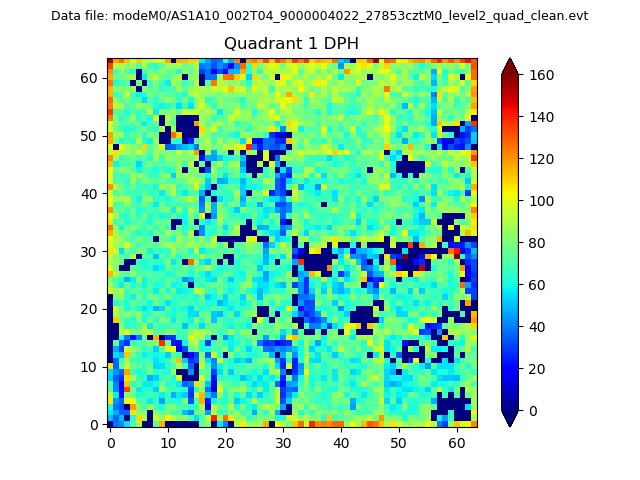 |
Quadrant B |
|---|---|---|---|
| Quadrant D | 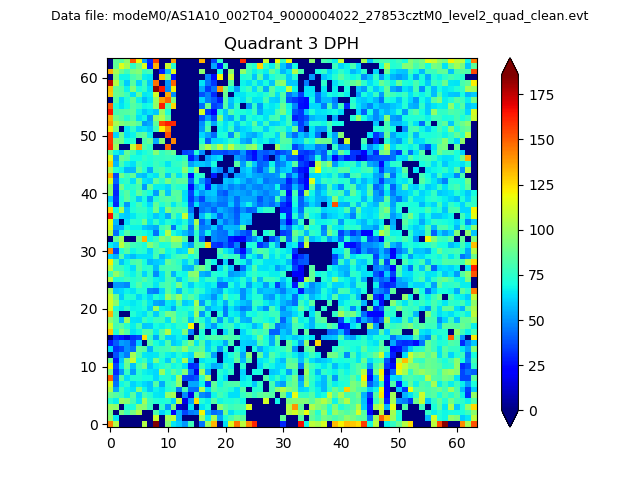 |
 |
Quadrant C |
| Plot type | Count rate plots | Images |
|---|---|---|
| Comparison with Poisson distribution Blue bars denote a histogram of data divided into 1 sec bins. Red curve is a Poisson curve with rate = median count rate of data. |
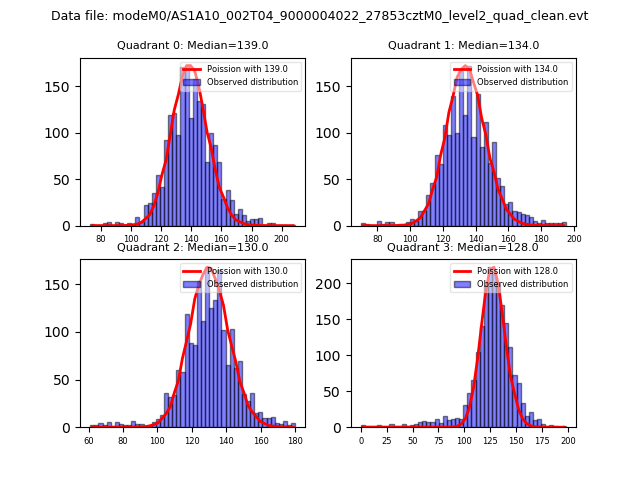 |
 |
| Quadrant-wise count rates Data is divided into 100 sec bins |
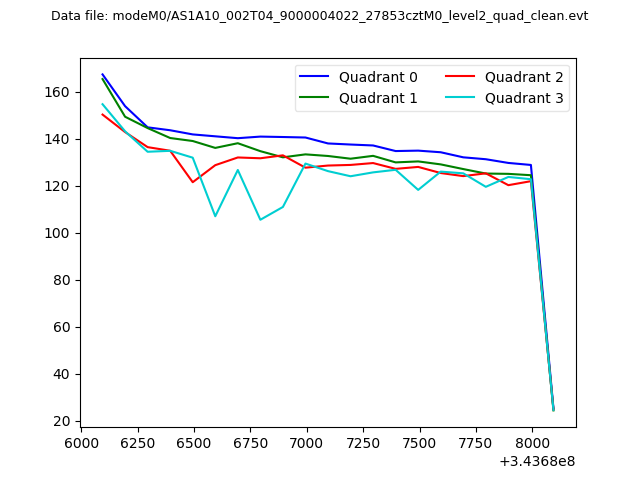 |
|
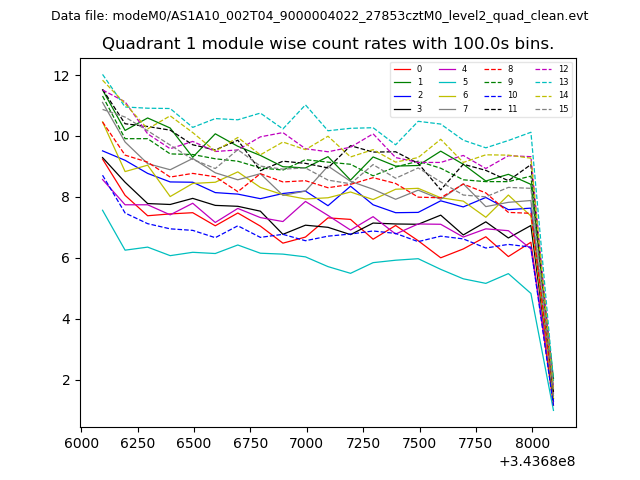
| Module-wise count rates for Quadrant A Data is divided into 100 sec bins |
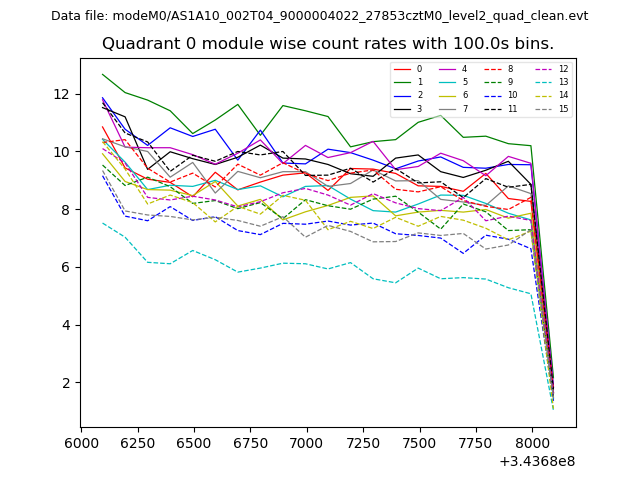 |
 |
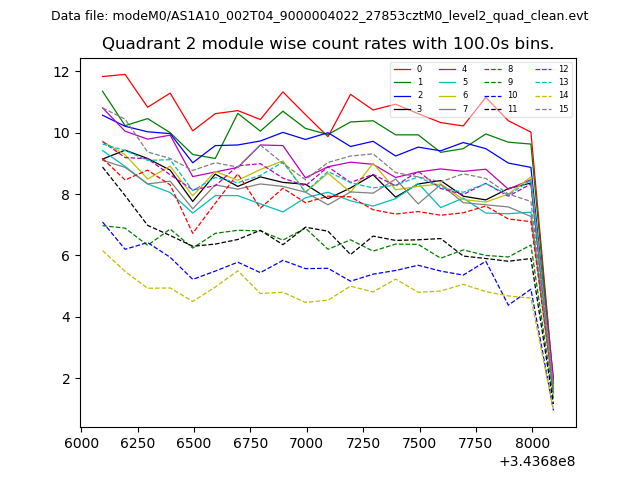
| Module-wise count rates for Quadrant B Data is divided into 100 sec bins |
 |
 |
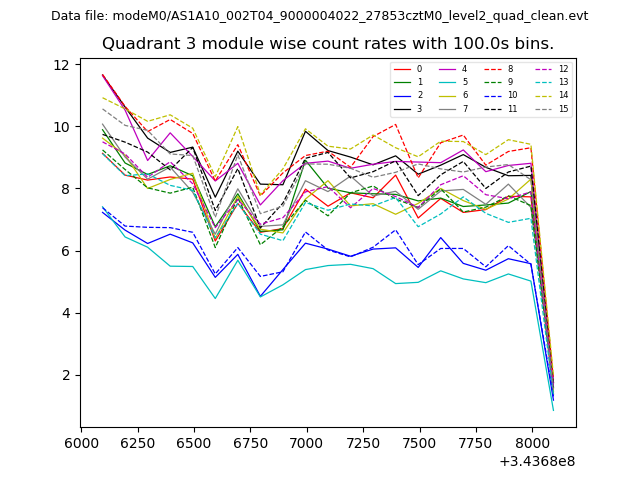
| Module-wise count rates for Quadrant C Data is divided into 100 sec bins |
 |
 |
| Module-wise count rates for Quadrant D Data is divided into 100 sec bins |
 |
 |
| Parameter | Plot |
|---|---|
| CZT HV Monitor |  |
| D_VDD | 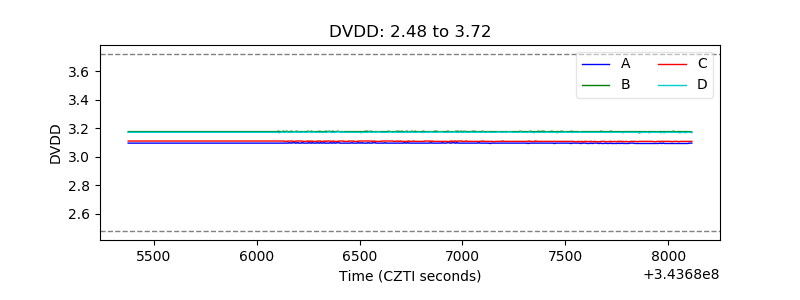 |
| Temperature 1 | 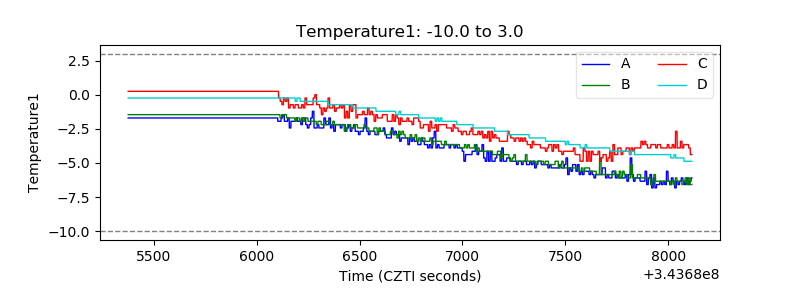 |
| Veto HV Monitor | 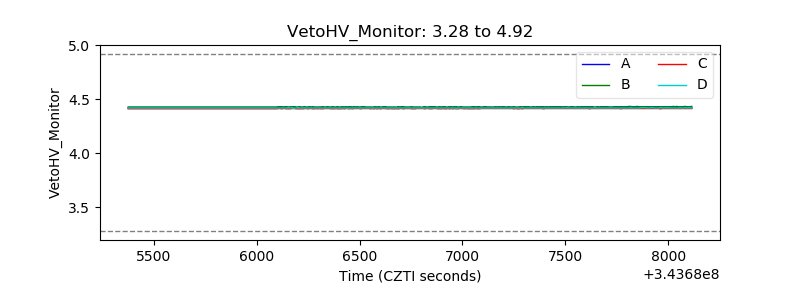 |
| Veto LLD |  |
| Alpha Counter | 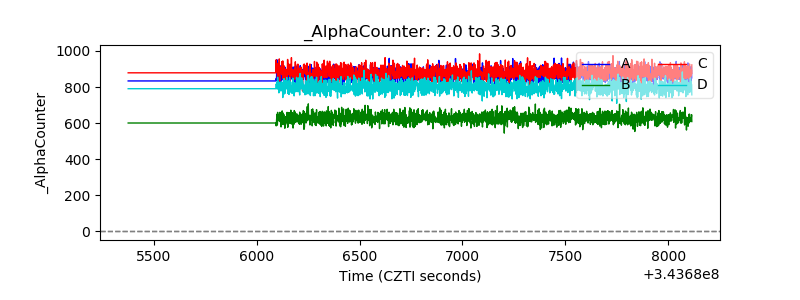 |
| _CPM_Rate | 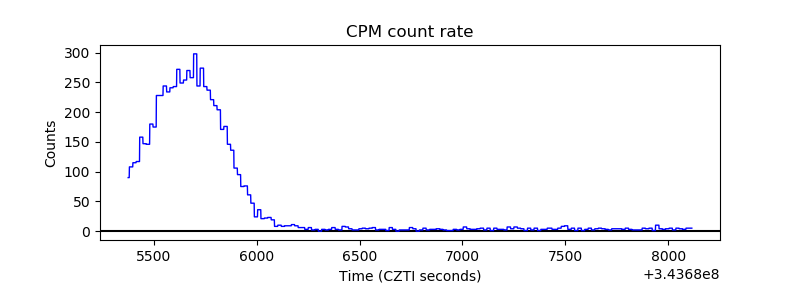 |
| CZT Counter | 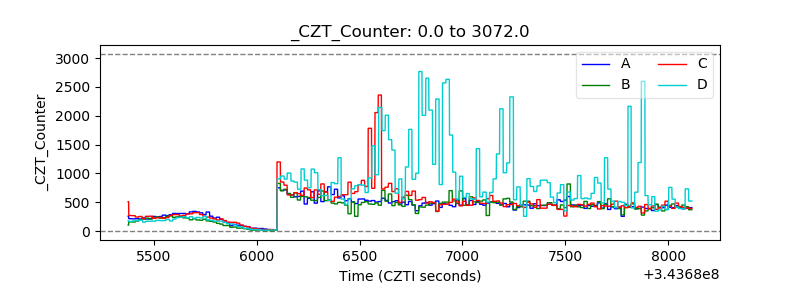 |
| +2.5 Volts monitor |  |
| +5 Volts monitor |  |
| _ROLL_ROT | 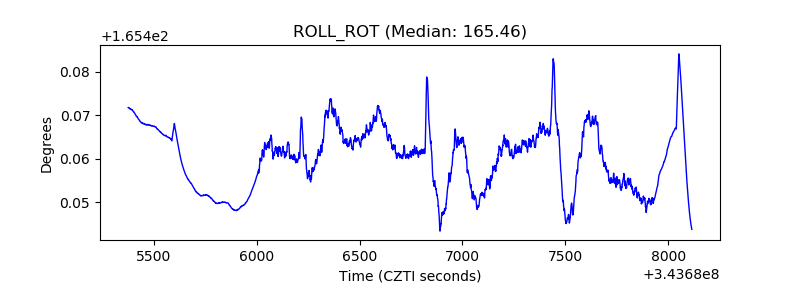 |
| _Roll_DEC | 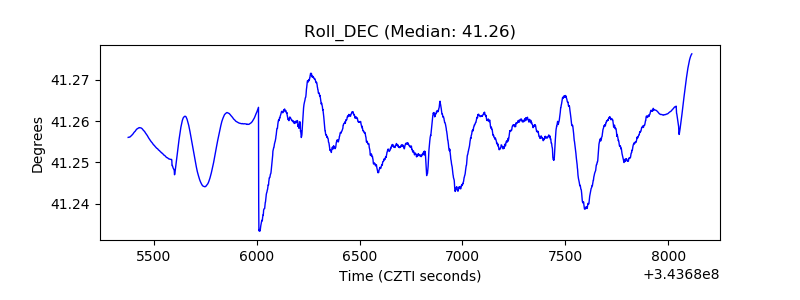 |
| _Roll_RA | 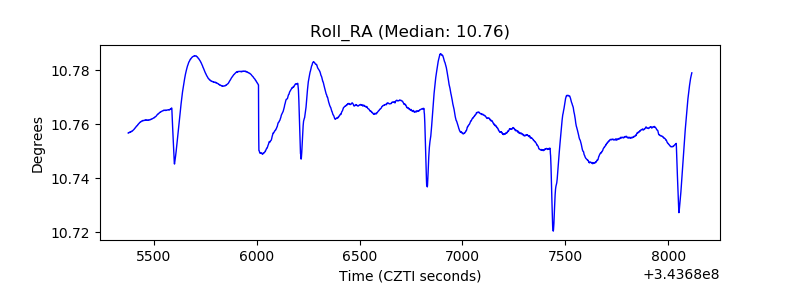 |
| Veto Counter | 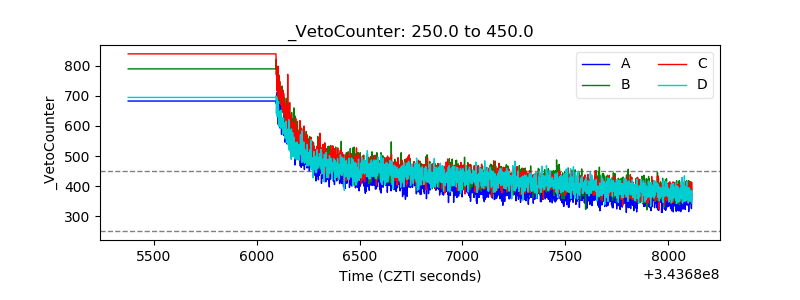 |