| Param | Original file | Final file |
|---|---|---|
| Filename | modeM0/AS1A10_002T05_9000004024_27853cztM0_level2.evt | modeM0/AS1A10_002T05_9000004024_27853cztM0_level2_quad_clean.evt |
| Size (bytes) | 356,898,240 | 58,354,560 |
| Size | 340.4 MB | 55.7 MB |
| Events in quadrant A | 2,310,519 | 369,505 |
| Events in quadrant B | 2,488,954 | 364,880 |
| Events in quadrant C | 2,395,689 | 351,850 |
| Events in quadrant D | 3,288,625 | 345,578 |
| Mode M0 | |||
|---|---|---|---|
| Quadrant | BADHDUFLAG | Total packets | Discarded packets |
| A | 0 | 9902 | 0 |
| B | 0 | 10465 | 0 |
| C | 0 | 10132 | 0 |
| D | 0 | 13000 | 0 |
| Mode M9 | |||
|---|---|---|---|
| Quadrant | BADHDUFLAG | Total packets | Discarded packets |
| A | 0 | 5 | 0 |
| B | 0 | 5 | 0 |
| C | 0 | 5 | 0 |
| D | 0 | 5 | 0 |
| Quadrant | Total seconds | Saturated seconds | Saturation percentage |
|---|---|---|---|
| A | 4770 | 21 | 0.440252% |
| B | 4770 | 54 | 1.132075% |
| C | 4770 | 71 | 1.488470% |
| D | 4770 | 112 | 2.348008% |
Noise dominated data is calculated using 1-second bins in cleaned event files. If a bin has >2000 counts, and if more than 50% of those come from <1% of pixels, then it is considered to be noise-dominated and hence unusable.
| Quadrant | # 1 sec bins | Bins with >0 counts | Bins with >2000 counts | High rate bins dominated by noise | Noise dominated (total time) | Noise dominated (detector-on time) | Marked lightcurve |
|---|---|---|---|---|---|---|---|
| A | 5320 | 4771 | 0 | 0 | 0.00% | 0.00% | 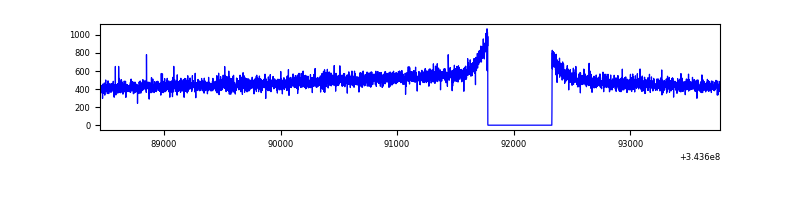 |
| B | 5320 | 4771 | 0 | 0 | 0.00% | 0.00% | 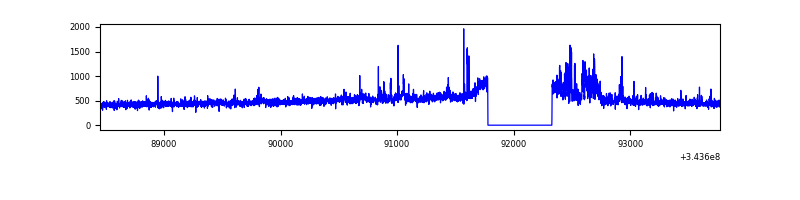 |
| C | 5320 | 4770 | 1 | 1 | 0.02% | 0.02% | 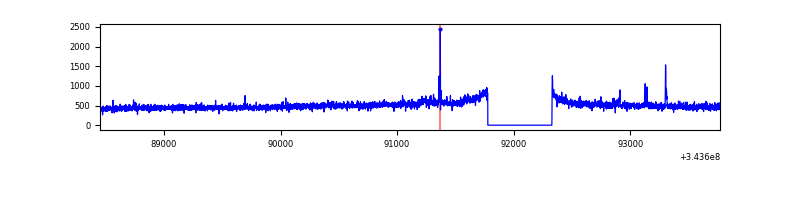 |
| D | 5320 | 4770 | 73 | 73 | 1.37% | 1.53% | 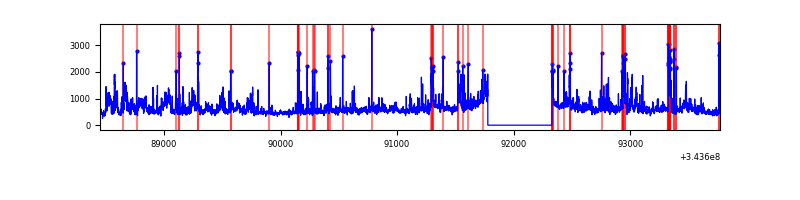 |
Top three noisy pixels from each quadrant. If the there are fewer than three noisy pixels in the level2.evt file, extra rows are filled as -1
| Pixel properties | Quadrant properties | ||||||
|---|---|---|---|---|---|---|---|
| Quadrant | DetID | PixID | Counts | Sigma | Mean | Median | Sigma |
| A | 13 | 254 | 8442 | 64.35 | 597 | 584 | 122.1 |
| A | 3 | 137 | 5838 | 43.03 | 597 | 584 | 122.1 |
| A | 0 | 226 | 5200 | 37.8 | 597 | 584 | 122.1 |
| B | 4 | 52 | 85753 | 741.57 | 591 | 576 | 114.9 |
| B | 0 | 190 | 34158 | 292.37 | 591 | 576 | 114.9 |
| B | 4 | 200 | 16722 | 140.57 | 591 | 576 | 114.9 |
| C | 14 | 238 | 92153 | 675.33 | 569 | 572 | 135.6 |
| C | 3 | 233 | 74668 | 546.4 | 569 | 572 | 135.6 |
| C | 2 | 16 | 5886 | 39.19 | 569 | 572 | 135.6 |
| D | 1 | 52 | 456090 | 3309.06 | 573 | 556 | 137.7 |
| D | 13 | 104 | 386290 | 2802.03 | 573 | 556 | 137.7 |
| D | 2 | 250 | 219543 | 1590.75 | 573 | 556 | 137.7 |
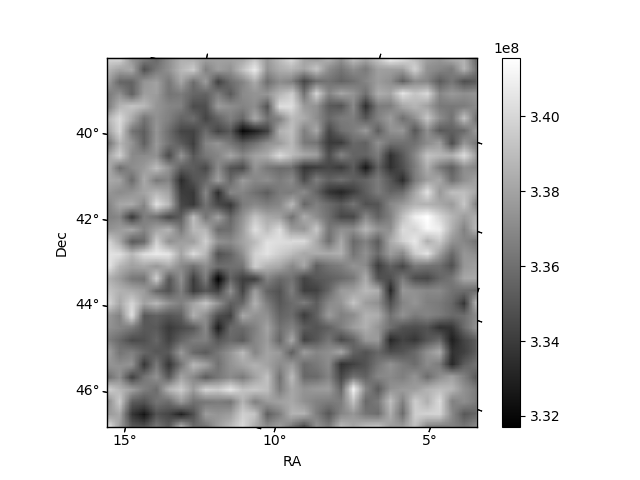
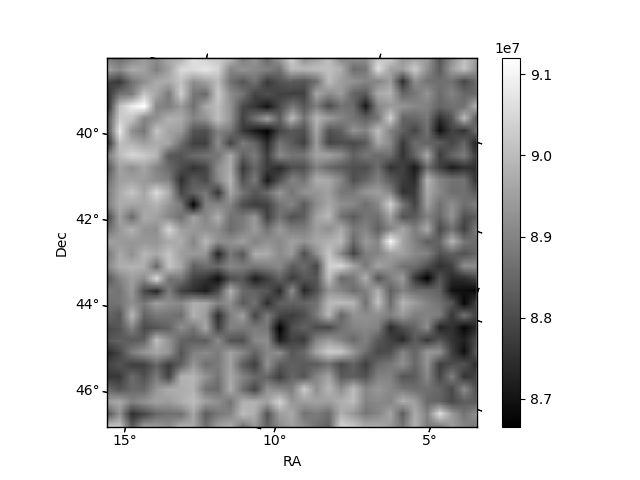
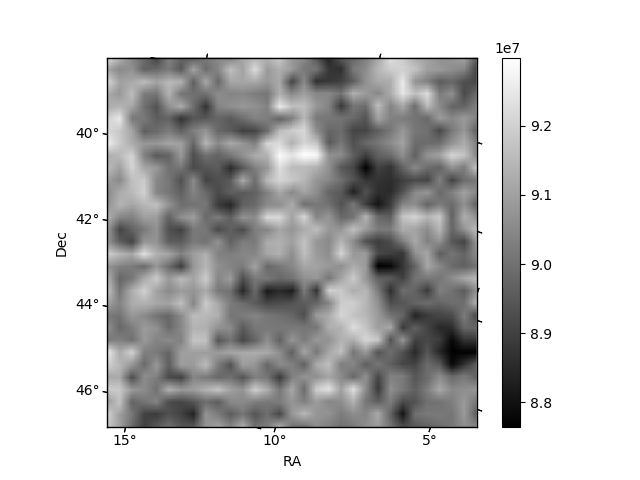
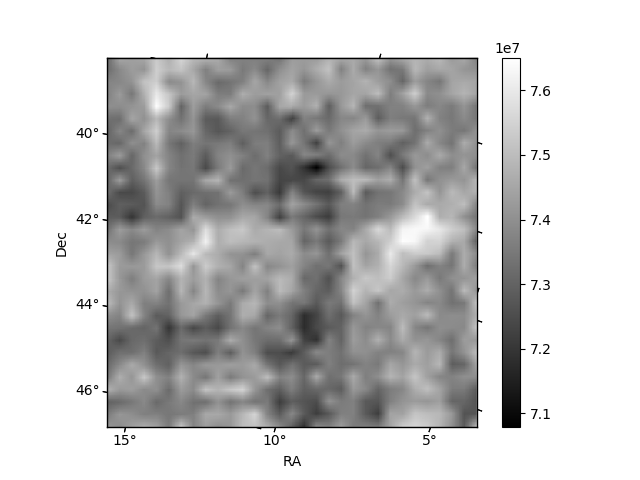
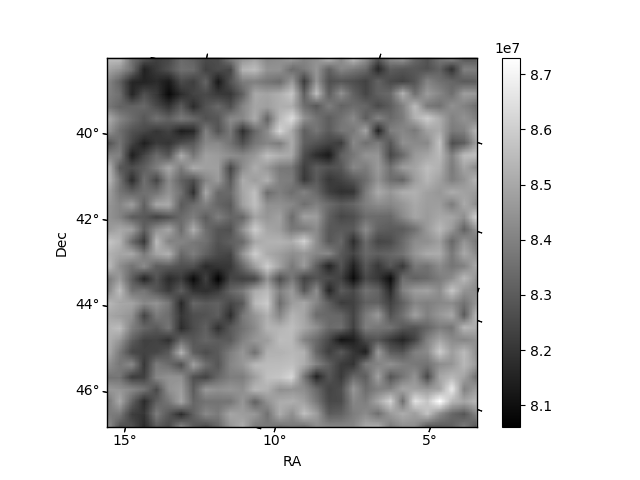
Histogram calculated using DETX and DETY for each event in the final _common_clean file
| Quadrant A | 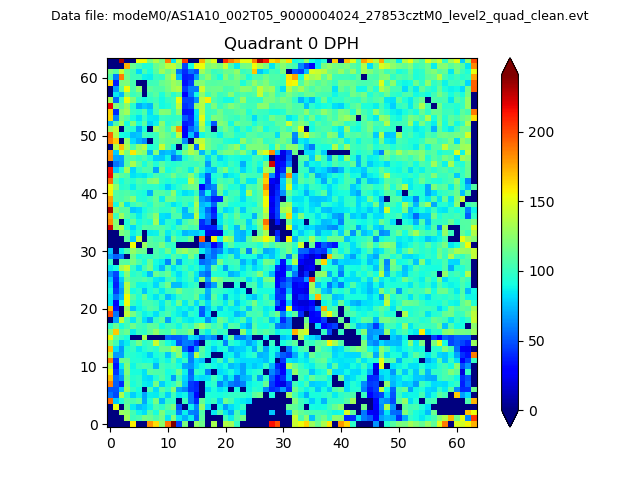 |
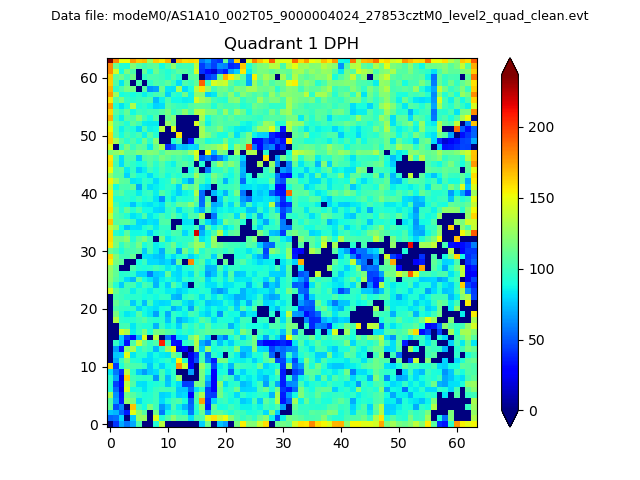 |
Quadrant B |
|---|---|---|---|
| Quadrant D |  |
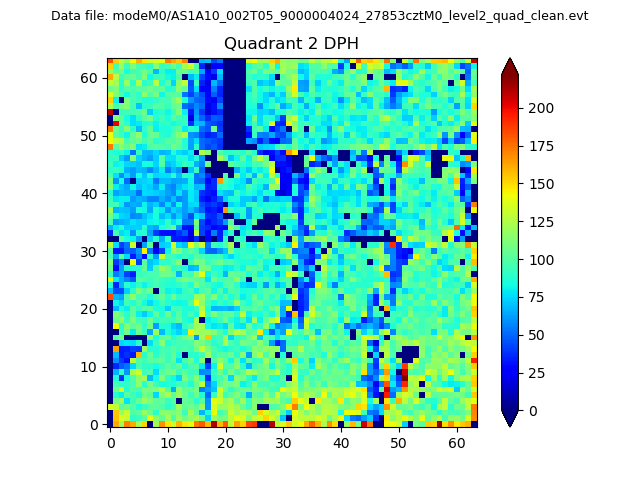 |
Quadrant C |
| Plot type | Count rate plots | Images |
|---|---|---|
| Comparison with Poisson distribution Blue bars denote a histogram of data divided into 1 sec bins. Red curve is a Poisson curve with rate = median count rate of data. |
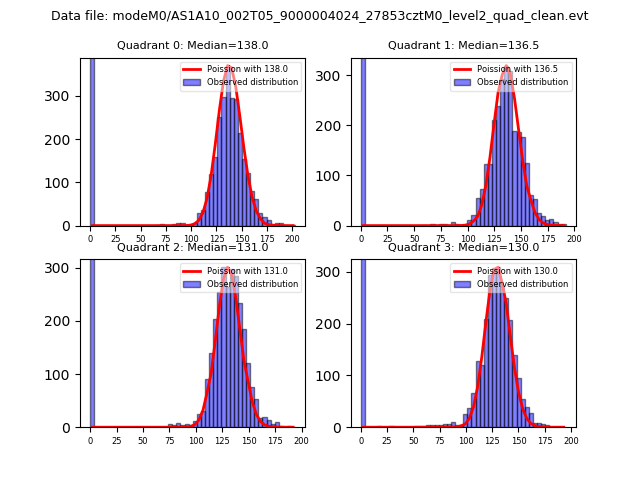 |
 |
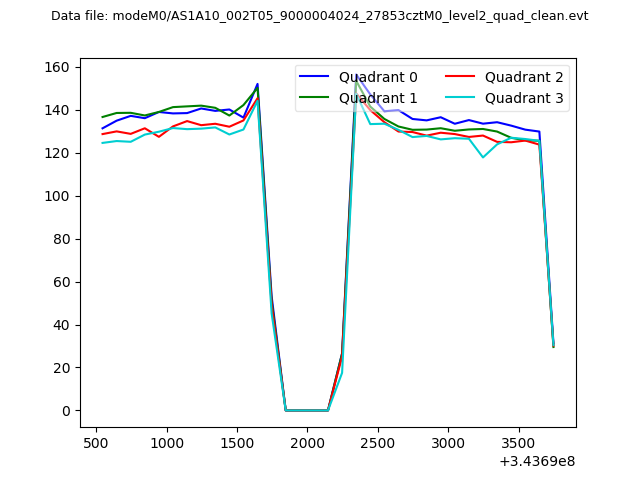
| Quadrant-wise count rates Data is divided into 100 sec bins |
 |
|
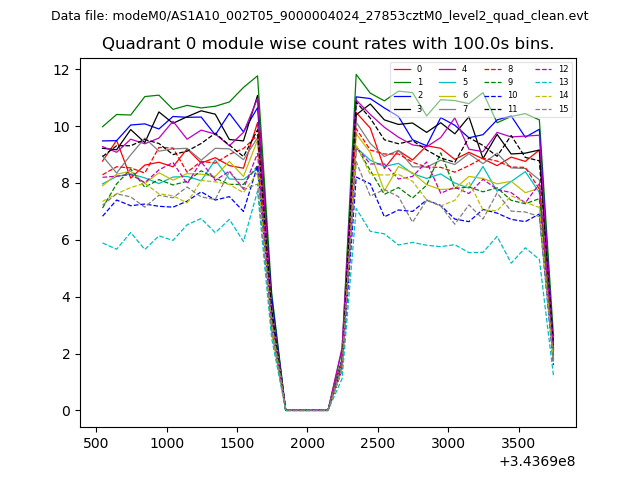
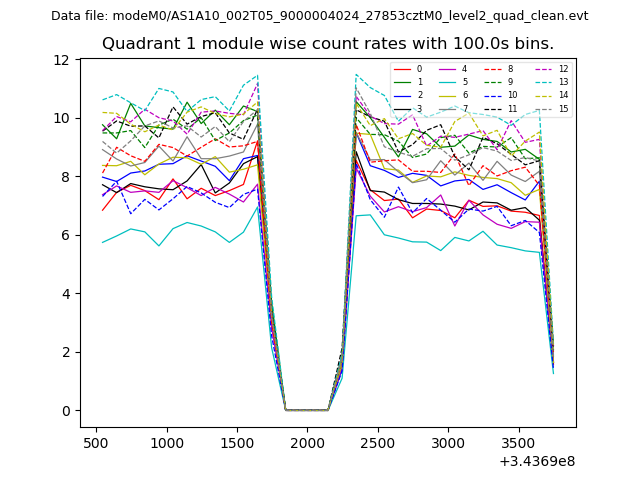
| Module-wise count rates for Quadrant A Data is divided into 100 sec bins |
 |
 |
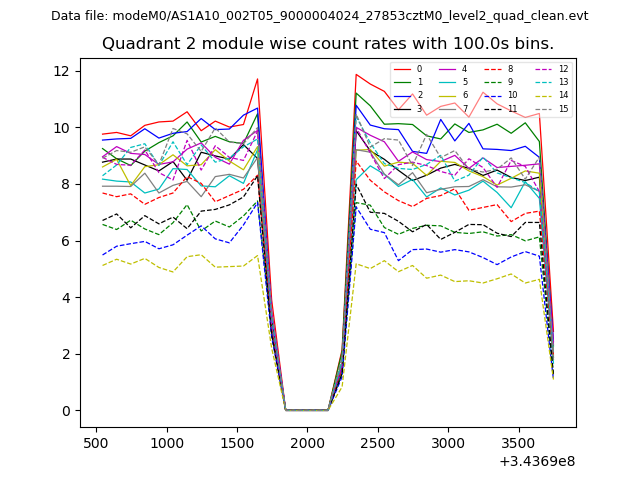
| Module-wise count rates for Quadrant B Data is divided into 100 sec bins |
 |
 |
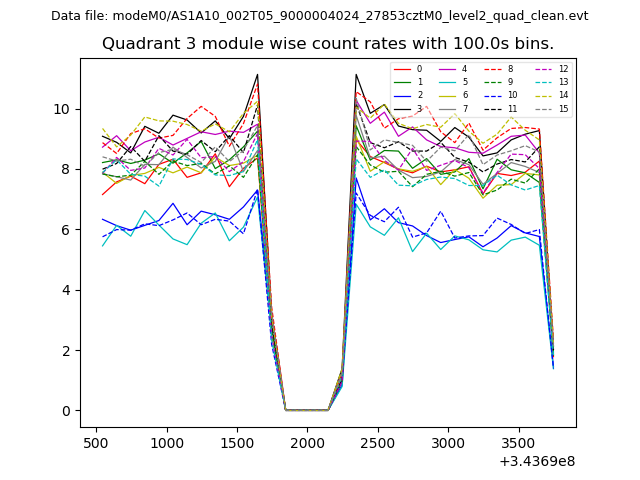
| Module-wise count rates for Quadrant C Data is divided into 100 sec bins |
 |
 |
| Module-wise count rates for Quadrant D Data is divided into 100 sec bins |
 |
 |
| Parameter | Plot |
|---|---|
| CZT HV Monitor | 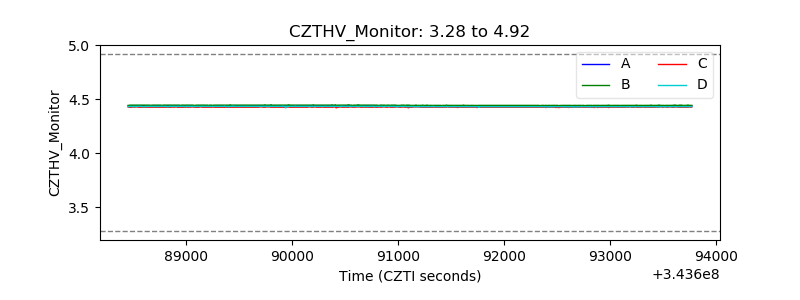 |
| D_VDD | 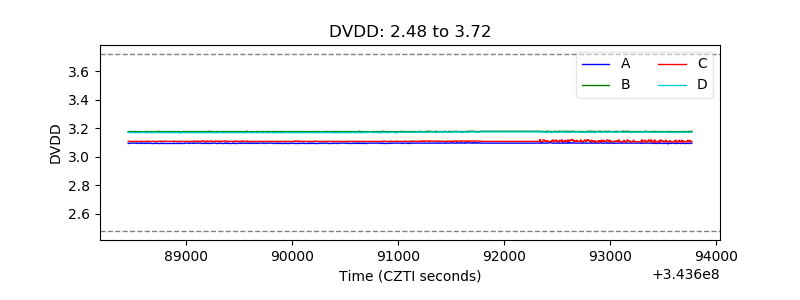 |
| Temperature 1 | 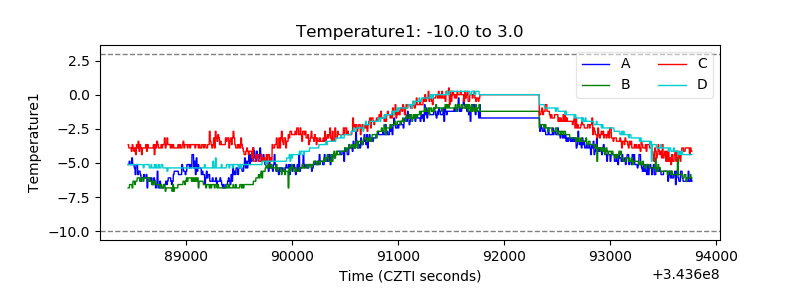 |
| Veto HV Monitor | 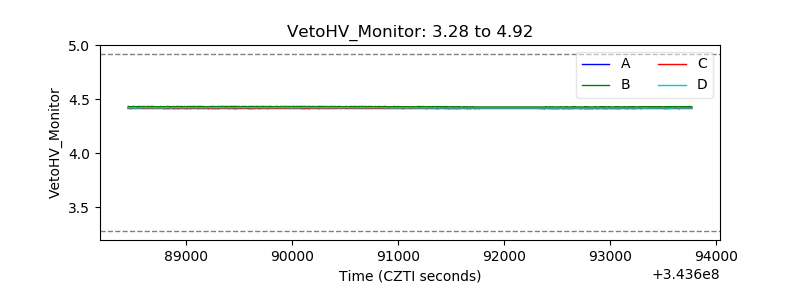 |
| Veto LLD |  |
| Alpha Counter | 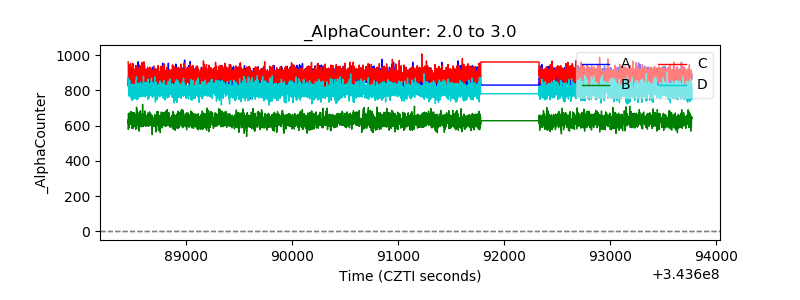 |
| _CPM_Rate | 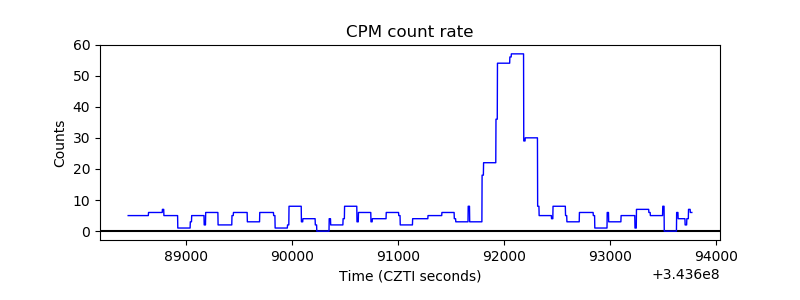 |
| CZT Counter | 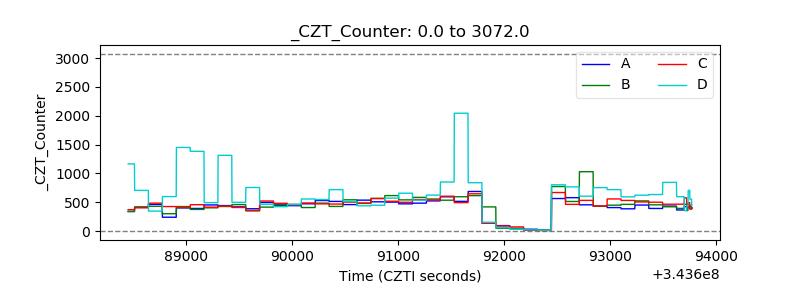 |
| +2.5 Volts monitor |  |
| +5 Volts monitor |  |
| _ROLL_ROT | 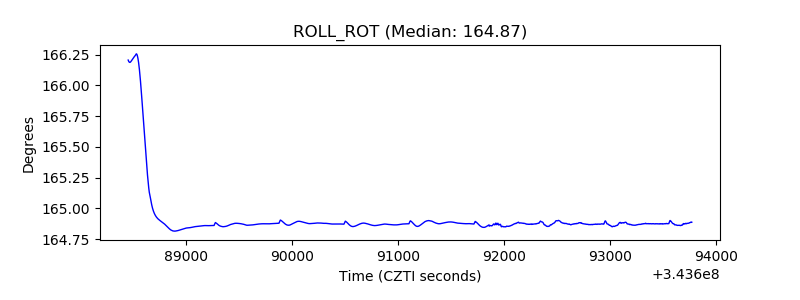 |
| _Roll_DEC | 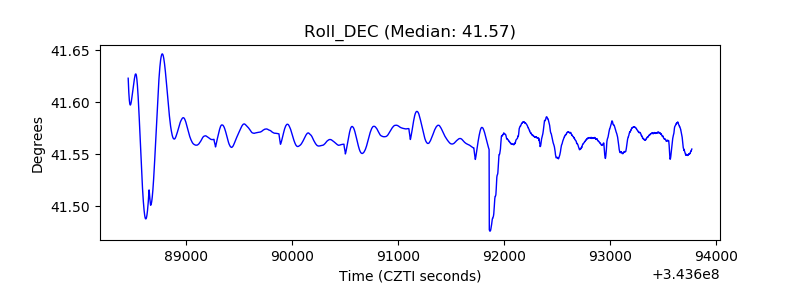 |
| _Roll_RA | 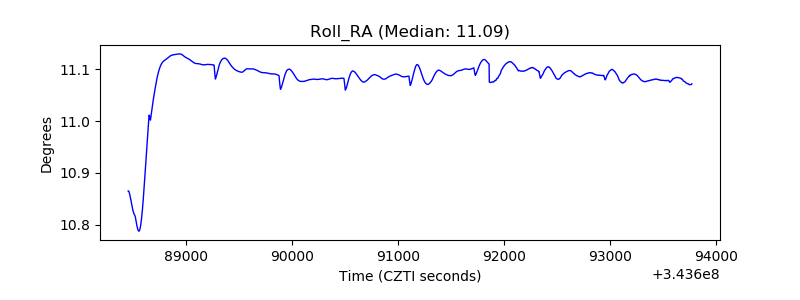 |
| Veto Counter | 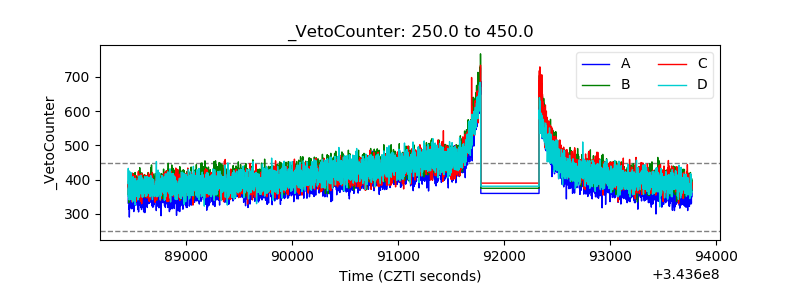 |