| Param | Original file | Final file |
|---|---|---|
| Filename | modeM0/AS1A10_002T05_9000004024_27854cztM0_level2.evt | modeM0/AS1A10_002T05_9000004024_27854cztM0_level2_quad_clean.evt |
| Size (bytes) | 585,213,120 | 119,387,520 |
| Size | 558.1 MB | 113.9 MB |
| Events in quadrant A | 3,864,881 | 789,477 |
| Events in quadrant B | 4,145,289 | 773,853 |
| Events in quadrant C | 4,131,073 | 750,854 |
| Events in quadrant D | 5,038,876 | 744,795 |
| Mode M0 | |||
|---|---|---|---|
| Quadrant | BADHDUFLAG | Total packets | Discarded packets |
| A | 0 | 16766 | 0 |
| B | 0 | 17645 | 0 |
| C | 0 | 17297 | 0 |
| D | 0 | 20437 | 0 |
| Mode M9 | |||
|---|---|---|---|
| Quadrant | BADHDUFLAG | Total packets | Discarded packets |
| A | 0 | 8 | 0 |
| B | 0 | 8 | 0 |
| C | 0 | 8 | 0 |
| D | 0 | 8 | 0 |
| Quadrant | Total seconds | Saturated seconds | Saturation percentage |
|---|---|---|---|
| A | 8007 | 60 | 0.749344% |
| B | 8007 | 141 | 1.760959% |
| C | 8008 | 166 | 2.072927% |
| D | 8007 | 199 | 2.485325% |
Noise dominated data is calculated using 1-second bins in cleaned event files. If a bin has >2000 counts, and if more than 50% of those come from <1% of pixels, then it is considered to be noise-dominated and hence unusable.
| Quadrant | # 1 sec bins | Bins with >0 counts | Bins with >2000 counts | High rate bins dominated by noise | Noise dominated (total time) | Noise dominated (detector-on time) | Marked lightcurve |
|---|---|---|---|---|---|---|---|
| A | 8827 | 8011 | 1 | 1 | 0.01% | 0.01% | 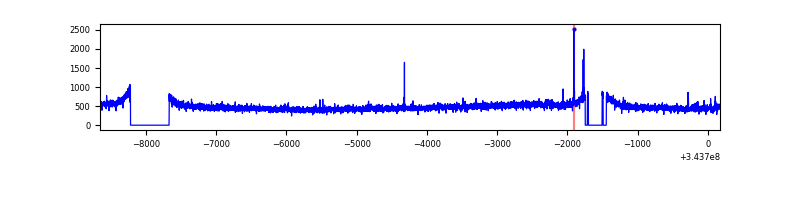 |
| B | 8827 | 8010 | 12 | 12 | 0.14% | 0.15% | 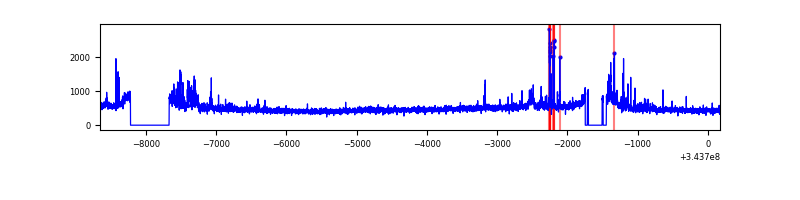 |
| C | 8828 | 8010 | 7 | 7 | 0.08% | 0.09% | 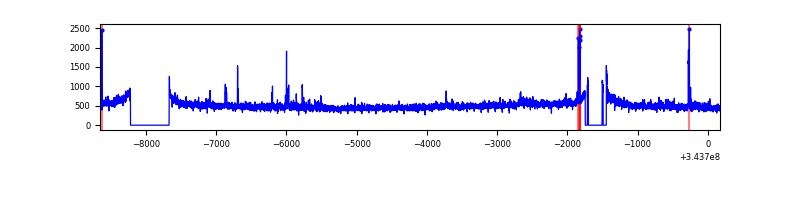 |
| D | 8827 | 8010 | 107 | 107 | 1.21% | 1.34% | 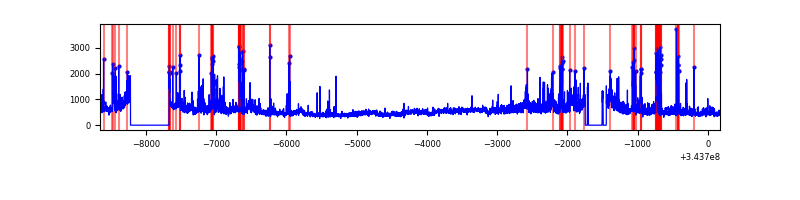 |
Top three noisy pixels from each quadrant. If the there are fewer than three noisy pixels in the level2.evt file, extra rows are filled as -1
| Pixel properties | Quadrant properties | ||||||
|---|---|---|---|---|---|---|---|
| Quadrant | DetID | PixID | Counts | Sigma | Mean | Median | Sigma |
| A | 13 | 254 | 14480 | 67.51 | 989 | 967 | 200.2 |
| A | 15 | 169 | 14274 | 66.48 | 989 | 967 | 200.2 |
| A | 0 | 13 | 13710 | 63.66 | 989 | 967 | 200.2 |
| B | 4 | 52 | 116970 | 621.63 | 976 | 951 | 186.6 |
| B | 10 | 245 | 49503 | 260.14 | 976 | 951 | 186.6 |
| B | 0 | 190 | 38604 | 201.74 | 976 | 951 | 186.6 |
| C | 3 | 233 | 257758 | 1149.05 | 949 | 954 | 223.5 |
| C | 14 | 238 | 148333 | 659.44 | 949 | 954 | 223.5 |
| C | 8 | 128 | 12213 | 50.38 | 949 | 954 | 223.5 |
| D | 1 | 52 | 812739 | 3520.73 | 960 | 934 | 230.6 |
| D | 2 | 250 | 431491 | 1867.29 | 960 | 934 | 230.6 |
| D | 13 | 104 | 70057 | 299.78 | 960 | 934 | 230.6 |
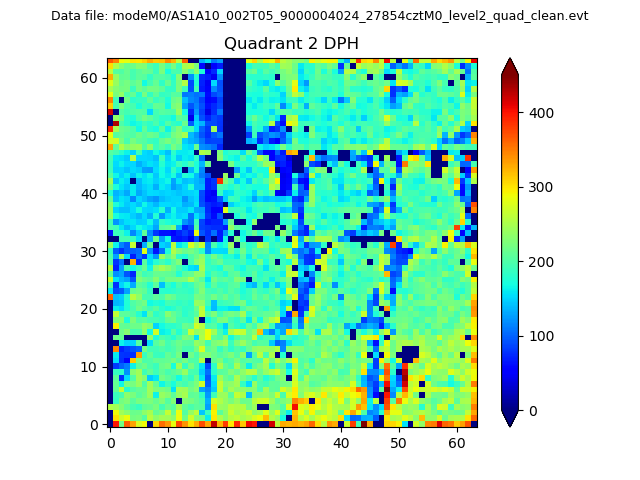
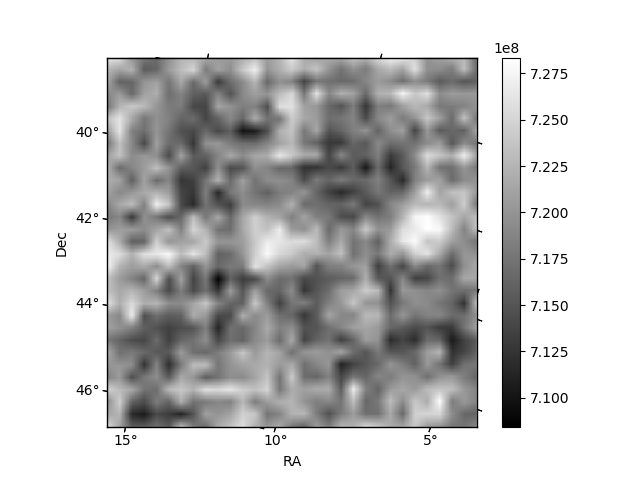
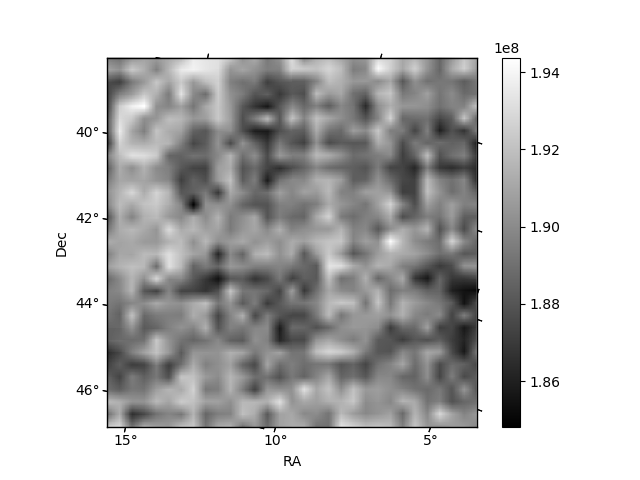
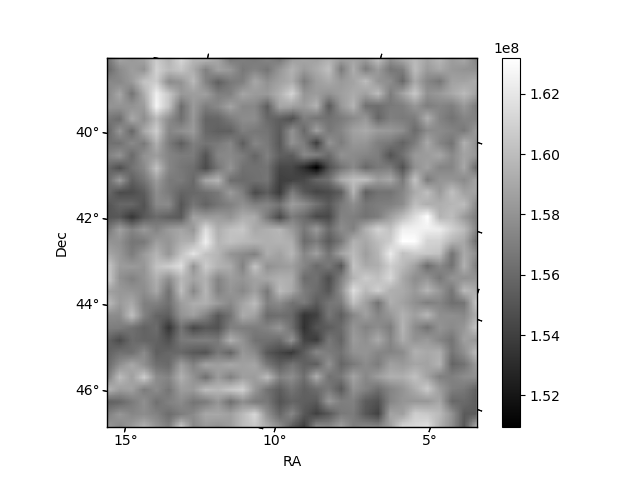
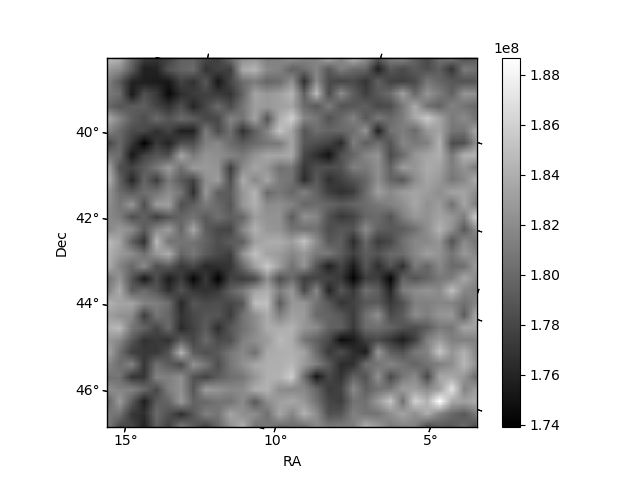
Histogram calculated using DETX and DETY for each event in the final _common_clean file
| Quadrant A | 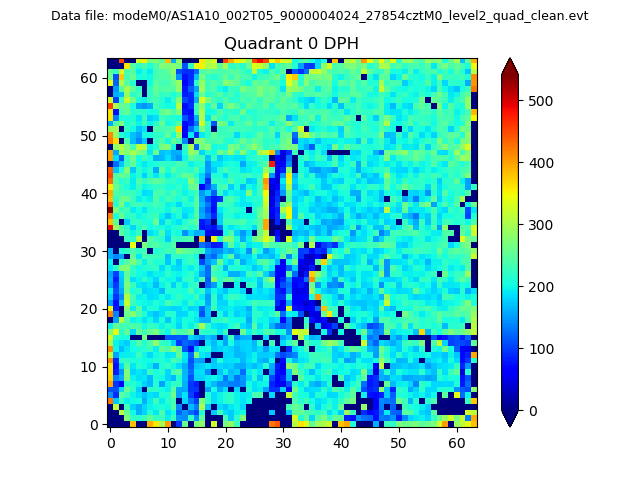 |
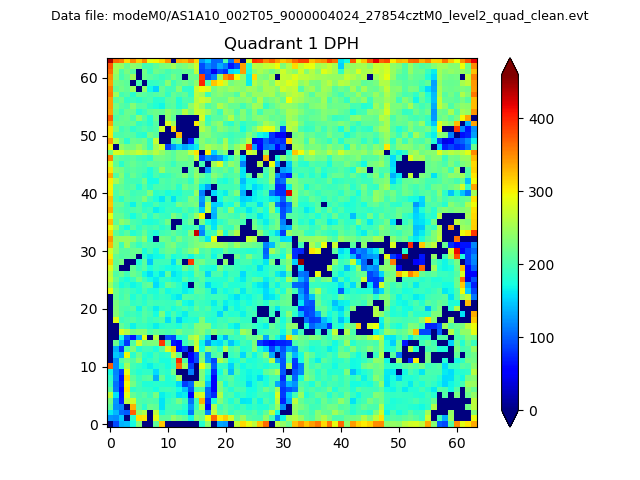 |
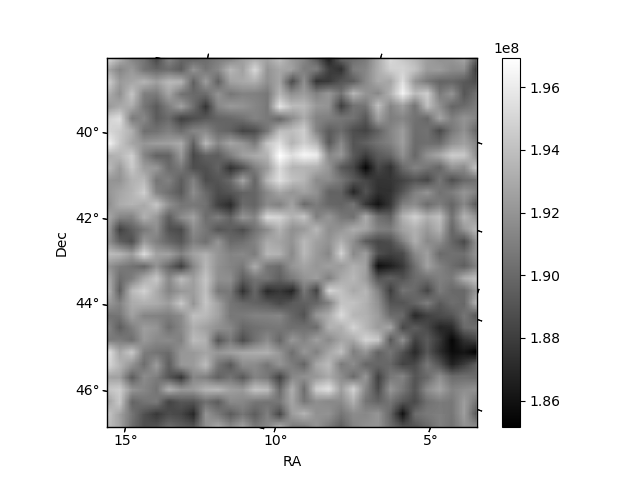
Quadrant B |
|---|---|---|---|
| Quadrant D | 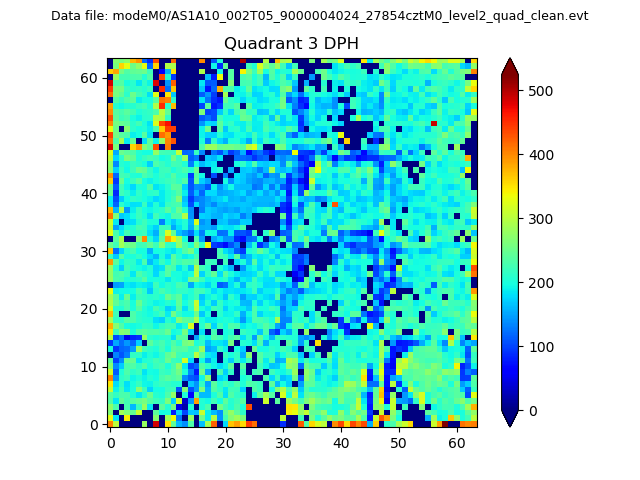 |
 |
Quadrant C |
| Plot type | Count rate plots | Images |
|---|---|---|
| Comparison with Poisson distribution Blue bars denote a histogram of data divided into 1 sec bins. Red curve is a Poisson curve with rate = median count rate of data. |
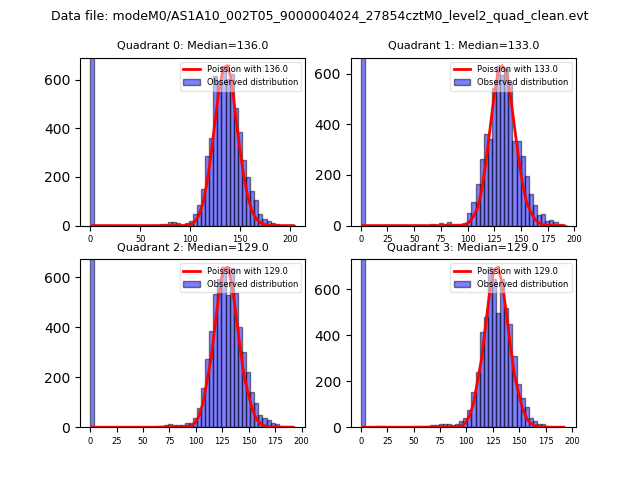 |
 |
| Quadrant-wise count rates Data is divided into 100 sec bins |
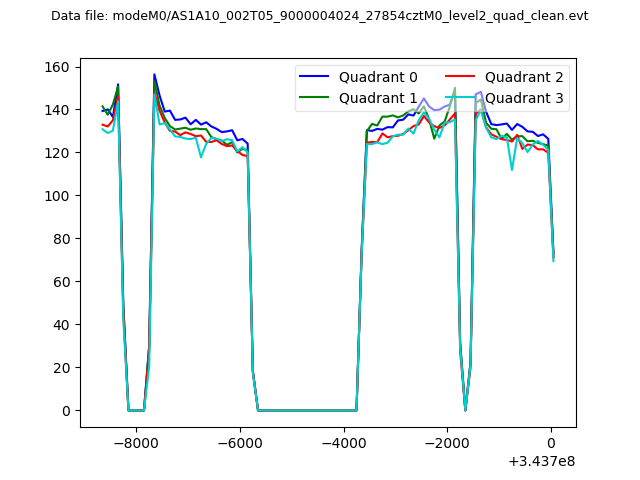 |
|
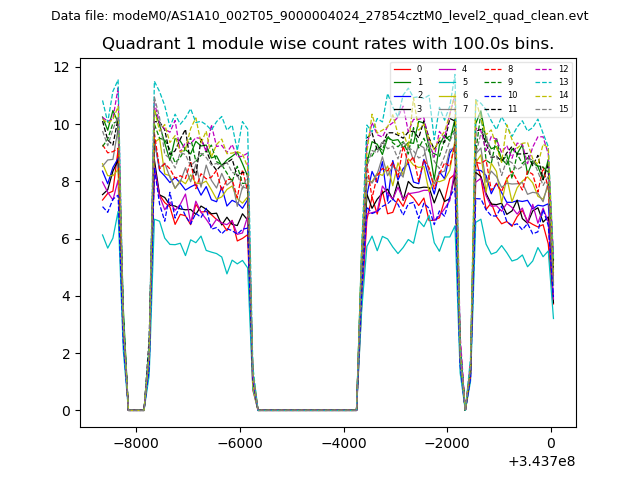
| Module-wise count rates for Quadrant A Data is divided into 100 sec bins |
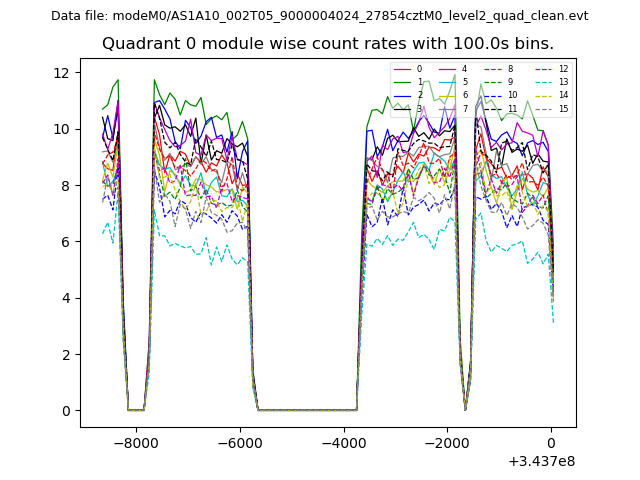 |
 |
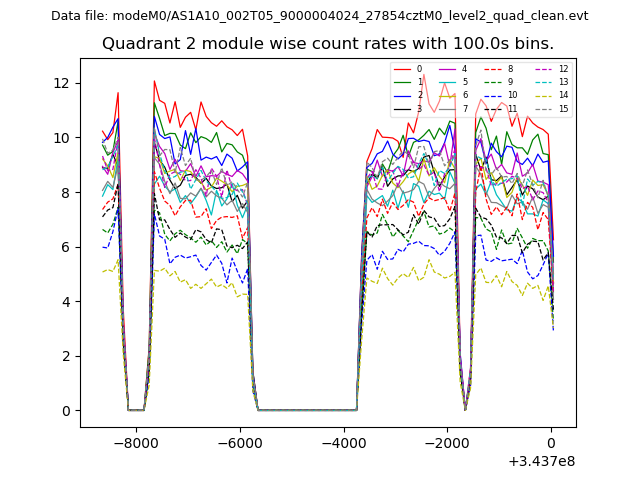
| Module-wise count rates for Quadrant B Data is divided into 100 sec bins |
 |
 |
| Module-wise count rates for Quadrant C Data is divided into 100 sec bins |
 |
 |
| Module-wise count rates for Quadrant D Data is divided into 100 sec bins |
 |
 |
| Parameter | Plot |
|---|---|
| CZT HV Monitor | 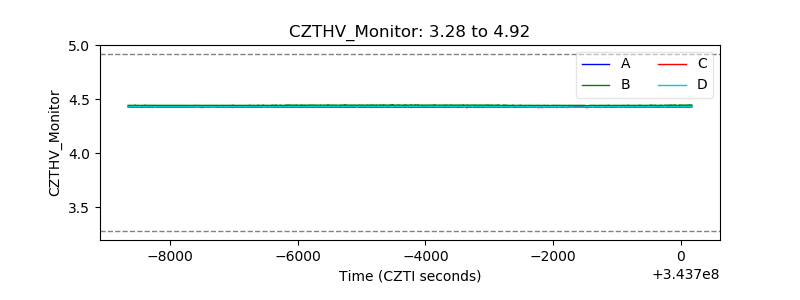 |
| D_VDD | 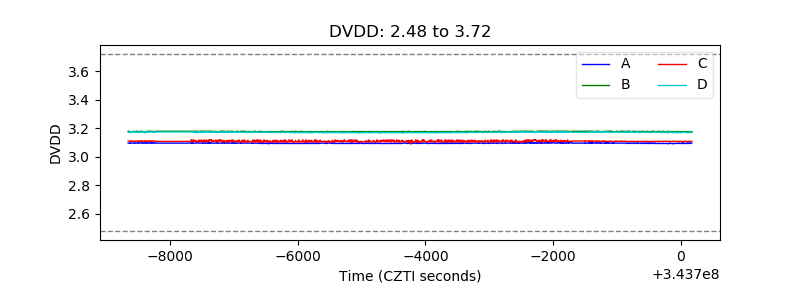 |
| Temperature 1 | 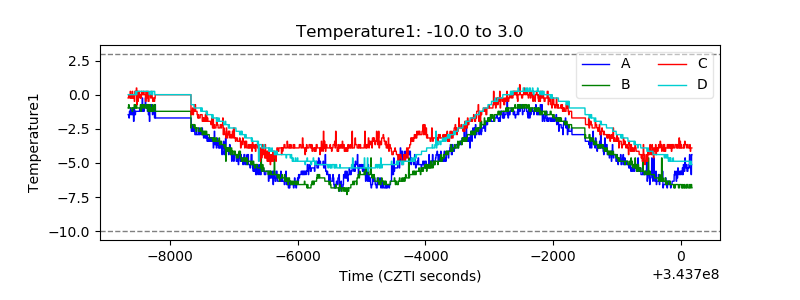 |
| Veto HV Monitor | 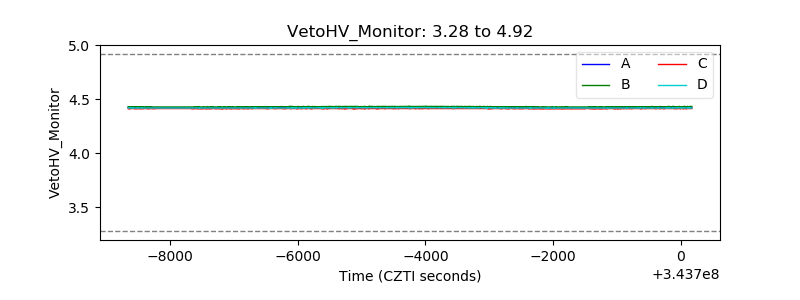 |
| Veto LLD |  |
| Alpha Counter | 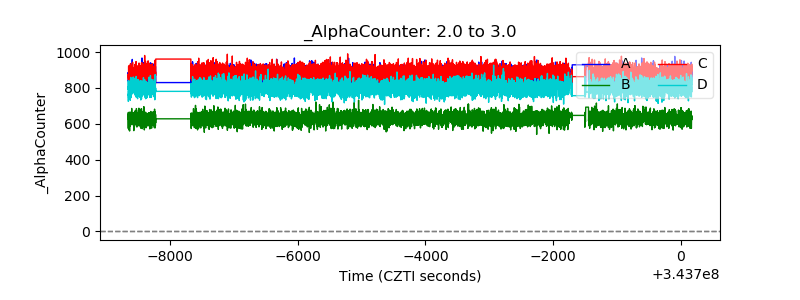 |
| _CPM_Rate | 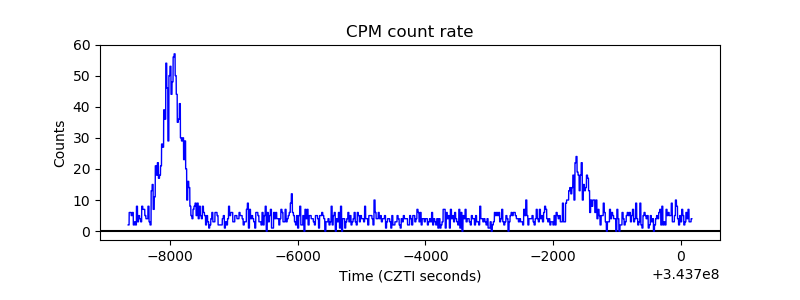 |
| CZT Counter | 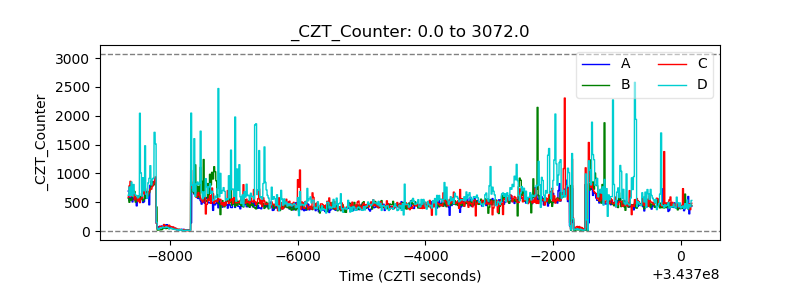 |
| +2.5 Volts monitor |  |
| +5 Volts monitor |  |
| _ROLL_ROT | 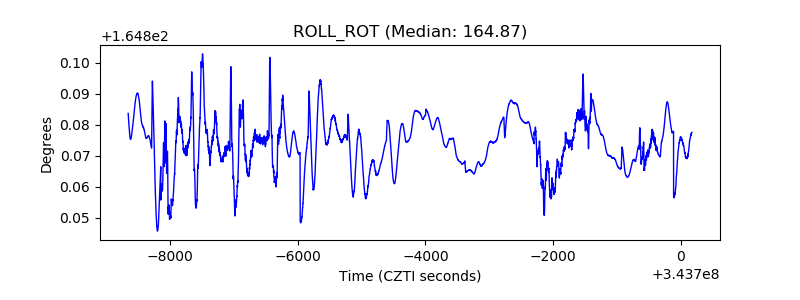 |
| _Roll_DEC | 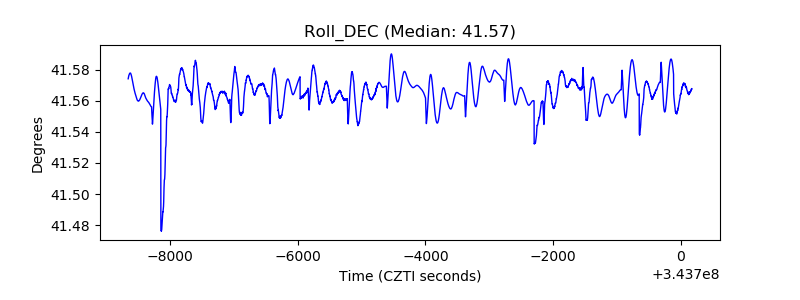 |
| _Roll_RA | 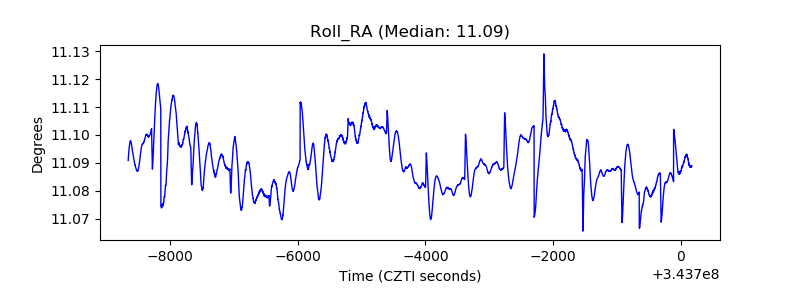 |
| Veto Counter | 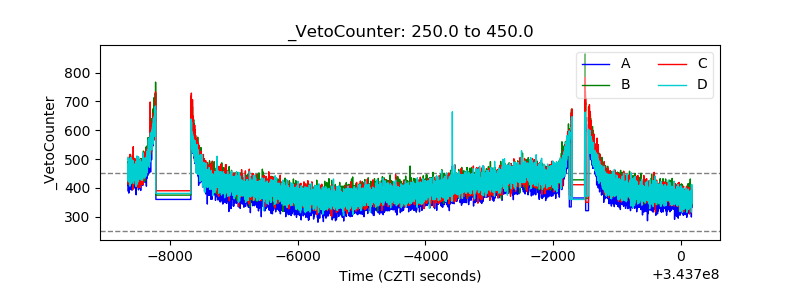 |