| Param | Original file | Final file |
|---|---|---|
| Filename | modeM0/AS1A10_002T05_9000004024_27855cztM0_level2.evt | modeM0/AS1A10_002T05_9000004024_27855cztM0_level2_quad_clean.evt |
| Size (bytes) | 649,555,200 | 120,317,760 |
| Size | 619.5 MB | 114.7 MB |
| Events in quadrant A | 4,271,386 | 792,614 |
| Events in quadrant B | 4,432,680 | 777,573 |
| Events in quadrant C | 4,363,987 | 754,400 |
| Events in quadrant D | 6,028,358 | 729,270 |
| Mode M0 | |||
|---|---|---|---|
| Quadrant | BADHDUFLAG | Total packets | Discarded packets |
| A | 0 | 18129 | 0 |
| B | 0 | 18779 | 0 |
| C | 0 | 18218 | 0 |
| D | 0 | 23796 | 0 |
| Mode M9 | |||
|---|---|---|---|
| Quadrant | BADHDUFLAG | Total packets | Discarded packets |
| A | 0 | 6 | 0 |
| B | 0 | 6 | 0 |
| C | 0 | 6 | 0 |
| D | 0 | 6 | 0 |
| Quadrant | Total seconds | Saturated seconds | Saturation percentage |
|---|---|---|---|
| A | 8498 | 115 | 1.353260% |
| B | 8499 | 170 | 2.000235% |
| C | 8498 | 182 | 2.141680% |
| D | 8498 | 451 | 5.307131% |
Noise dominated data is calculated using 1-second bins in cleaned event files. If a bin has >2000 counts, and if more than 50% of those come from <1% of pixels, then it is considered to be noise-dominated and hence unusable.
| Quadrant | # 1 sec bins | Bins with >0 counts | Bins with >2000 counts | High rate bins dominated by noise | Noise dominated (total time) | Noise dominated (detector-on time) | Marked lightcurve |
|---|---|---|---|---|---|---|---|
| A | 9088 | 8503 | 18 | 18 | 0.20% | 0.21% | 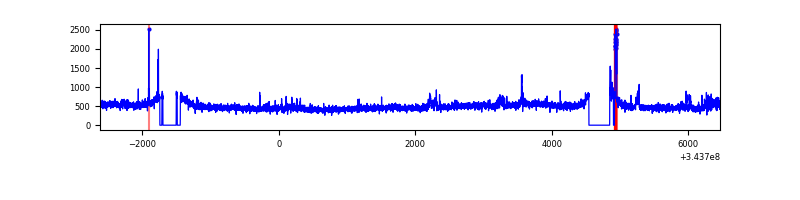 |
| B | 9089 | 8503 | 16 | 16 | 0.18% | 0.19% | 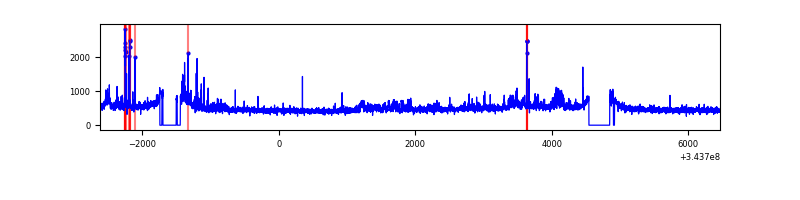 |
| C | 9088 | 8502 | 6 | 6 | 0.07% | 0.07% | 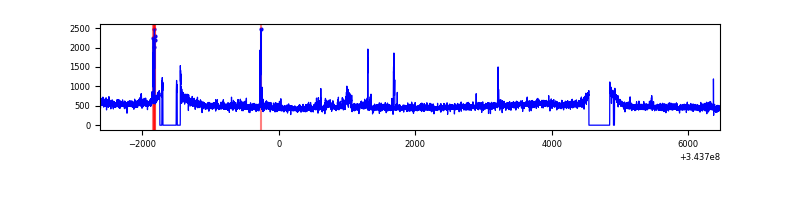 |
| D | 9088 | 8502 | 307 | 307 | 3.38% | 3.61% | 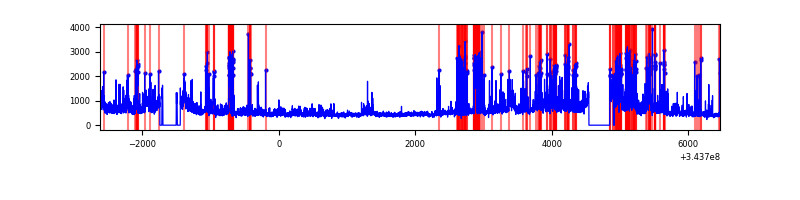 |
Top three noisy pixels from each quadrant. If the there are fewer than three noisy pixels in the level2.evt file, extra rows are filled as -1
| Pixel properties | Quadrant properties | ||||||
|---|---|---|---|---|---|---|---|
| Quadrant | DetID | PixID | Counts | Sigma | Mean | Median | Sigma |
| A | 6 | 16 | 191641 | 896.91 | 1047 | 1021 | 212.5 |
| A | 0 | 13 | 16364 | 72.19 | 1047 | 1021 | 212.5 |
| A | 13 | 254 | 15347 | 67.41 | 1047 | 1021 | 212.5 |
| B | 0 | 229 | 84650 | 428.13 | 1030 | 1002 | 195.4 |
| B | 15 | 33 | 65519 | 330.21 | 1030 | 1002 | 195.4 |
| B | 4 | 52 | 65086 | 328.0 | 1030 | 1002 | 195.4 |
| C | 3 | 233 | 255351 | 1060.33 | 1008 | 1012 | 239.9 |
| C | 14 | 238 | 157446 | 652.17 | 1008 | 1012 | 239.9 |
| C | 10 | 22 | 23403 | 93.35 | 1008 | 1012 | 239.9 |
| D | 1 | 52 | 1759001 | 7167.81 | 1007 | 979 | 245.3 |
| D | 2 | 250 | 369271 | 1501.6 | 1007 | 979 | 245.3 |
| D | 2 | 234 | 37992 | 150.91 | 1007 | 979 | 245.3 |
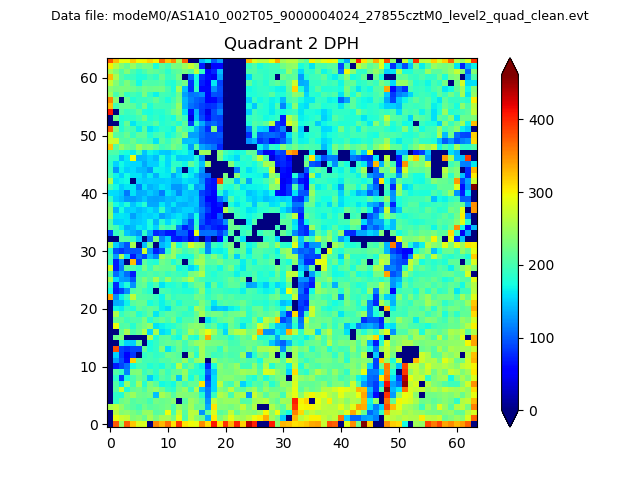
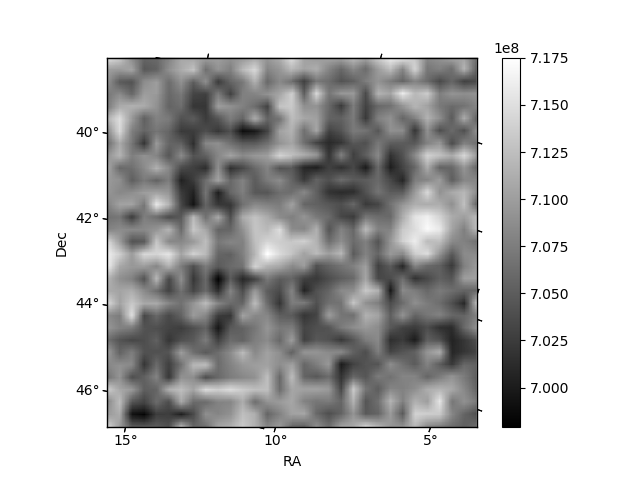
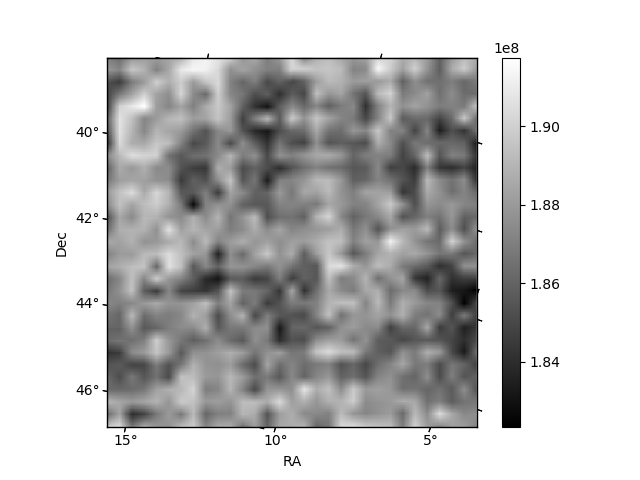
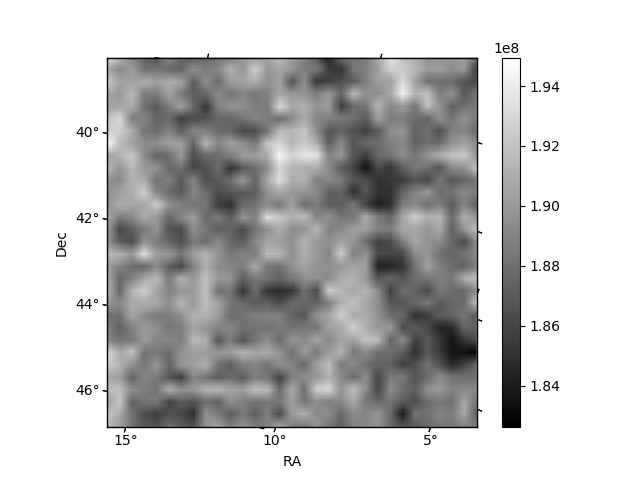
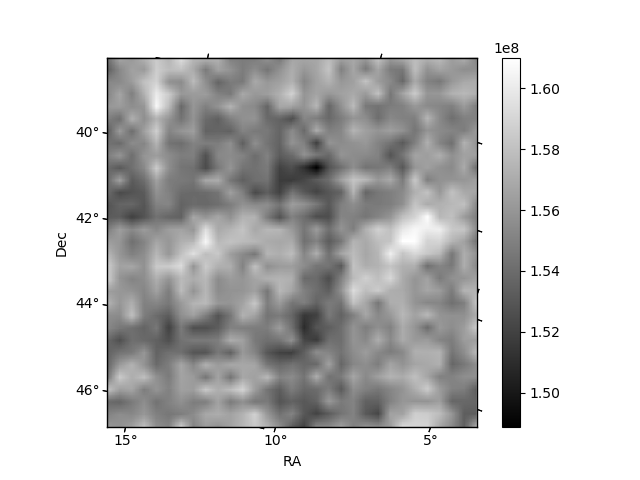
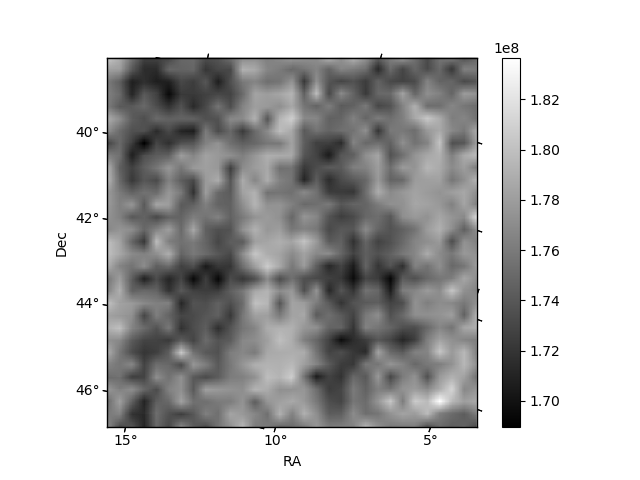
Histogram calculated using DETX and DETY for each event in the final _common_clean file
| Quadrant A | 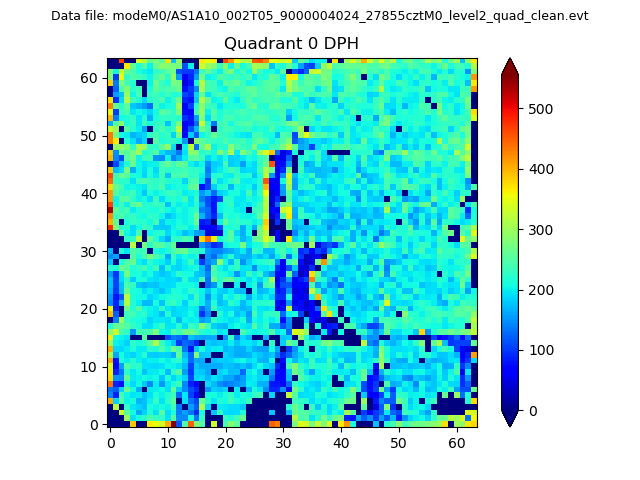 |
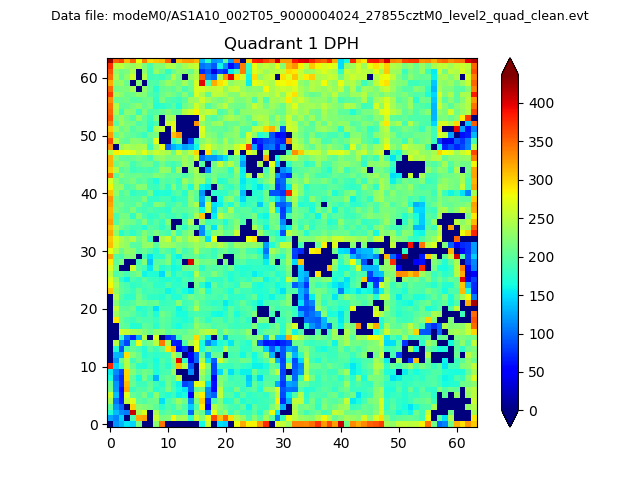 |
Quadrant B |
|---|---|---|---|
| Quadrant D | 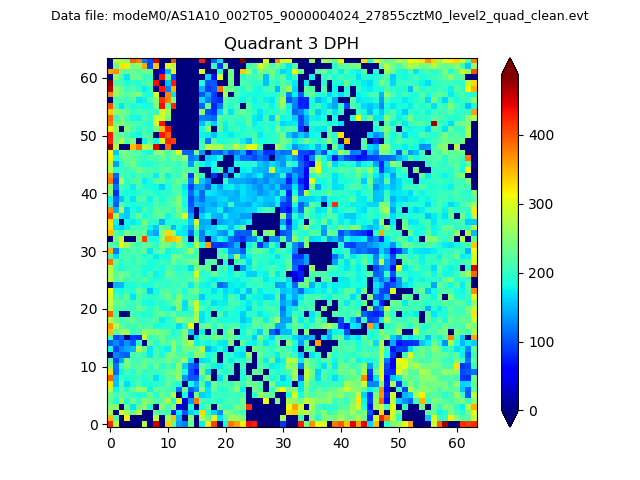 |
 |
Quadrant C |
| Plot type | Count rate plots | Images |
|---|---|---|
| Comparison with Poisson distribution Blue bars denote a histogram of data divided into 1 sec bins. Red curve is a Poisson curve with rate = median count rate of data. |
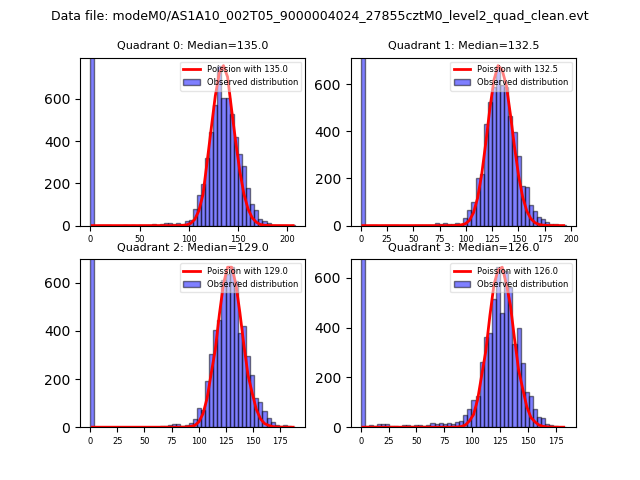 |
 |
| Quadrant-wise count rates Data is divided into 100 sec bins |
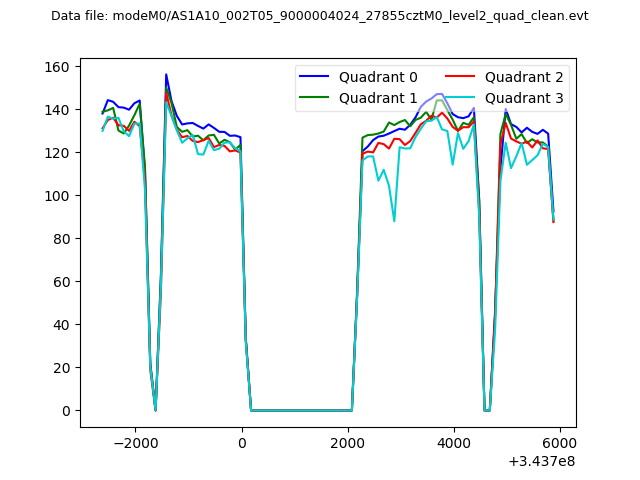 |
|
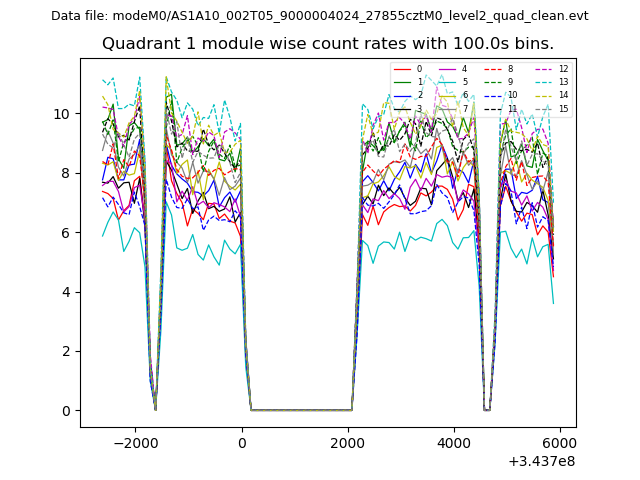
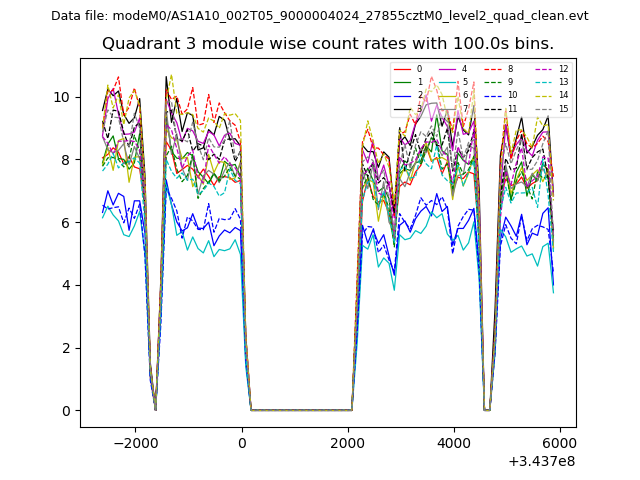
| Module-wise count rates for Quadrant A Data is divided into 100 sec bins |
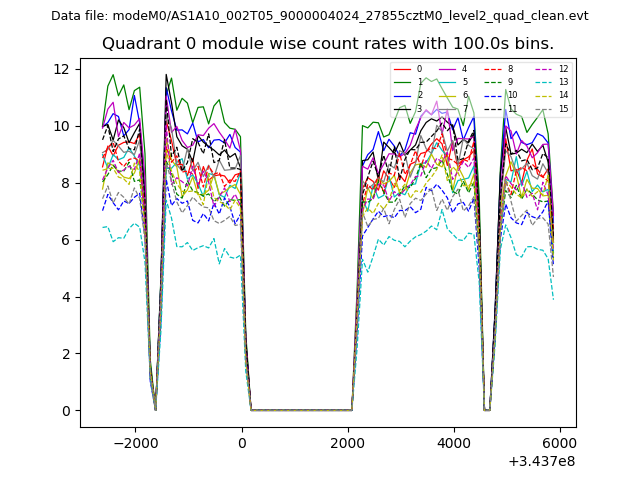 |
 |
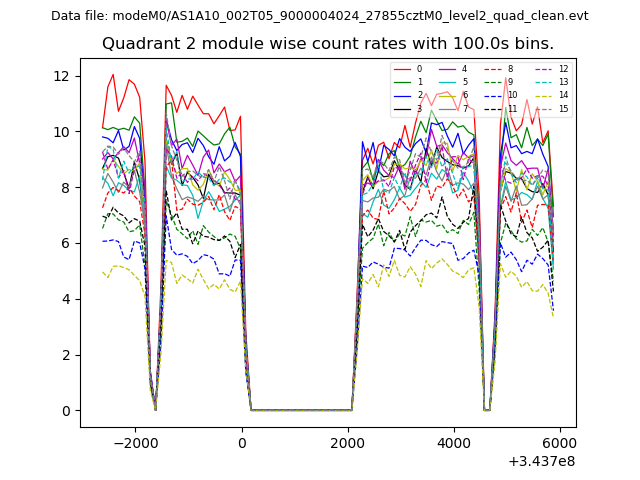
| Module-wise count rates for Quadrant B Data is divided into 100 sec bins |
 |
 |
| Module-wise count rates for Quadrant C Data is divided into 100 sec bins |
 |
 |
| Module-wise count rates for Quadrant D Data is divided into 100 sec bins |
 |
 |
| Parameter | Plot |
|---|---|
| CZT HV Monitor | 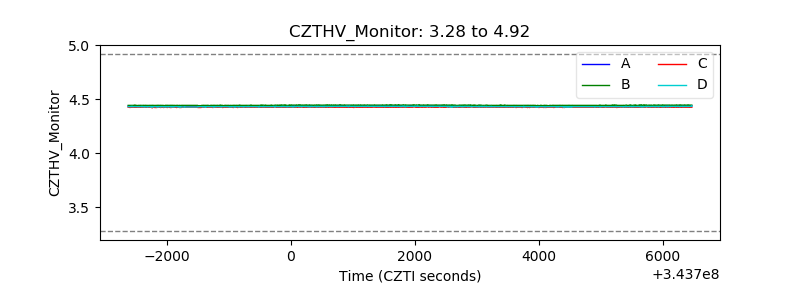 |
| D_VDD | 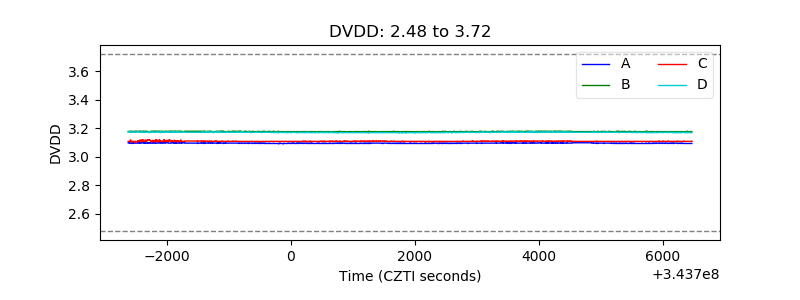 |
| Temperature 1 | 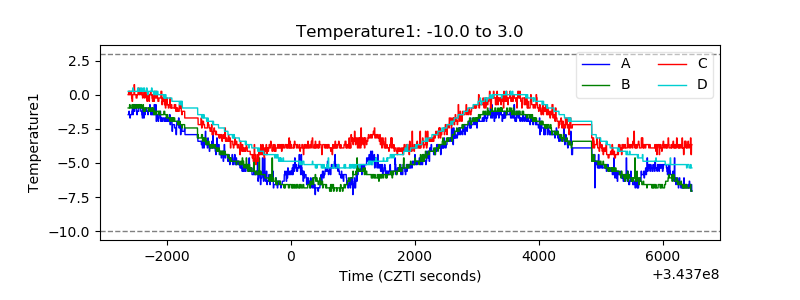 |
| Veto HV Monitor | 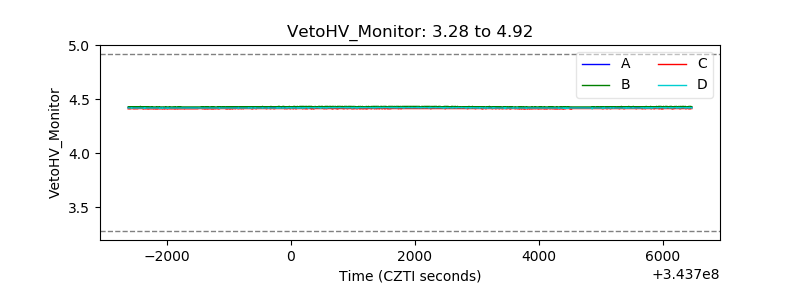 |
| Veto LLD | 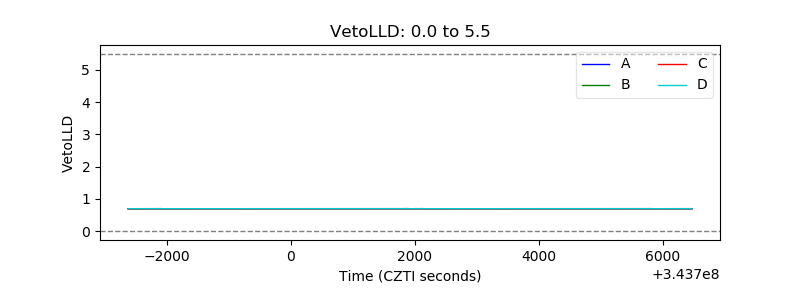 |
| Alpha Counter | 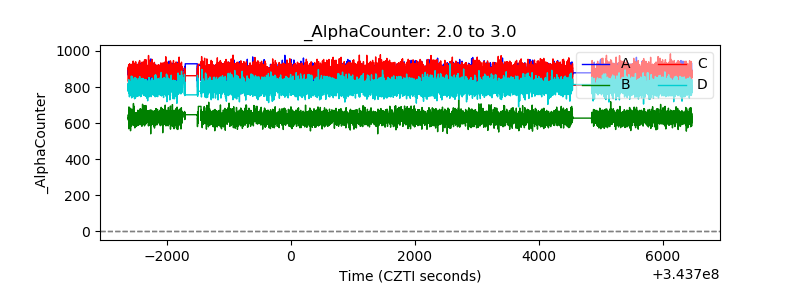 |
| _CPM_Rate | 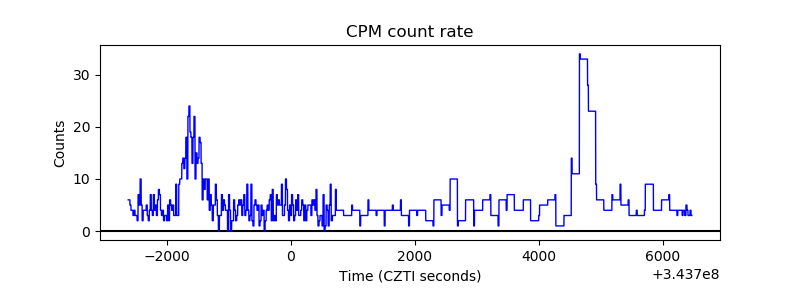 |
| CZT Counter | 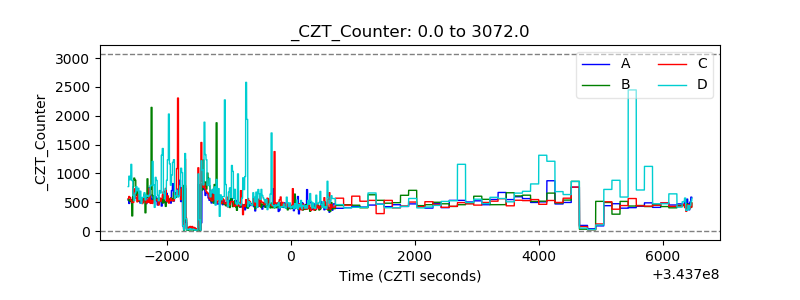 |
| +2.5 Volts monitor |  |
| +5 Volts monitor |  |
| _ROLL_ROT | 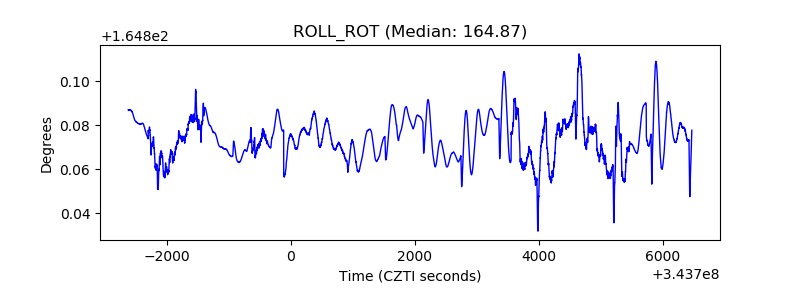 |
| _Roll_DEC | 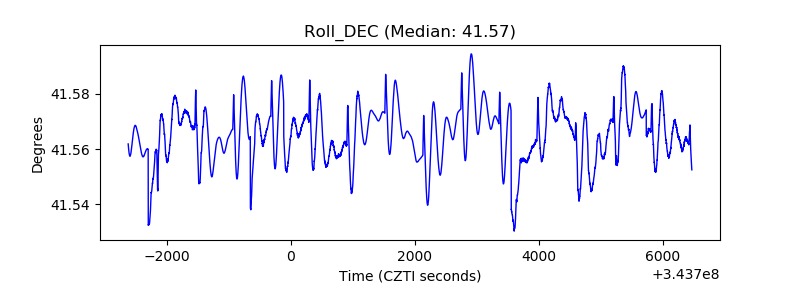 |
| _Roll_RA | 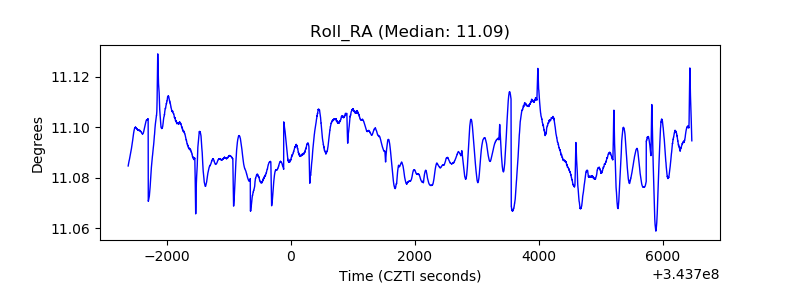 |
| Veto Counter | 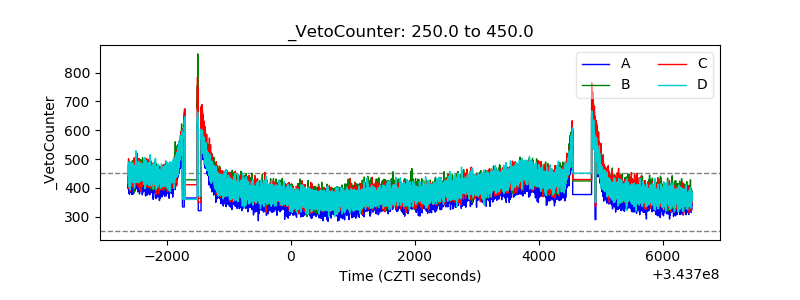 |