| Param | Original file | Final file |
|---|---|---|
| Filename | modeM0/AS1A10_002T05_9000004024_27858cztM0_level2.evt | modeM0/AS1A10_002T05_9000004024_27858cztM0_level2_quad_clean.evt |
| Size (bytes) | 1,369,664,640 | 219,787,200 |
| Size | 1.3 GB | 209.6 MB |
| Events in quadrant A | 8,887,495 | 1,394,761 |
| Events in quadrant B | 9,106,009 | 1,377,513 |
| Events in quadrant C | 9,045,545 | 1,332,131 |
| Events in quadrant D | 13,195,376 | 1,280,556 |
| Mode M0 | |||
|---|---|---|---|
| Quadrant | BADHDUFLAG | Total packets | Discarded packets |
| A | 0 | 38037 | 0 |
| B | 0 | 38816 | 0 |
| C | 0 | 38354 | 0 |
| D | 0 | 51761 | 0 |
| Mode M9 | |||
|---|---|---|---|
| Quadrant | BADHDUFLAG | Total packets | Discarded packets |
| A | 0 | 19 | 0 |
| B | 0 | 19 | 0 |
| C | 0 | 19 | 0 |
| D | 0 | 19 | 0 |
| Quadrant | Total seconds | Saturated seconds | Saturation percentage |
|---|---|---|---|
| A | 18443 | 147 | 0.797050% |
| B | 18443 | 194 | 1.051890% |
| C | 18444 | 222 | 1.203643% |
| D | 18443 | 972 | 5.270292% |
Noise dominated data is calculated using 1-second bins in cleaned event files. If a bin has >2000 counts, and if more than 50% of those come from <1% of pixels, then it is considered to be noise-dominated and hence unusable.
| Quadrant | # 1 sec bins | Bins with >0 counts | Bins with >2000 counts | High rate bins dominated by noise | Noise dominated (total time) | Noise dominated (detector-on time) | Marked lightcurve |
|---|---|---|---|---|---|---|---|
| A | 20418 | 18445 | 17 | 17 | 0.08% | 0.09% | 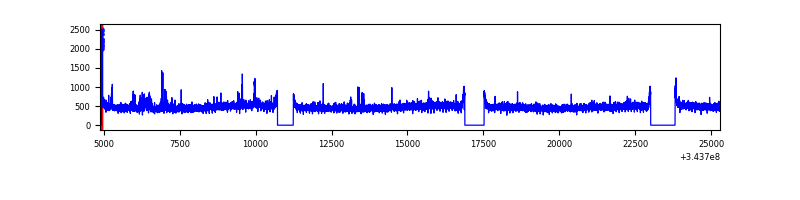 |
| B | 20418 | 18444 | 23 | 23 | 0.11% | 0.12% | 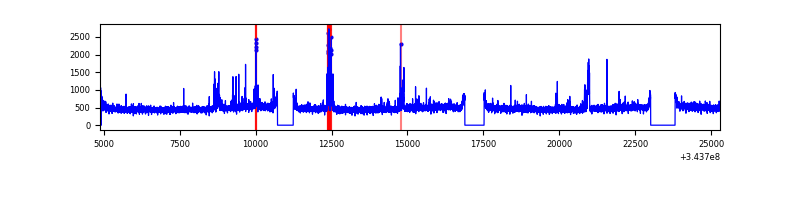 |
| C | 20419 | 18446 | 0 | 0 | 0.00% | 0.00% | 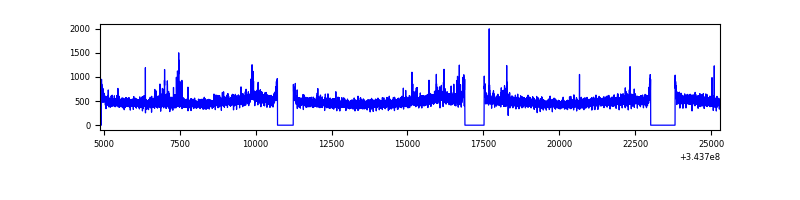 |
| D | 20418 | 18443 | 830 | 830 | 4.07% | 4.50% | 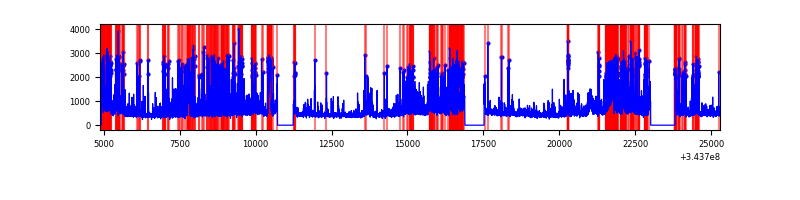 |
Top three noisy pixels from each quadrant. If the there are fewer than three noisy pixels in the level2.evt file, extra rows are filled as -1
| Pixel properties | Quadrant properties | ||||||
|---|---|---|---|---|---|---|---|
| Quadrant | DetID | PixID | Counts | Sigma | Mean | Median | Sigma |
| A | 6 | 16 | 196024 | 428.15 | 2239 | 2190 | 452.7 |
| A | 13 | 254 | 31253 | 64.2 | 2239 | 2190 | 452.7 |
| A | 0 | 13 | 29310 | 59.9 | 2239 | 2190 | 452.7 |
| B | 0 | 229 | 120729 | 281.47 | 2210 | 2150 | 421.3 |
| B | 15 | 32 | 93926 | 217.85 | 2210 | 2150 | 421.3 |
| B | 0 | 190 | 86778 | 200.88 | 2210 | 2150 | 421.3 |
| C | 14 | 238 | 341043 | 668.56 | 2149 | 2159 | 506.9 |
| C | 3 | 233 | 283012 | 554.08 | 2149 | 2159 | 506.9 |
| C | 15 | 208 | 35443 | 65.66 | 2149 | 2159 | 506.9 |
| D | 1 | 52 | 3970991 | 7775.99 | 2132 | 2072 | 510.4 |
| D | 2 | 250 | 1089438 | 2130.39 | 2132 | 2072 | 510.4 |
| D | 2 | 234 | 78632 | 150.0 | 2132 | 2072 | 510.4 |
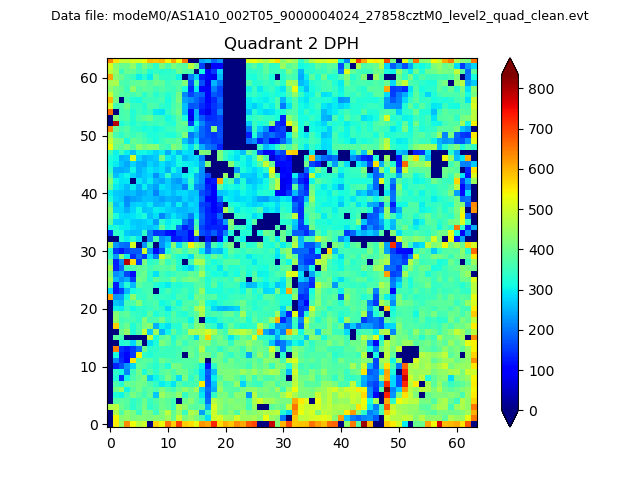
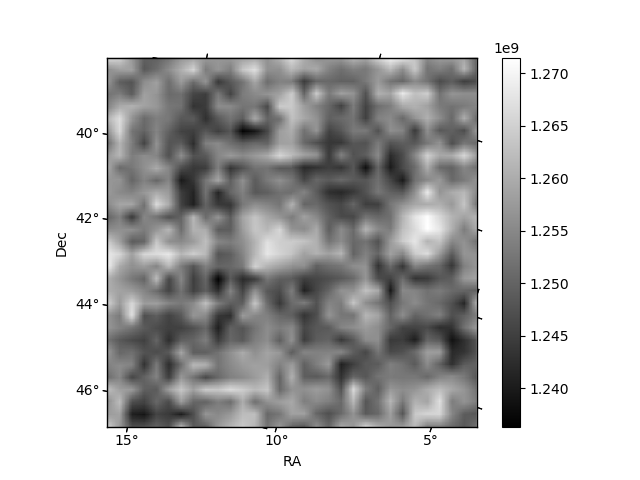
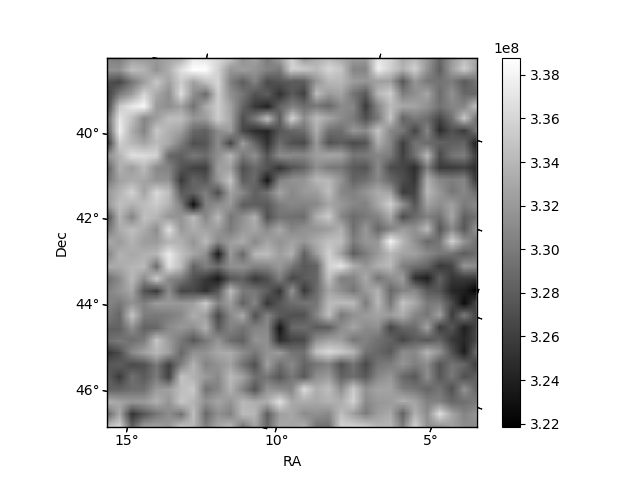
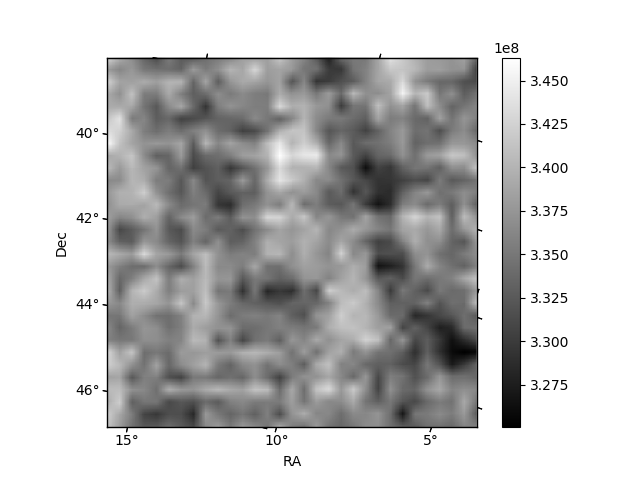
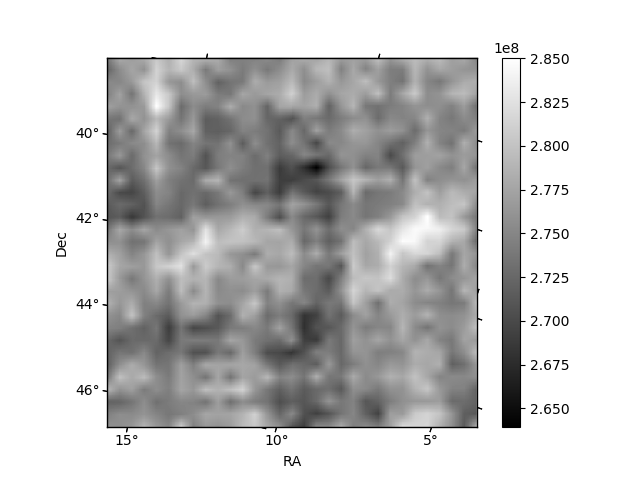
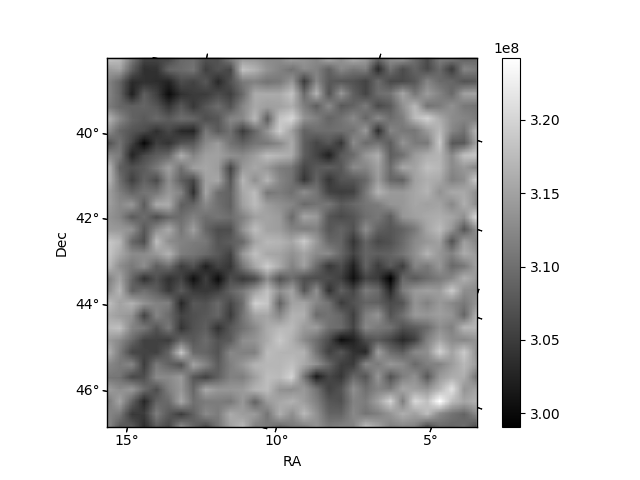
Histogram calculated using DETX and DETY for each event in the final _common_clean file
| Quadrant A | 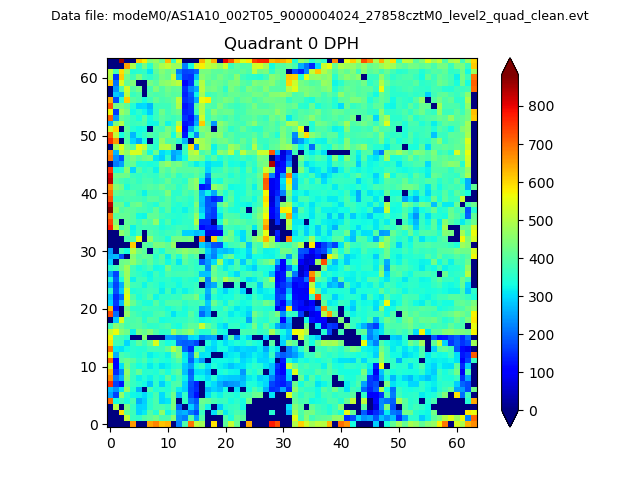 |
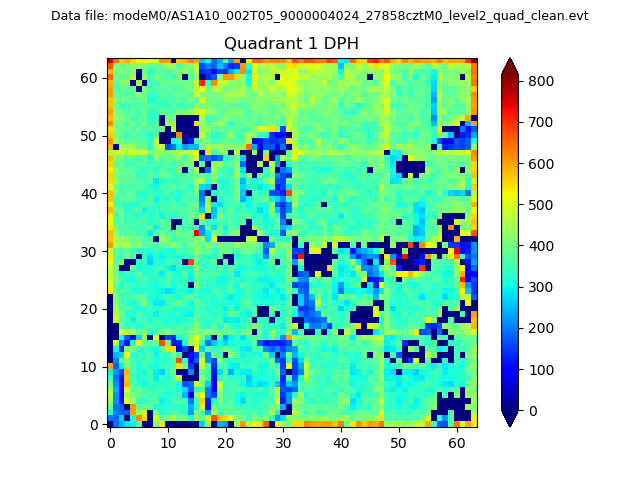 |
Quadrant B |
|---|---|---|---|
| Quadrant D | 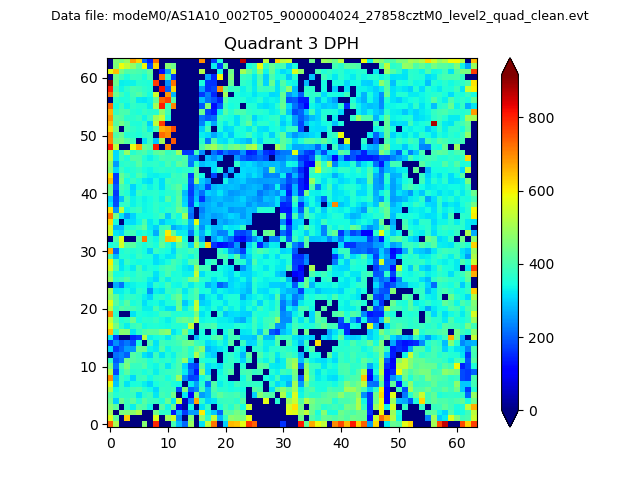 |
 |
Quadrant C |
| Plot type | Count rate plots | Images |
|---|---|---|
| Comparison with Poisson distribution Blue bars denote a histogram of data divided into 1 sec bins. Red curve is a Poisson curve with rate = median count rate of data. |
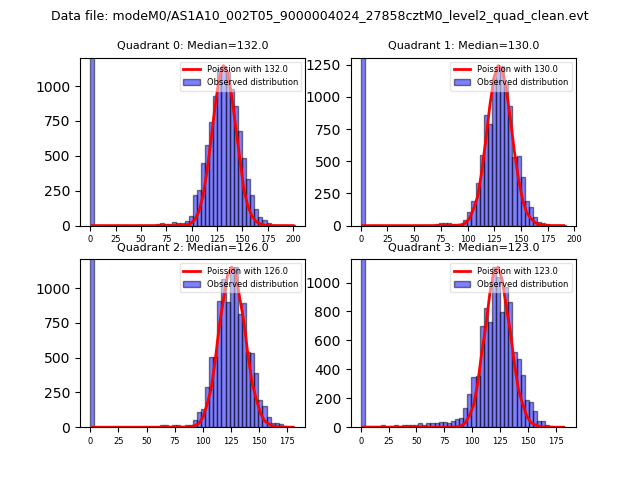 |
 |
| Quadrant-wise count rates Data is divided into 100 sec bins |
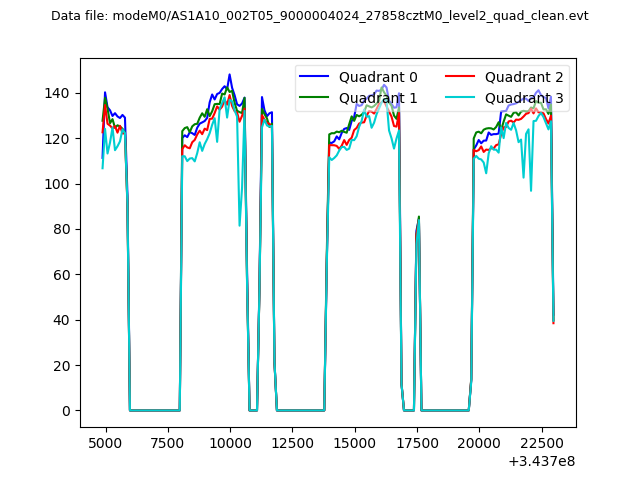 |
|
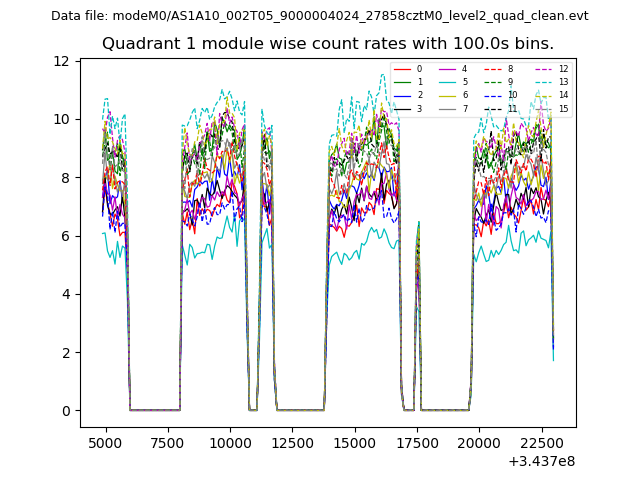
| Module-wise count rates for Quadrant A Data is divided into 100 sec bins |
 |
 |
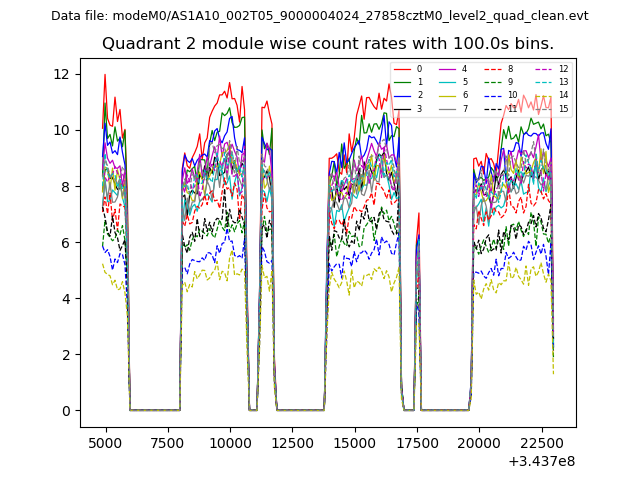
| Module-wise count rates for Quadrant B Data is divided into 100 sec bins |
 |
 |
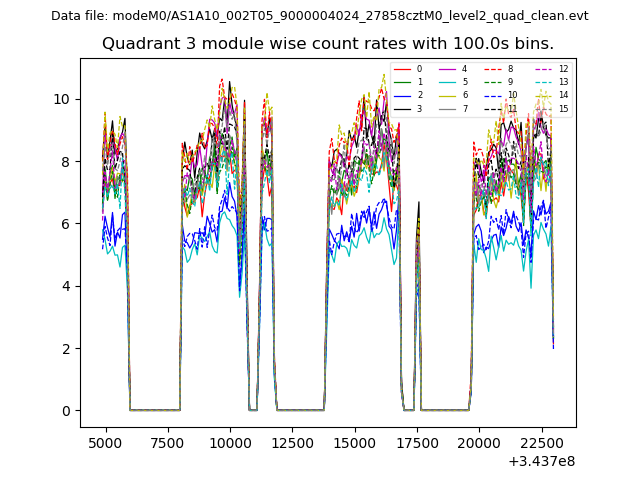
| Module-wise count rates for Quadrant C Data is divided into 100 sec bins |
 |
 |
| Module-wise count rates for Quadrant D Data is divided into 100 sec bins |
 |
 |
| Parameter | Plot |
|---|---|
| CZT HV Monitor |  |
| D_VDD | 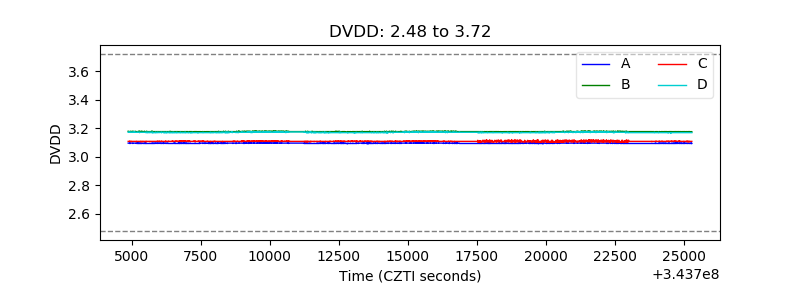 |
| Temperature 1 | 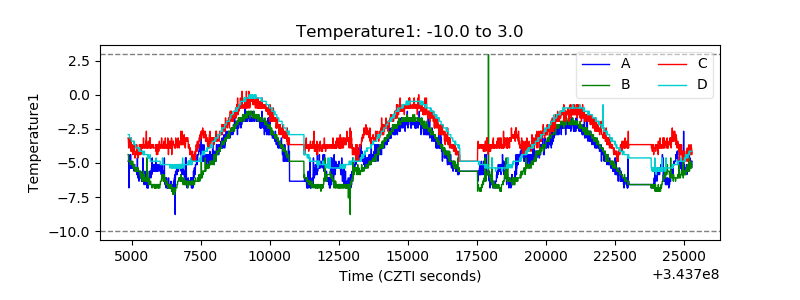 |
| Veto HV Monitor | 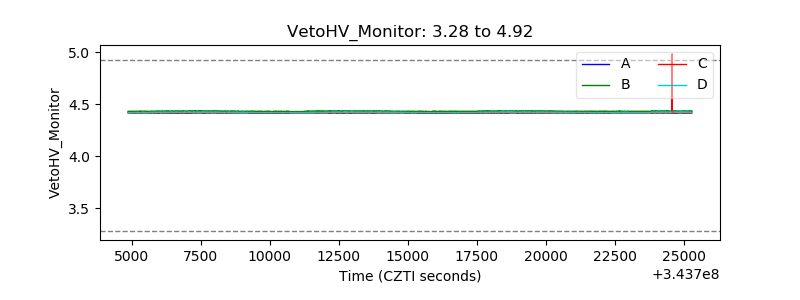 |
| Veto LLD |  |
| Alpha Counter | 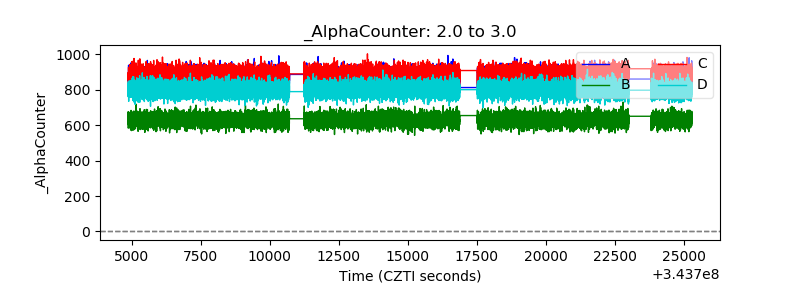 |
| _CPM_Rate | 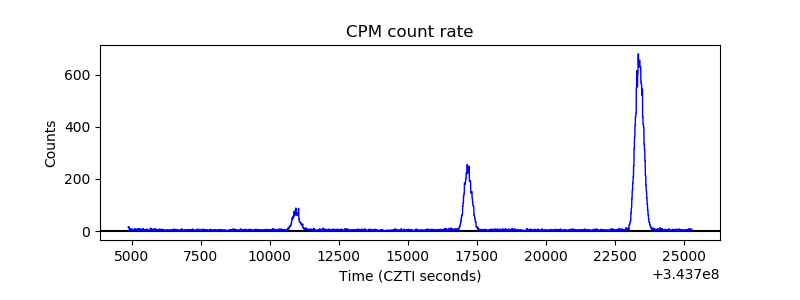 |
| CZT Counter | 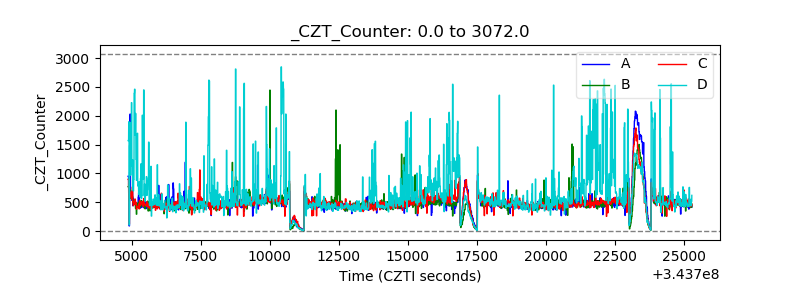 |
| +2.5 Volts monitor |  |
| +5 Volts monitor |  |
| _ROLL_ROT | 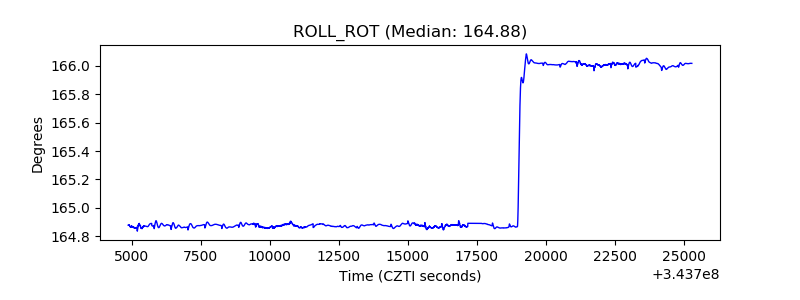 |
| _Roll_DEC | 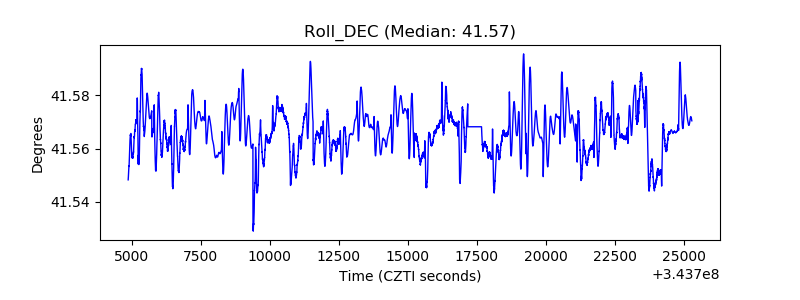 |
| _Roll_RA | 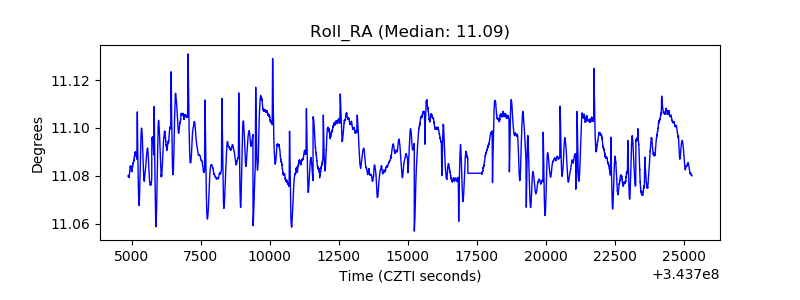 |
| Veto Counter | 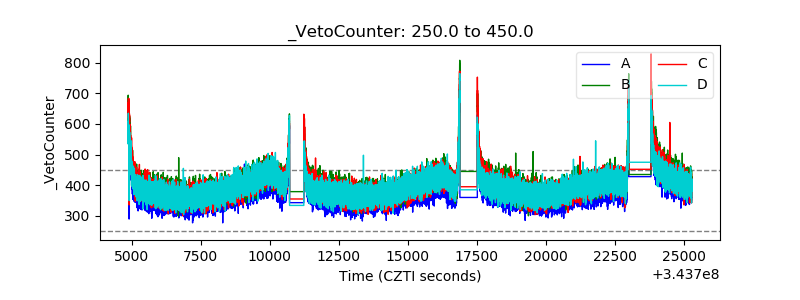 |