| Param | Original file | Final file |
|---|---|---|
| Filename | modeM0/AS1A10_002T05_9000004024_27859cztM0_level2.evt | modeM0/AS1A10_002T05_9000004024_27859cztM0_level2_quad_clean.evt |
| Size (bytes) | 507,934,080 | 76,806,720 |
| Size | 484.4 MB | 73.2 MB |
| Events in quadrant A | 3,338,902 | 482,912 |
| Events in quadrant B | 3,441,436 | 474,463 |
| Events in quadrant C | 3,367,031 | 459,193 |
| Events in quadrant D | 4,773,512 | 434,776 |
| Mode M0 | |||
|---|---|---|---|
| Quadrant | BADHDUFLAG | Total packets | Discarded packets |
| A | 0 | 14062 | 0 |
| B | 0 | 14277 | 0 |
| C | 0 | 14113 | 0 |
| D | 0 | 18432 | 0 |
| Mode M9 | |||
|---|---|---|---|
| Quadrant | BADHDUFLAG | Total packets | Discarded packets |
| A | 0 | 15 | 0 |
| B | 0 | 16 | 0 |
| C | 0 | 16 | 0 |
| D | 0 | 16 | 0 |
| Quadrant | Total seconds | Saturated seconds | Saturation percentage |
|---|---|---|---|
| A | 6812 | 70 | 1.027598% |
| B | 6812 | 95 | 1.394598% |
| C | 6812 | 106 | 1.556078% |
| D | 6812 | 432 | 6.341750% |
Noise dominated data is calculated using 1-second bins in cleaned event files. If a bin has >2000 counts, and if more than 50% of those come from <1% of pixels, then it is considered to be noise-dominated and hence unusable.
| Quadrant | # 1 sec bins | Bins with >0 counts | Bins with >2000 counts | High rate bins dominated by noise | Noise dominated (total time) | Noise dominated (detector-on time) | Marked lightcurve |
|---|---|---|---|---|---|---|---|
| A | 7757 | 6812 | 0 | 0 | 0.00% | 0.00% | 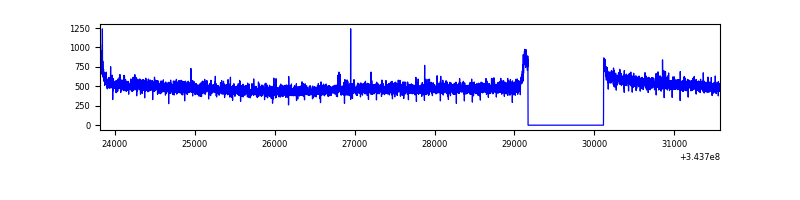 |
| B | 7757 | 6812 | 6 | 6 | 0.08% | 0.09% | 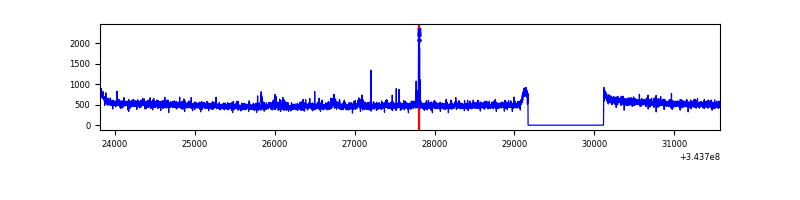 |
| C | 7757 | 6812 | 0 | 0 | 0.00% | 0.00% | 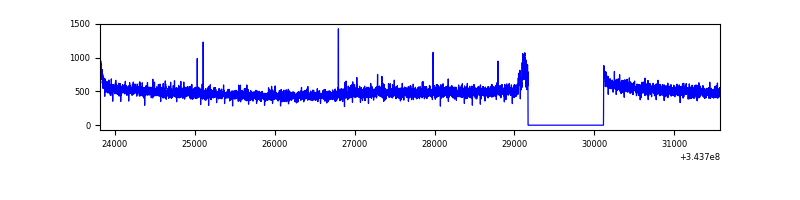 |
| D | 7757 | 6812 | 377 | 377 | 4.86% | 5.53% | 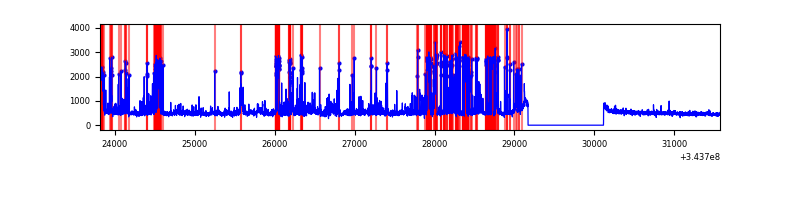 |
Top three noisy pixels from each quadrant. If the there are fewer than three noisy pixels in the level2.evt file, extra rows are filled as -1
| Pixel properties | Quadrant properties | ||||||
|---|---|---|---|---|---|---|---|
| Quadrant | DetID | PixID | Counts | Sigma | Mean | Median | Sigma |
| A | 13 | 254 | 11256 | 59.21 | 865 | 848 | 175.8 |
| A | 3 | 137 | 8333 | 42.58 | 865 | 848 | 175.8 |
| A | 0 | 226 | 7479 | 37.72 | 865 | 848 | 175.8 |
| B | 0 | 190 | 38260 | 230.5 | 852 | 830 | 162.4 |
| B | 0 | 229 | 28516 | 170.49 | 852 | 830 | 162.4 |
| B | 0 | 230 | 21833 | 129.34 | 852 | 830 | 162.4 |
| C | 14 | 238 | 132600 | 693.97 | 816 | 821 | 189.9 |
| C | 3 | 233 | 42039 | 217.06 | 816 | 821 | 189.9 |
| C | 7 | 247 | 9509 | 45.75 | 816 | 821 | 189.9 |
| D | 1 | 52 | 1516093 | 7856.35 | 808 | 786 | 192.9 |
| D | 2 | 250 | 146320 | 754.54 | 808 | 786 | 192.9 |
| D | 7 | 69 | 28637 | 144.4 | 808 | 786 | 192.9 |
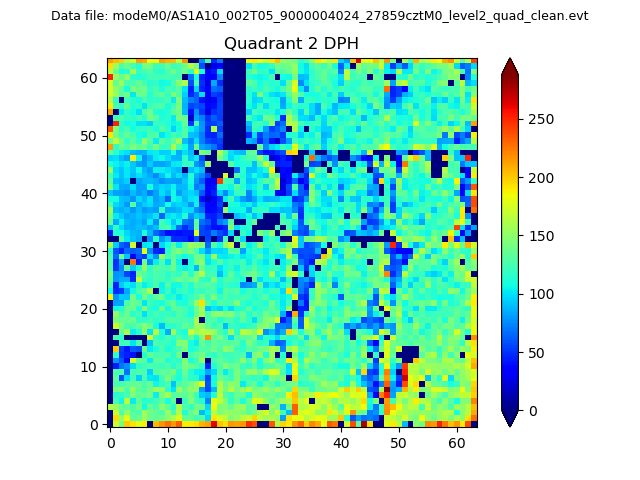
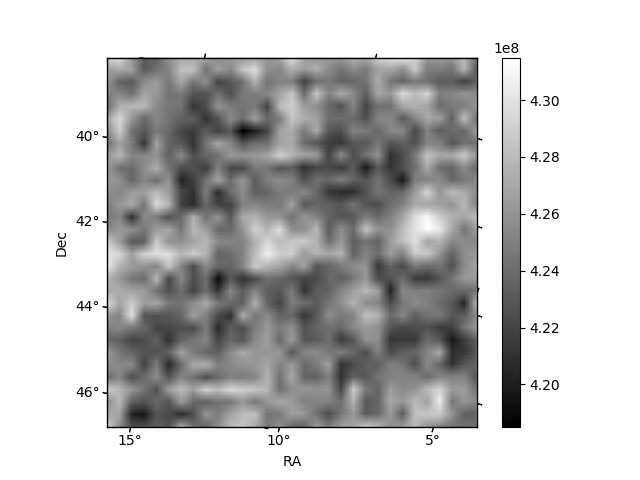
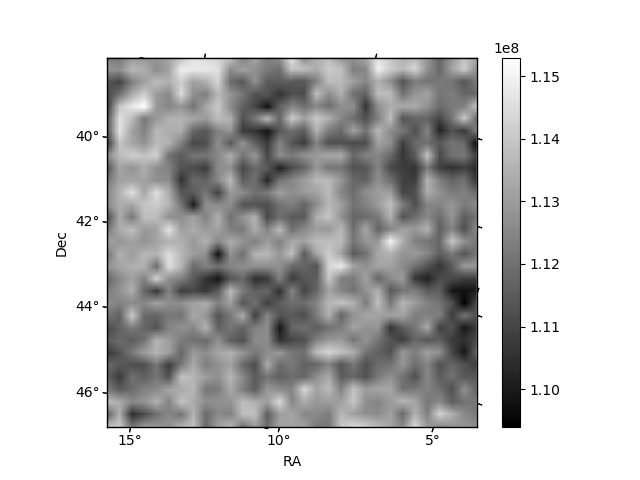
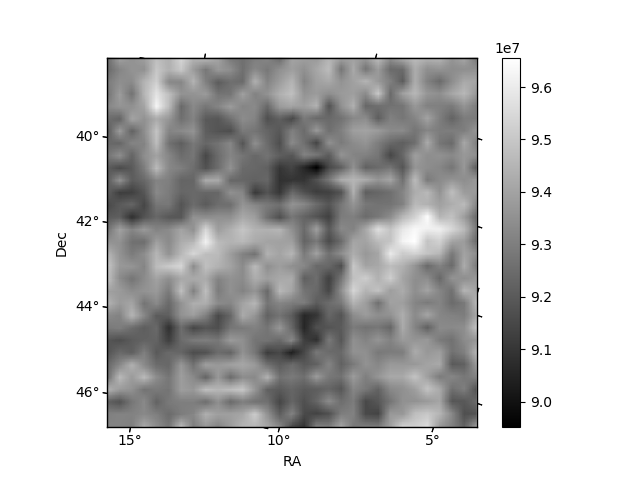
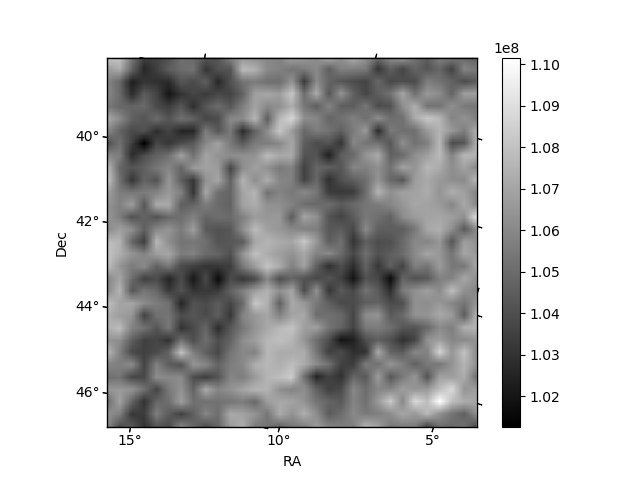
Histogram calculated using DETX and DETY for each event in the final _common_clean file
| Quadrant A | 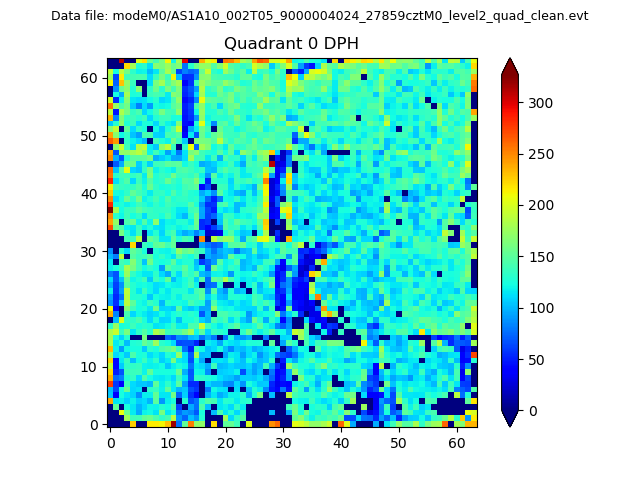 |
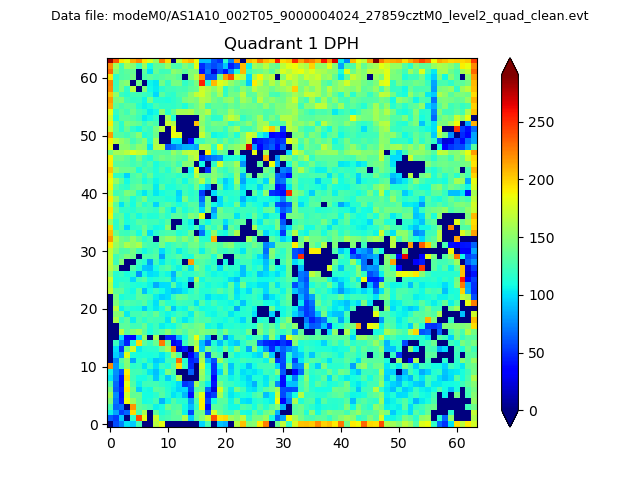 |
Quadrant B |
|---|---|---|---|
| Quadrant D | 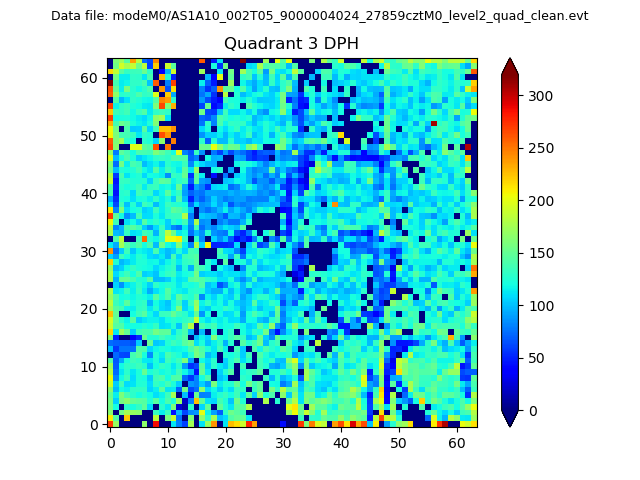 |
 |
Quadrant C |
| Plot type | Count rate plots | Images |
|---|---|---|
| Comparison with Poisson distribution Blue bars denote a histogram of data divided into 1 sec bins. Red curve is a Poisson curve with rate = median count rate of data. |
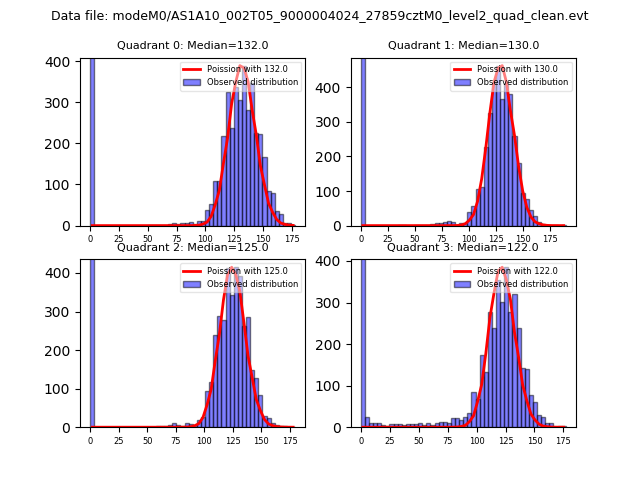 |
 |
| Quadrant-wise count rates Data is divided into 100 sec bins |
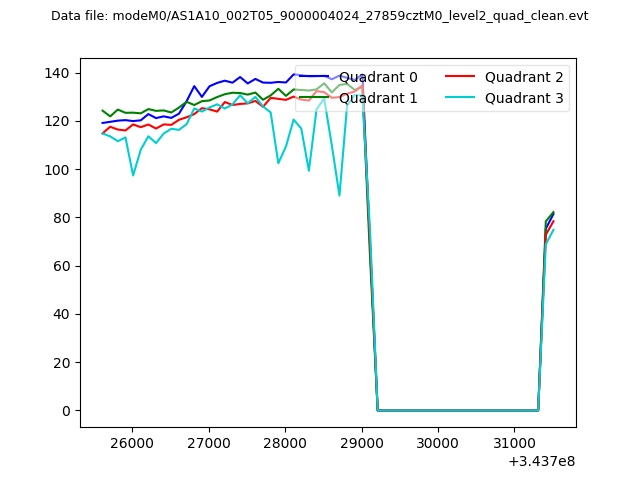 |
|
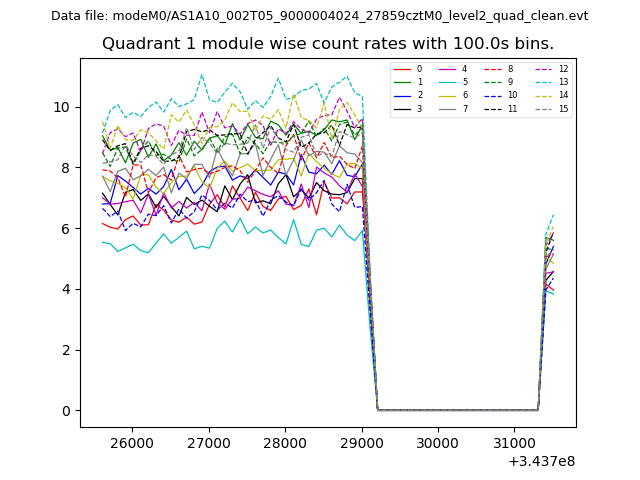
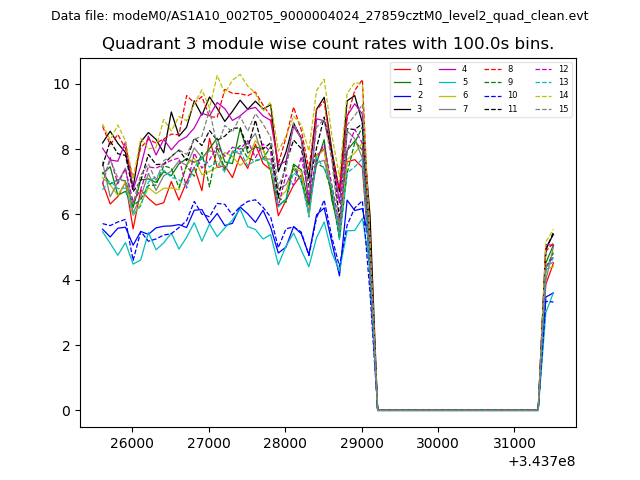
| Module-wise count rates for Quadrant A Data is divided into 100 sec bins |
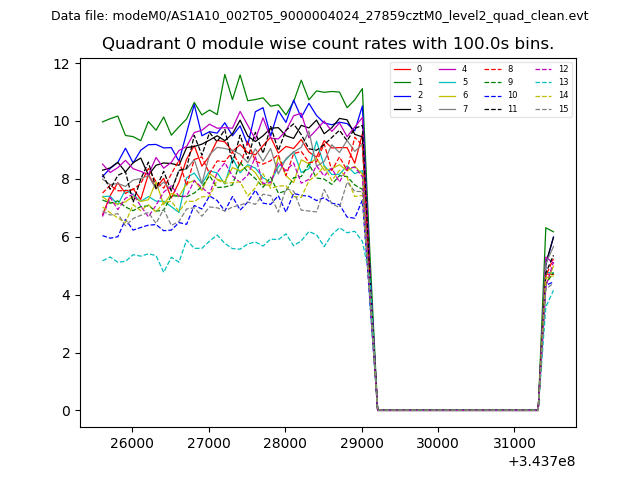 |
 |
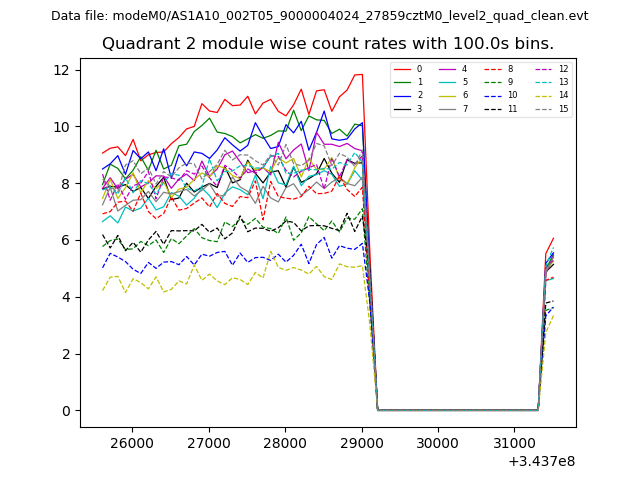
| Module-wise count rates for Quadrant B Data is divided into 100 sec bins |
 |
 |
| Module-wise count rates for Quadrant C Data is divided into 100 sec bins |
 |
 |
| Module-wise count rates for Quadrant D Data is divided into 100 sec bins |
 |
 |
| Parameter | Plot |
|---|---|
| CZT HV Monitor | 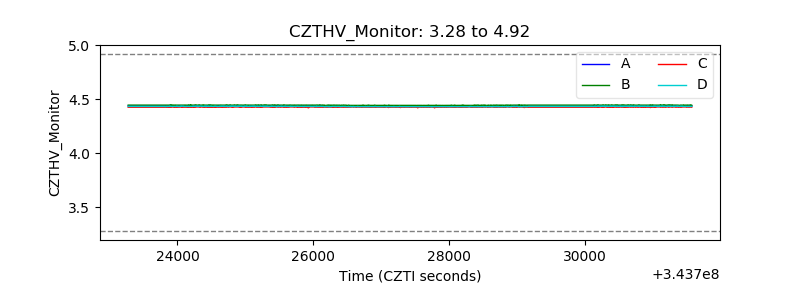 |
| D_VDD | 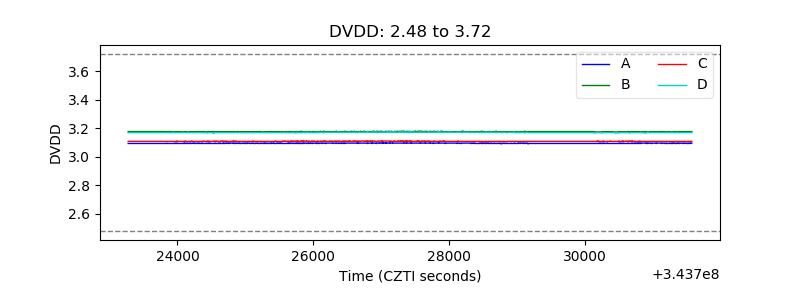 |
| Temperature 1 | 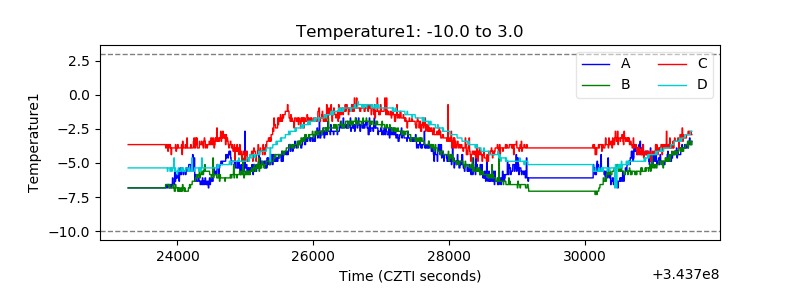 |
| Veto HV Monitor | 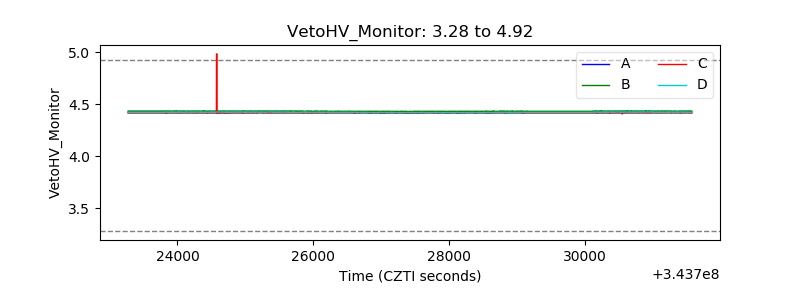 |
| Veto LLD |  |
| Alpha Counter | 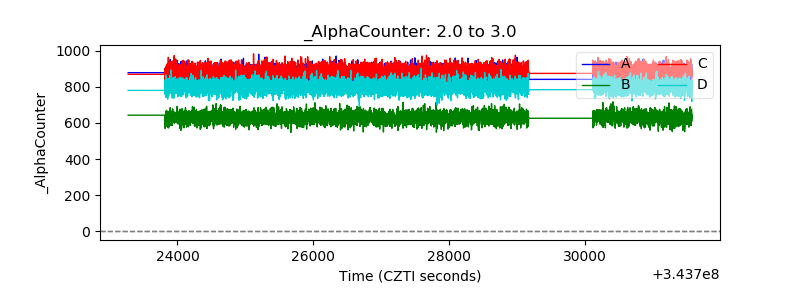 |
| _CPM_Rate | 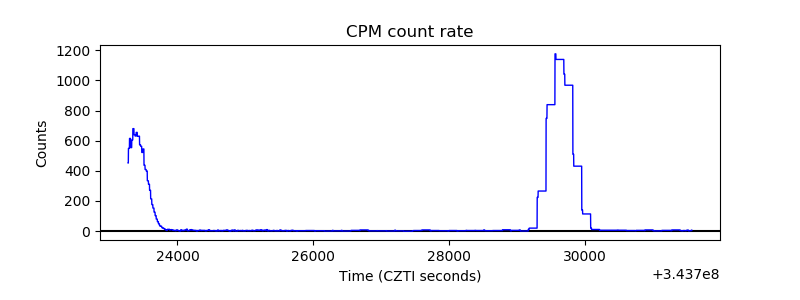 |
| CZT Counter | 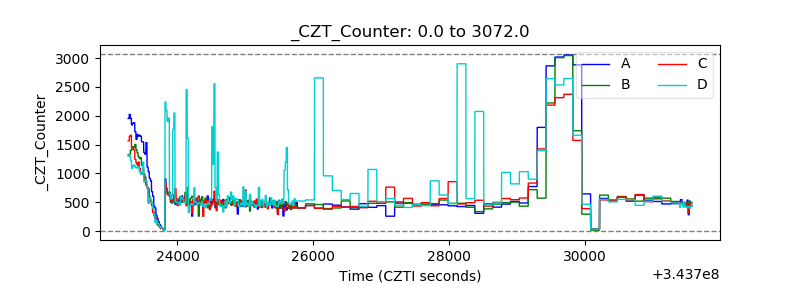 |
| +2.5 Volts monitor |  |
| +5 Volts monitor |  |
| _ROLL_ROT |  |
| _Roll_DEC | 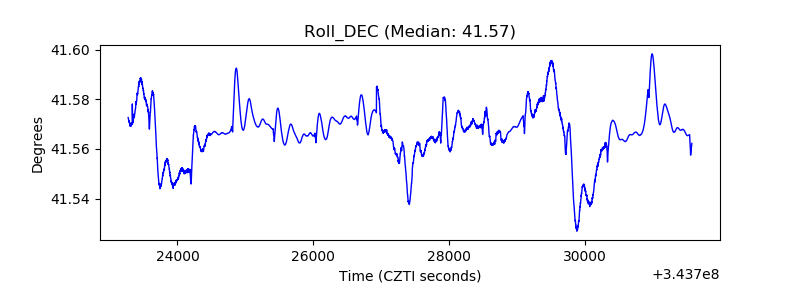 |
| _Roll_RA | 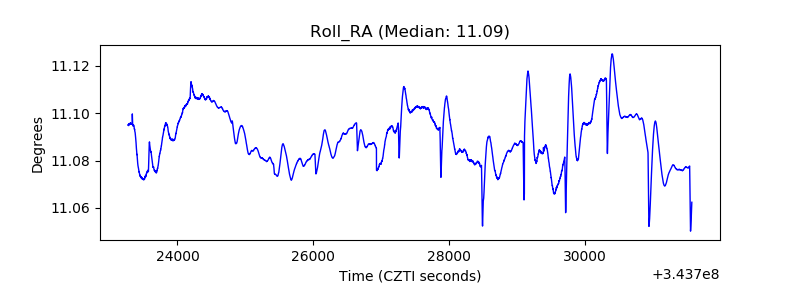 |
| Veto Counter | 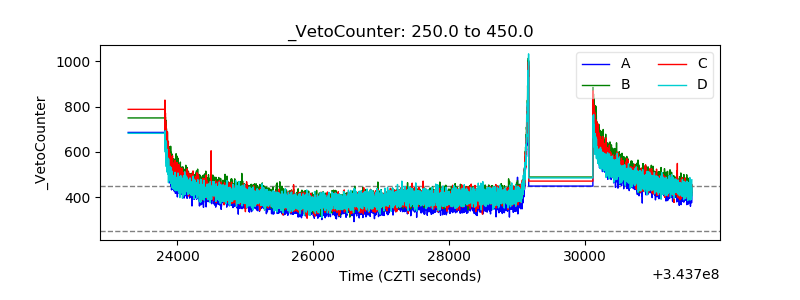 |