| Param | Original file | Final file |
|---|---|---|
| Filename | modeM0/AS1A10_002T05_9000004024_27861cztM0_level2.evt | modeM0/AS1A10_002T05_9000004024_27861cztM0_level2_quad_clean.evt |
| Size (bytes) | 500,878,080 | 88,698,240 |
| Size | 477.7 MB | 84.6 MB |
| Events in quadrant A | 3,364,196 | 579,342 |
| Events in quadrant B | 3,425,973 | 574,650 |
| Events in quadrant C | 3,428,075 | 546,960 |
| Events in quadrant D | 4,503,141 | 525,011 |
| Mode M0 | |||
|---|---|---|---|
| Quadrant | BADHDUFLAG | Total packets | Discarded packets |
| A | 0 | 14114 | 0 |
| B | 0 | 14297 | 0 |
| C | 0 | 14182 | 0 |
| D | 0 | 17545 | 0 |
| Mode M9 | |||
|---|---|---|---|
| Quadrant | BADHDUFLAG | Total packets | Discarded packets |
| A | 0 | 17 | 0 |
| B | 0 | 18 | 0 |
| C | 0 | 18 | 0 |
| D | 0 | 18 | 0 |
| Quadrant | Total seconds | Saturated seconds | Saturation percentage |
|---|---|---|---|
| A | 6596 | 72 | 1.091571% |
| B | 6596 | 81 | 1.228017% |
| C | 6596 | 114 | 1.728320% |
| D | 6596 | 339 | 5.139478% |
Noise dominated data is calculated using 1-second bins in cleaned event files. If a bin has >2000 counts, and if more than 50% of those come from <1% of pixels, then it is considered to be noise-dominated and hence unusable.
| Quadrant | # 1 sec bins | Bins with >0 counts | Bins with >2000 counts | High rate bins dominated by noise | Noise dominated (total time) | Noise dominated (detector-on time) | Marked lightcurve |
|---|---|---|---|---|---|---|---|
| A | 7686 | 6596 | 0 | 0 | 0.00% | 0.00% | 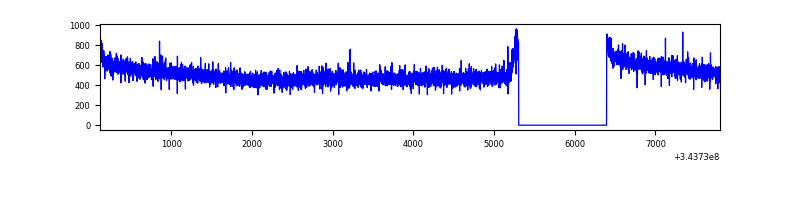 |
| B | 7686 | 6596 | 0 | 0 | 0.00% | 0.00% | 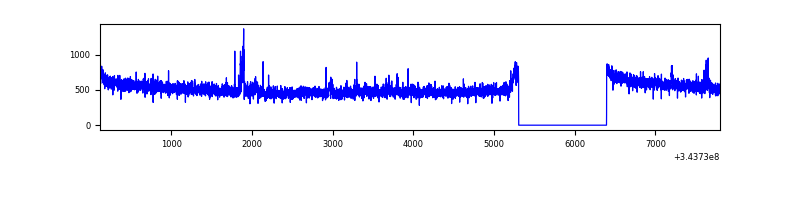 |
| C | 7686 | 6596 | 2 | 2 | 0.03% | 0.03% | 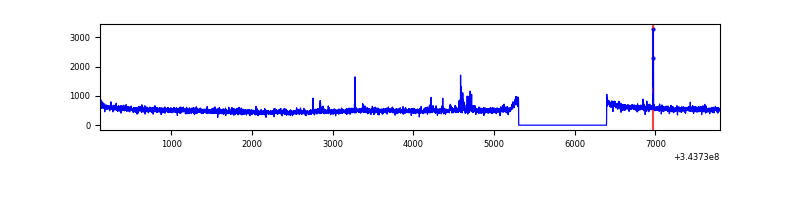 |
| D | 7686 | 6596 | 308 | 308 | 4.01% | 4.67% | 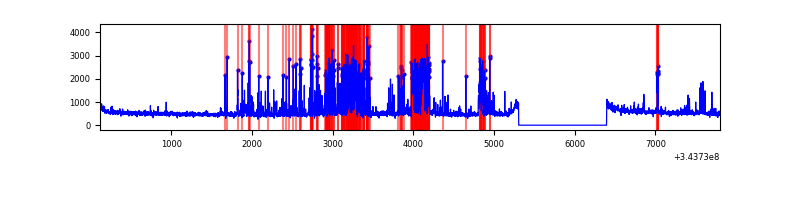 |
Top three noisy pixels from each quadrant. If the there are fewer than three noisy pixels in the level2.evt file, extra rows are filled as -1
| Pixel properties | Quadrant properties | ||||||
|---|---|---|---|---|---|---|---|
| Quadrant | DetID | PixID | Counts | Sigma | Mean | Median | Sigma |
| A | 13 | 254 | 10822 | 56.84 | 872 | 855 | 175.4 |
| A | 3 | 137 | 7988 | 40.68 | 872 | 855 | 175.4 |
| A | 0 | 226 | 7396 | 37.3 | 872 | 855 | 175.4 |
| B | 0 | 190 | 39041 | 236.69 | 854 | 832 | 161.4 |
| B | 0 | 230 | 23612 | 141.11 | 854 | 832 | 161.4 |
| B | 12 | 111 | 19817 | 117.6 | 854 | 832 | 161.4 |
| C | 14 | 238 | 134390 | 704.04 | 817 | 822 | 189.7 |
| C | 3 | 233 | 76646 | 399.67 | 817 | 822 | 189.7 |
| C | 15 | 208 | 22826 | 115.98 | 817 | 822 | 189.7 |
| D | 1 | 52 | 1213521 | 6320.12 | 818 | 796 | 191.9 |
| D | 2 | 250 | 180957 | 938.91 | 818 | 796 | 191.9 |
| D | 2 | 234 | 24354 | 122.77 | 818 | 796 | 191.9 |
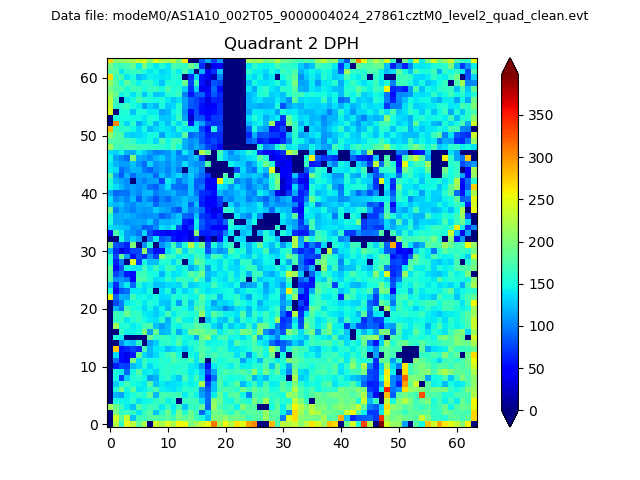
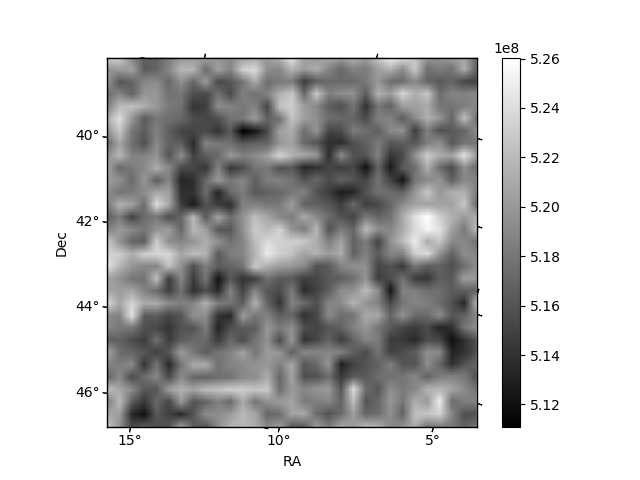
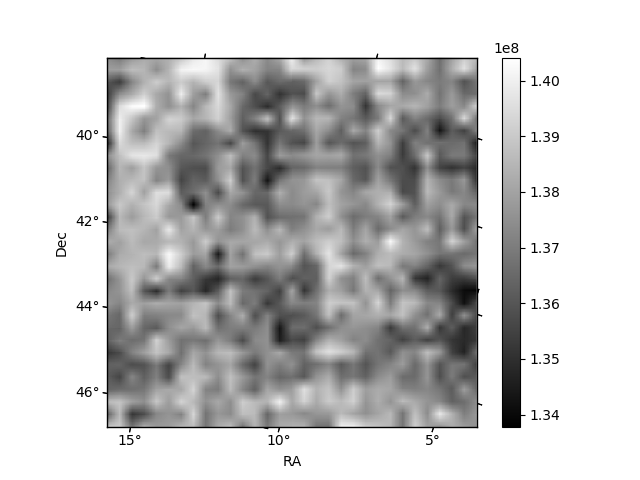
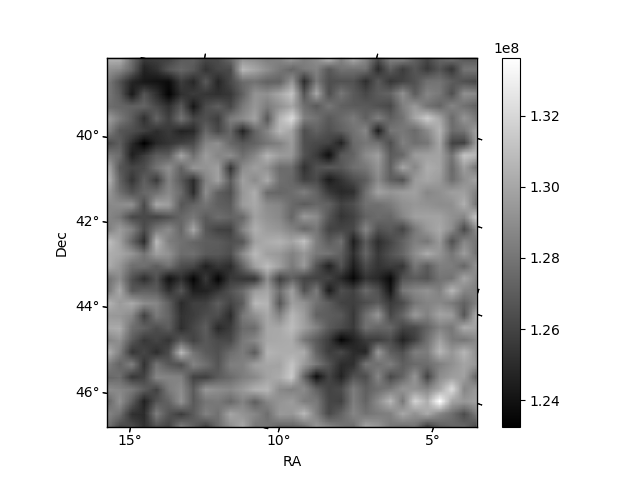
Histogram calculated using DETX and DETY for each event in the final _common_clean file
| Quadrant A | 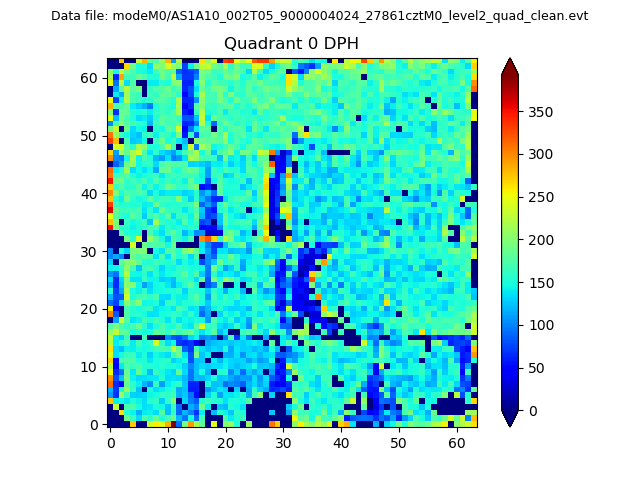 |
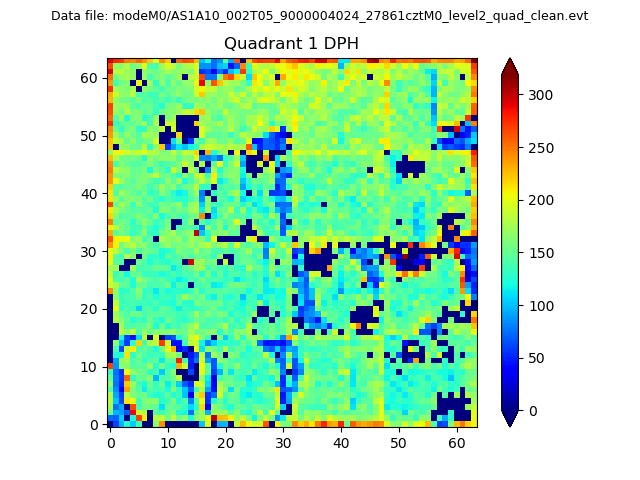 |
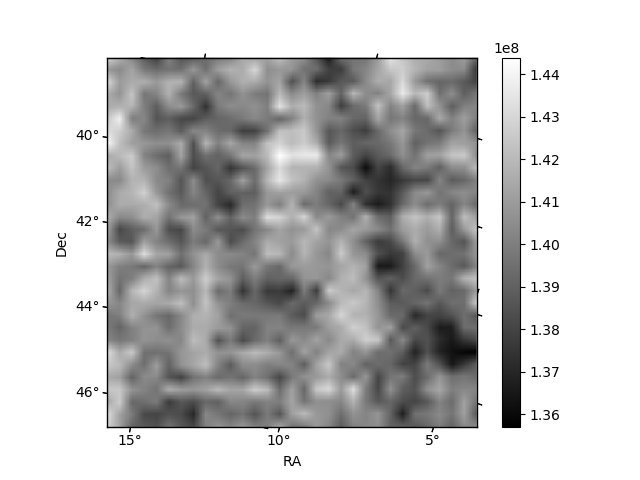
Quadrant B |
|---|---|---|---|
| Quadrant D | 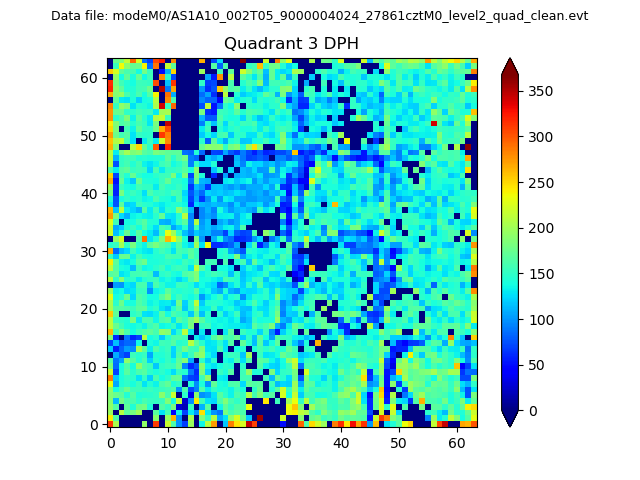 |
 |
Quadrant C |
| Plot type | Count rate plots | Images |
|---|---|---|
| Comparison with Poisson distribution Blue bars denote a histogram of data divided into 1 sec bins. Red curve is a Poisson curve with rate = median count rate of data. |
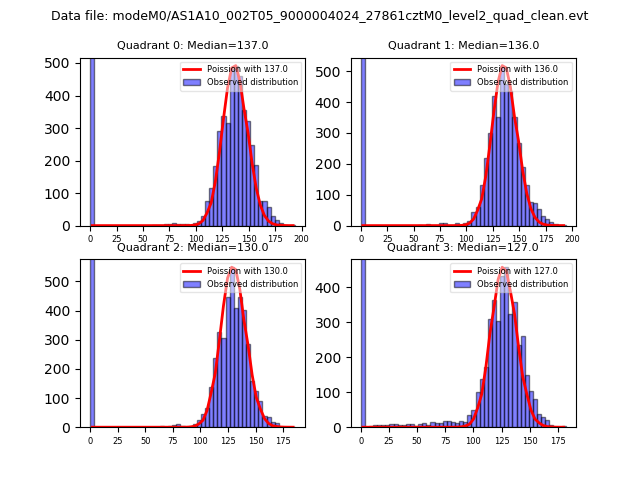 |
 |
| Quadrant-wise count rates Data is divided into 100 sec bins |
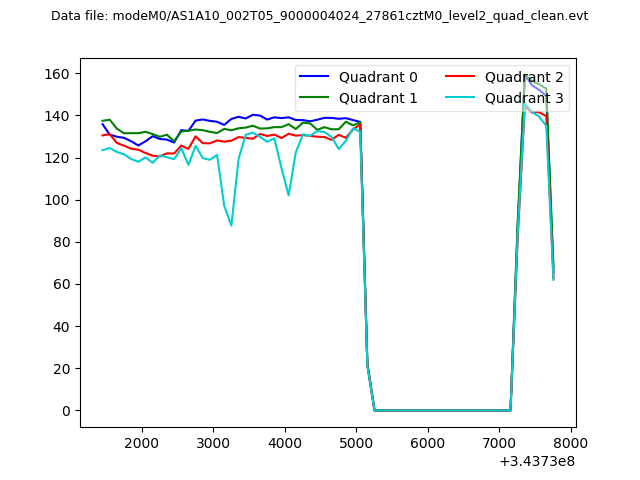 |
|
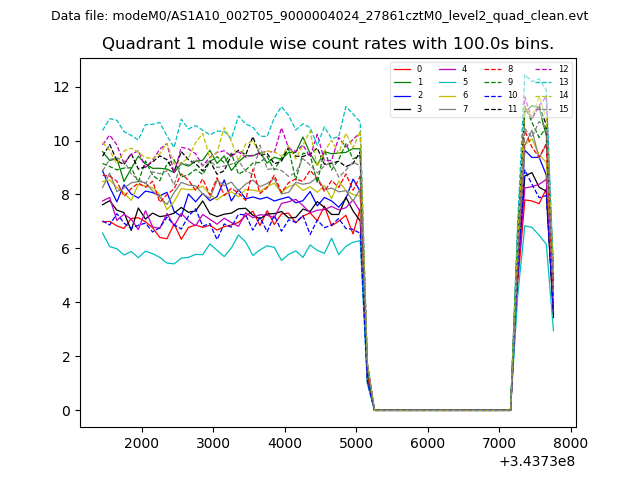
| Module-wise count rates for Quadrant A Data is divided into 100 sec bins |
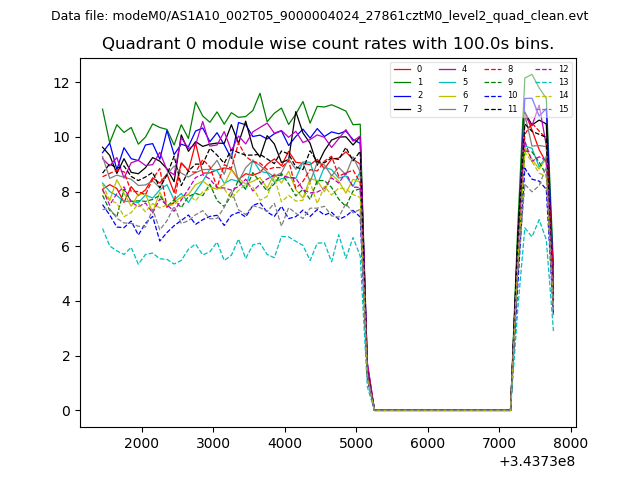 |
 |
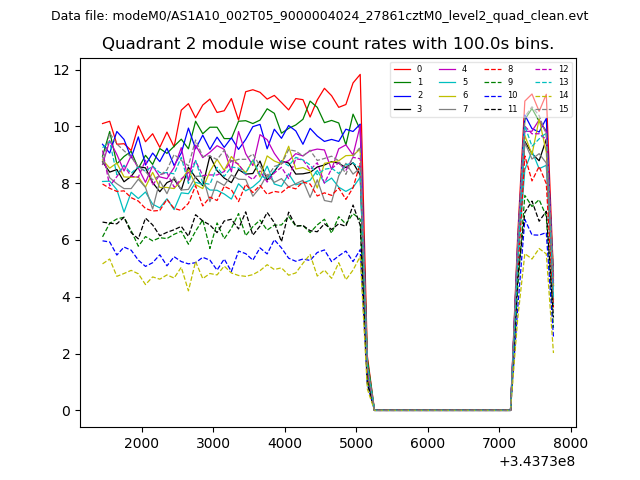
| Module-wise count rates for Quadrant B Data is divided into 100 sec bins |
 |
 |
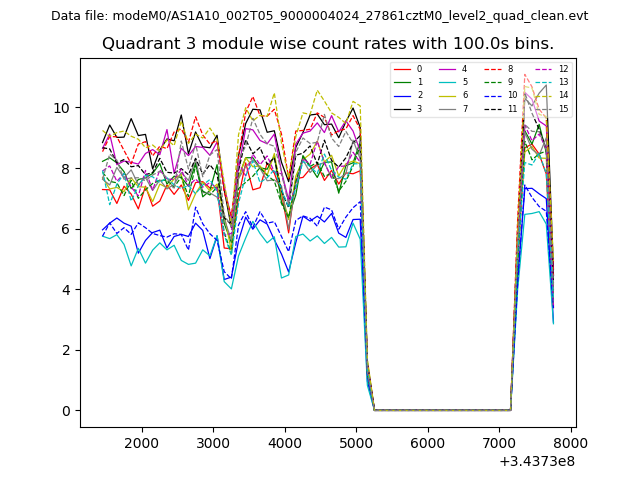
| Module-wise count rates for Quadrant C Data is divided into 100 sec bins |
 |
 |
| Module-wise count rates for Quadrant D Data is divided into 100 sec bins |
 |
 |
| Parameter | Plot |
|---|---|
| CZT HV Monitor | 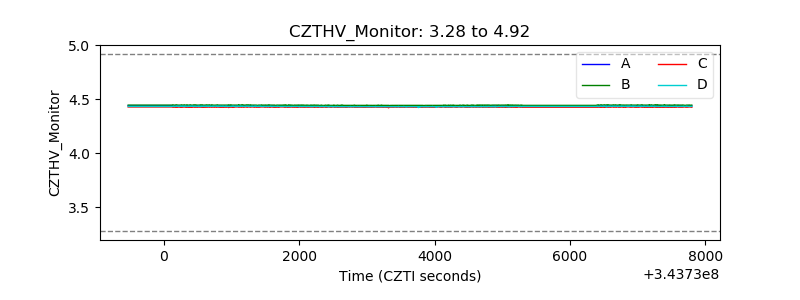 |
| D_VDD | 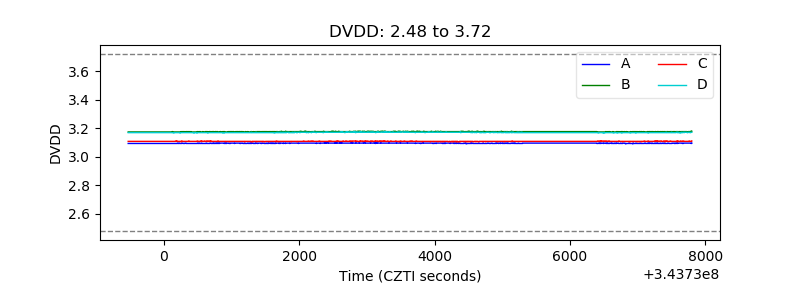 |
| Temperature 1 | 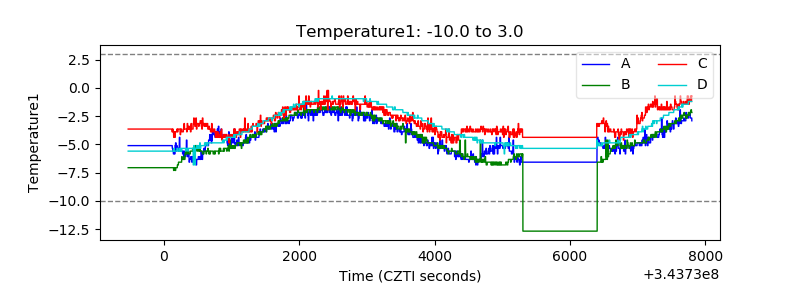 |
| Veto HV Monitor |  |
| Veto LLD | 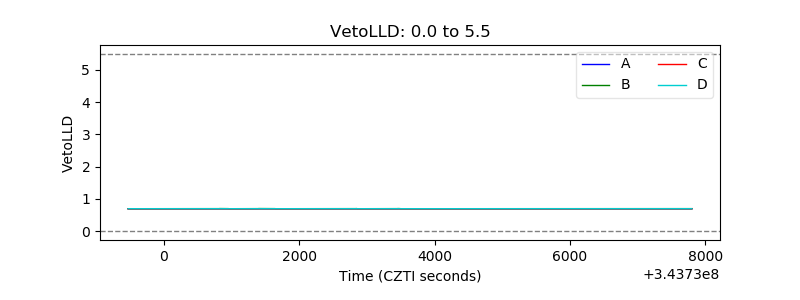 |
| Alpha Counter | 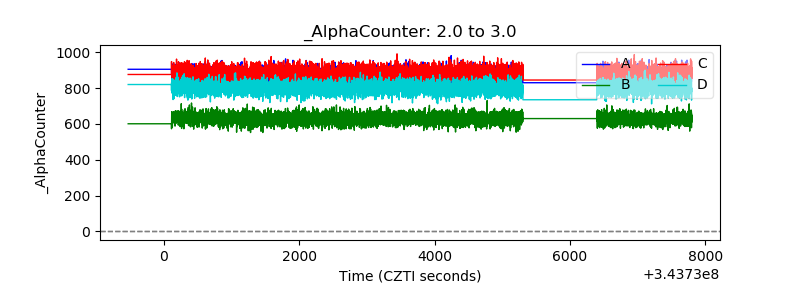 |
| _CPM_Rate | 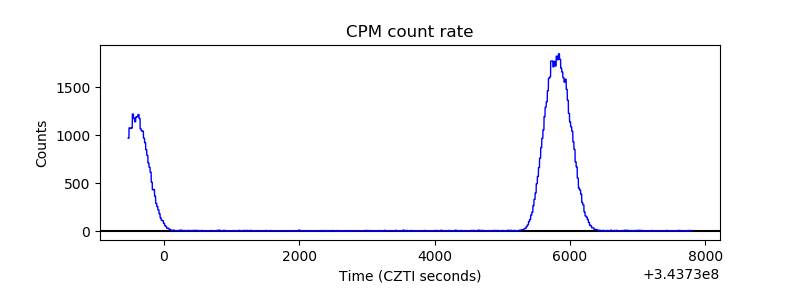 |
| CZT Counter | 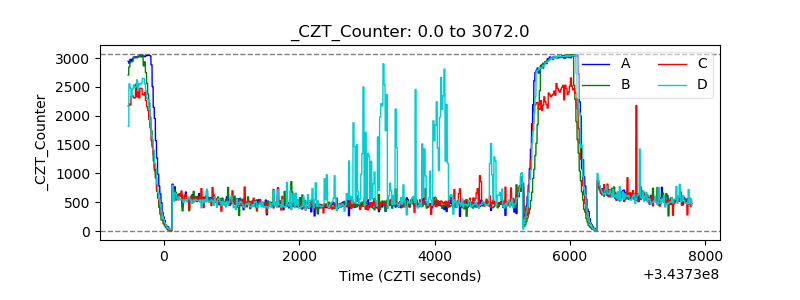 |
| +2.5 Volts monitor |  |
| +5 Volts monitor |  |
| _ROLL_ROT | 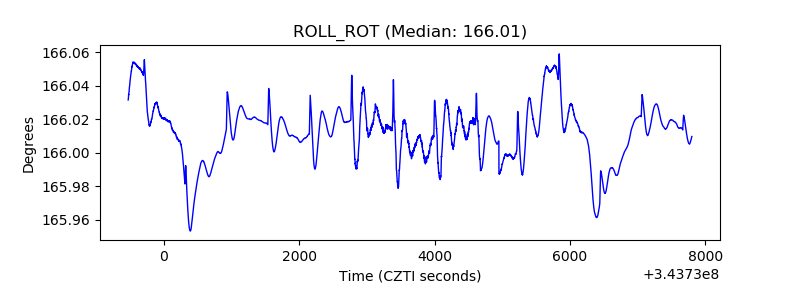 |
| _Roll_DEC | 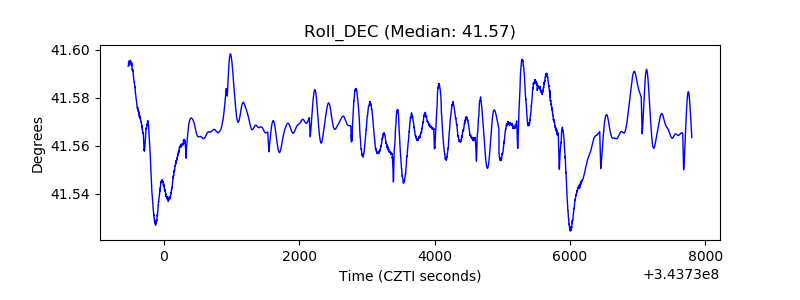 |
| _Roll_RA | 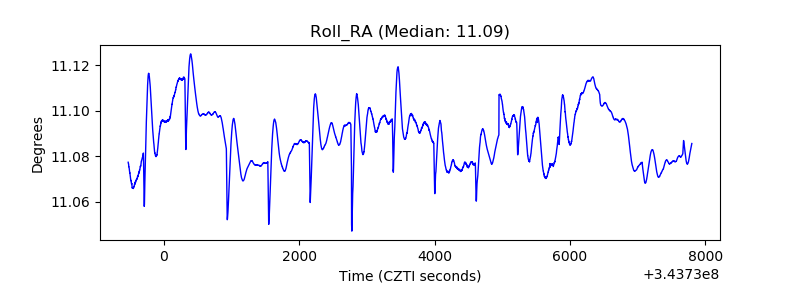 |
| Veto Counter | 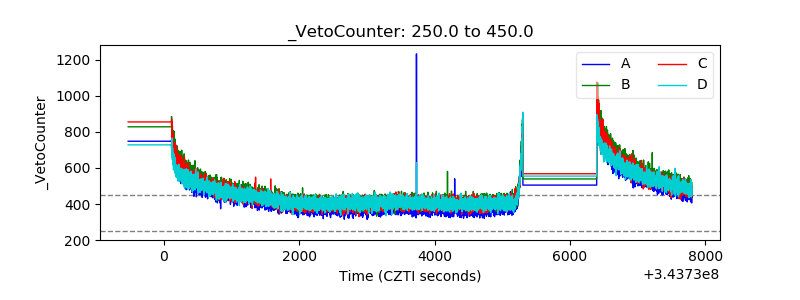 |