| Param | Original file | Final file |
|---|---|---|
| Filename | modeM0/AS1A10_002T05_9000004024_27862cztM0_level2.evt | modeM0/AS1A10_002T05_9000004024_27862cztM0_level2_quad_clean.evt |
| Size (bytes) | 556,876,800 | 100,074,240 |
| Size | 531.1 MB | 95.4 MB |
| Events in quadrant A | 3,438,796 | 683,023 |
| Events in quadrant B | 3,508,192 | 672,921 |
| Events in quadrant C | 3,447,689 | 631,664 |
| Events in quadrant D | 6,036,906 | 596,354 |
| Mode M0 | |||
|---|---|---|---|
| Quadrant | BADHDUFLAG | Total packets | Discarded packets |
| A | 0 | 14341 | 0 |
| B | 0 | 14530 | 0 |
| C | 0 | 14183 | 0 |
| D | 0 | 22369 | 0 |
| Mode M9 | |||
|---|---|---|---|
| Quadrant | BADHDUFLAG | Total packets | Discarded packets |
| A | 0 | 20 | 0 |
| B | 0 | 21 | 0 |
| C | 0 | 21 | 0 |
| D | 0 | 21 | 0 |
| Quadrant | Total seconds | Saturated seconds | Saturation percentage |
|---|---|---|---|
| A | 6401 | 80 | 1.249805% |
| B | 6401 | 101 | 1.577878% |
| C | 6401 | 116 | 1.812217% |
| D | 6401 | 579 | 9.045462% |
Noise dominated data is calculated using 1-second bins in cleaned event files. If a bin has >2000 counts, and if more than 50% of those come from <1% of pixels, then it is considered to be noise-dominated and hence unusable.
| Quadrant | # 1 sec bins | Bins with >0 counts | Bins with >2000 counts | High rate bins dominated by noise | Noise dominated (total time) | Noise dominated (detector-on time) | Marked lightcurve |
|---|---|---|---|---|---|---|---|
| A | 7586 | 6401 | 0 | 0 | 0.00% | 0.00% |  |
| B | 7586 | 6401 | 2 | 2 | 0.03% | 0.03% |  |
| C | 7586 | 6401 | 2 | 2 | 0.03% | 0.03% |  |
| D | 7586 | 6401 | 536 | 536 | 7.07% | 8.37% | 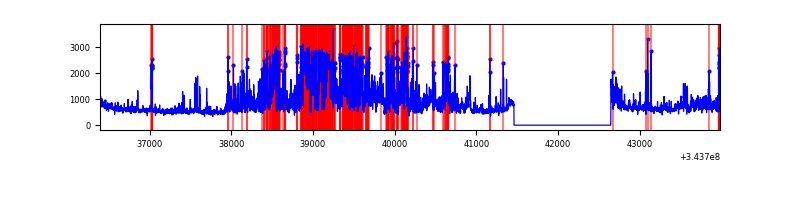 |
Top three noisy pixels from each quadrant. If the there are fewer than three noisy pixels in the level2.evt file, extra rows are filled as -1
| Pixel properties | Quadrant properties | ||||||
|---|---|---|---|---|---|---|---|
| Quadrant | DetID | PixID | Counts | Sigma | Mean | Median | Sigma |
| A | 13 | 254 | 10251 | 53.35 | 889 | 871 | 175.8 |
| A | 5 | 98 | 8116 | 41.21 | 889 | 871 | 175.8 |
| A | 3 | 137 | 7748 | 39.12 | 889 | 871 | 175.8 |
| B | 0 | 190 | 55052 | 334.14 | 865 | 844 | 162.2 |
| B | 0 | 230 | 51456 | 311.98 | 865 | 844 | 162.2 |
| B | 12 | 111 | 19085 | 112.44 | 865 | 844 | 162.2 |
| C | 14 | 238 | 135131 | 707.09 | 823 | 831 | 189.9 |
| C | 3 | 233 | 70508 | 366.85 | 823 | 831 | 189.9 |
| C | 15 | 208 | 20231 | 102.14 | 823 | 831 | 189.9 |
| D | 1 | 52 | 1985668 | 10281.28 | 823 | 803 | 193.1 |
| D | 2 | 250 | 586511 | 3033.87 | 823 | 803 | 193.1 |
| D | 13 | 104 | 334619 | 1729.11 | 823 | 803 | 193.1 |
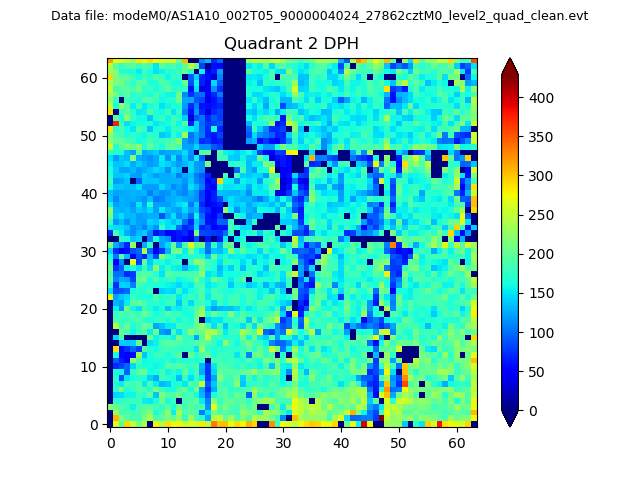
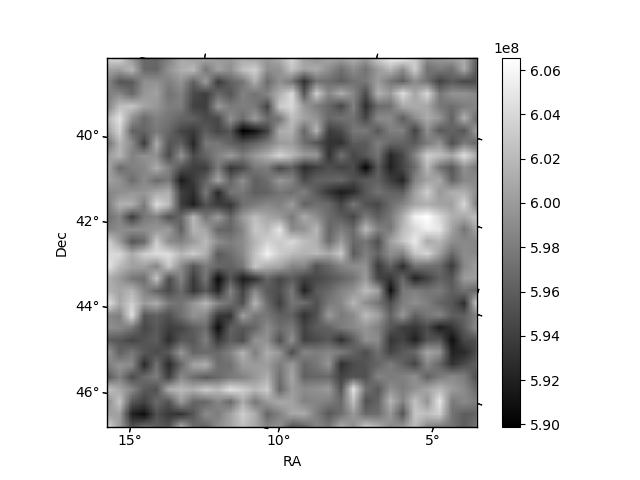
Histogram calculated using DETX and DETY for each event in the final _common_clean file
| Quadrant A | 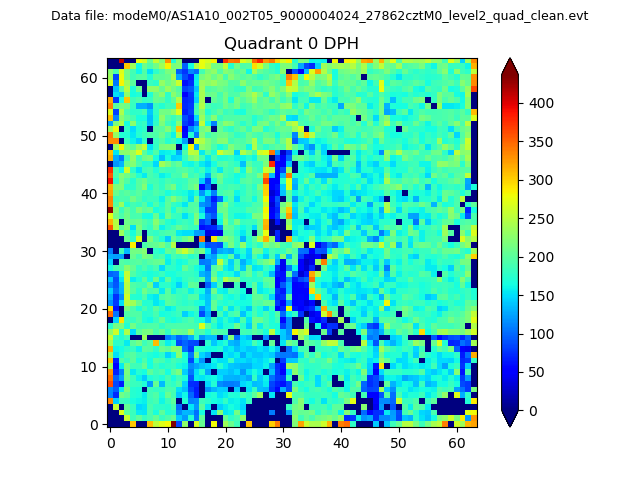 |
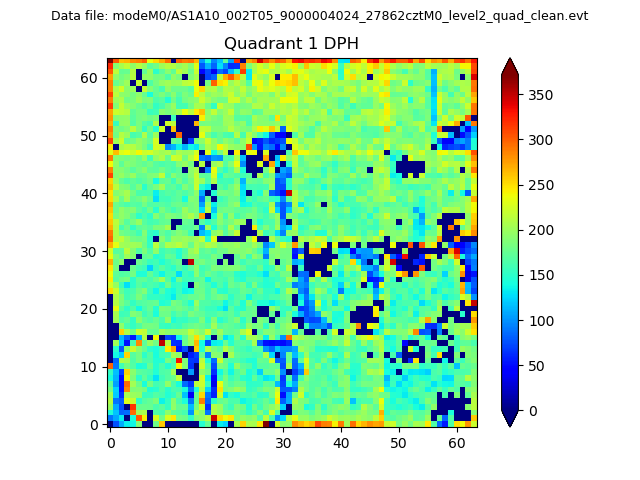 |
Quadrant B |
|---|---|---|---|
| Quadrant D | 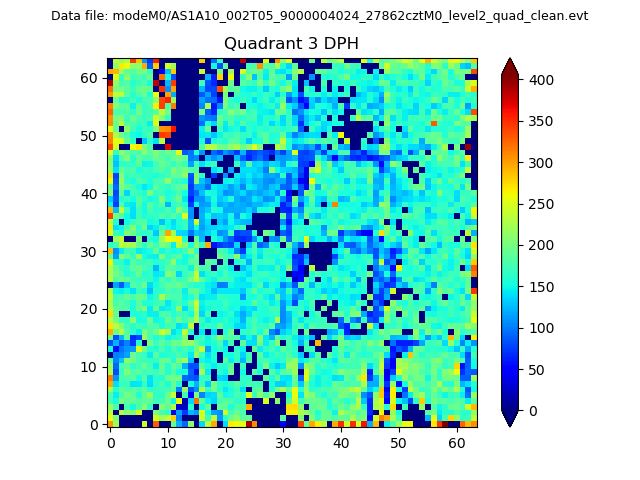 |
 |
Quadrant C |
| Plot type | Count rate plots | Images |
|---|---|---|
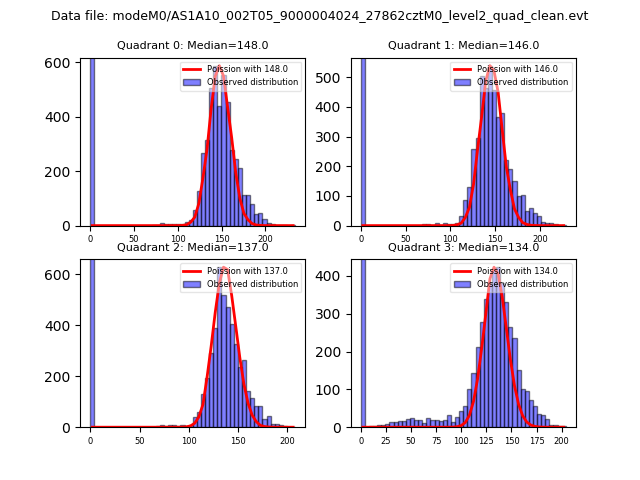
| Comparison with Poisson distribution Blue bars denote a histogram of data divided into 1 sec bins. Red curve is a Poisson curve with rate = median count rate of data. |
 |
 |
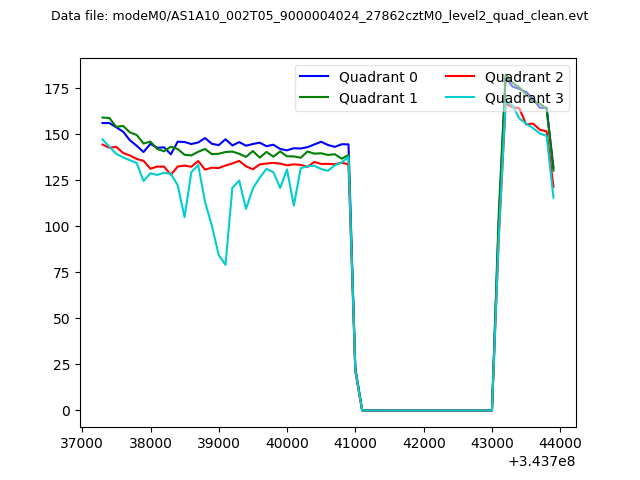
| Quadrant-wise count rates Data is divided into 100 sec bins |
 |
|
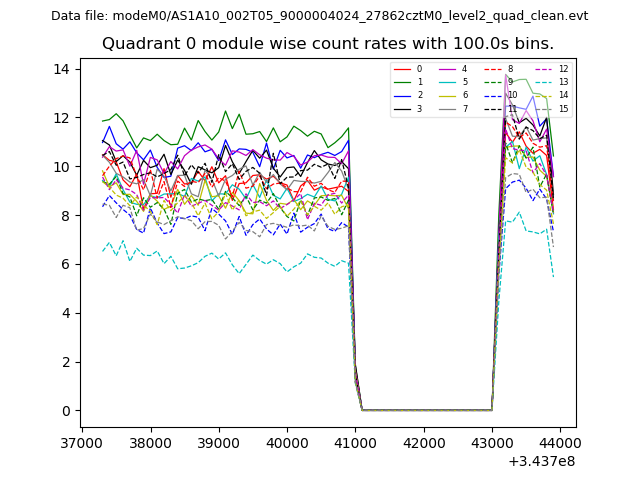
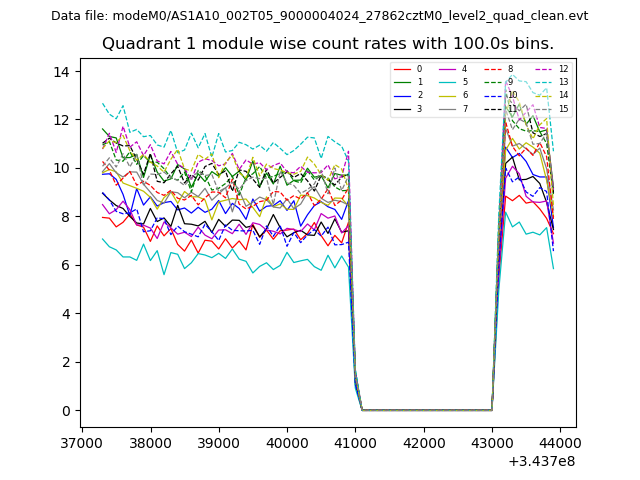
| Module-wise count rates for Quadrant A Data is divided into 100 sec bins |
 |
 |
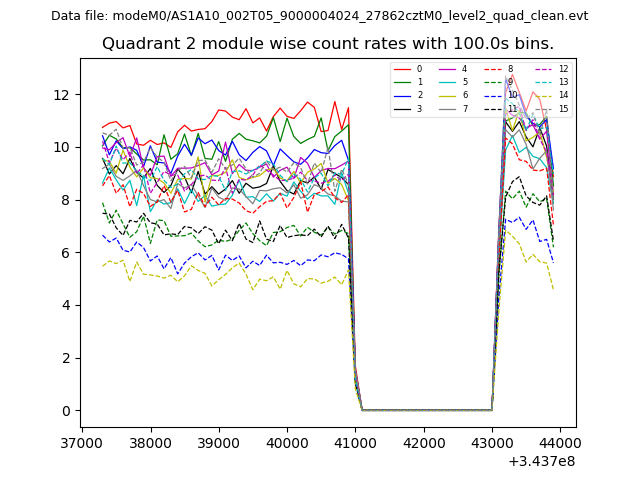
| Module-wise count rates for Quadrant B Data is divided into 100 sec bins |
 |
 |
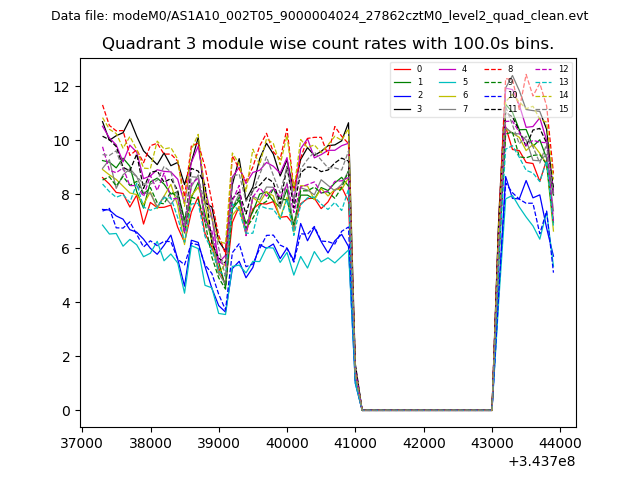
| Module-wise count rates for Quadrant C Data is divided into 100 sec bins |
 |
 |
| Module-wise count rates for Quadrant D Data is divided into 100 sec bins |
 |
 |
| Parameter | Plot |
|---|---|
| CZT HV Monitor | 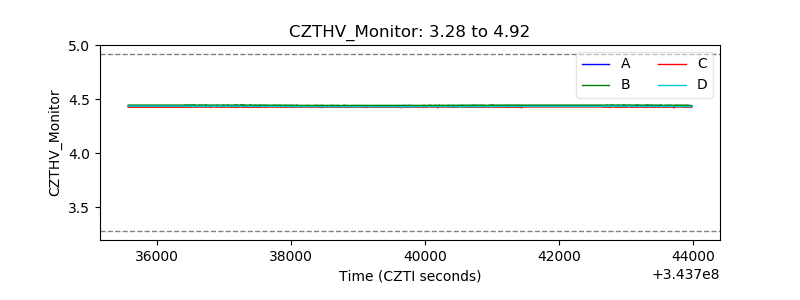 |
| D_VDD |  |
| Temperature 1 | 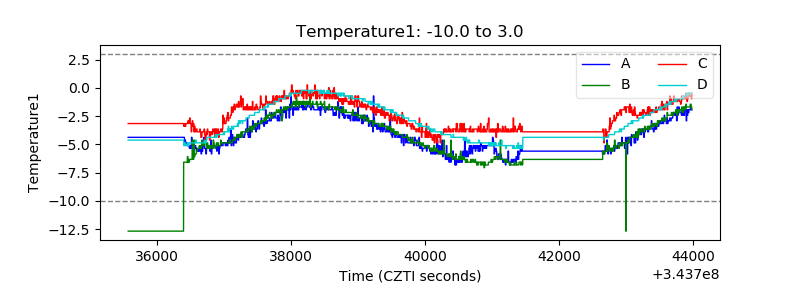 |
| Veto HV Monitor | 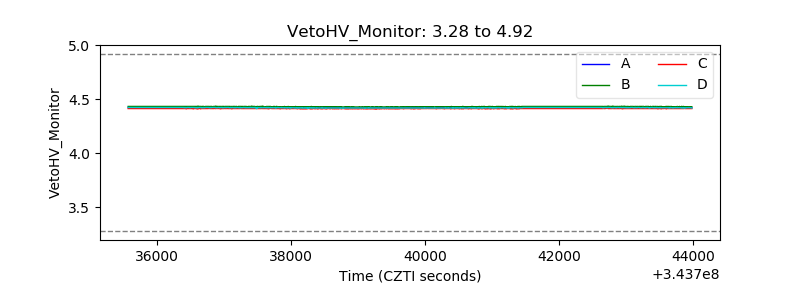 |
| Veto LLD | 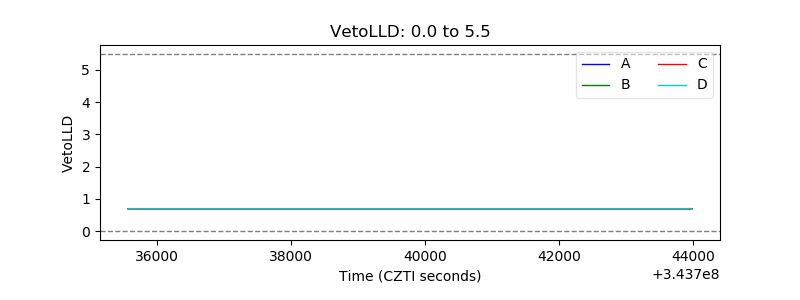 |
| Alpha Counter | 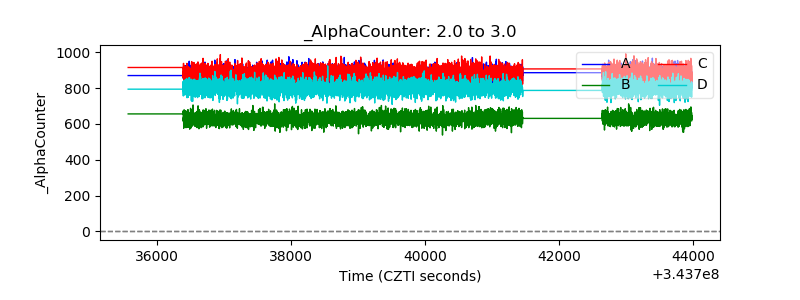 |
| _CPM_Rate | 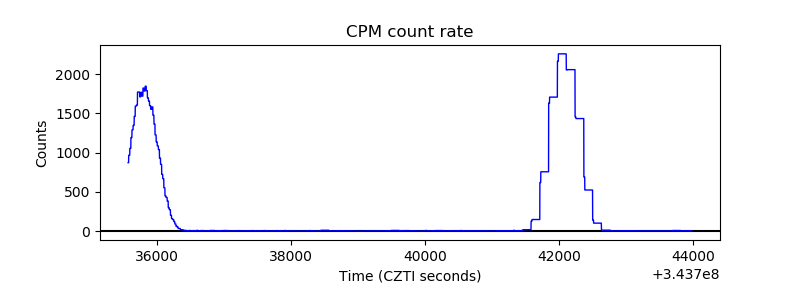 |
| CZT Counter | 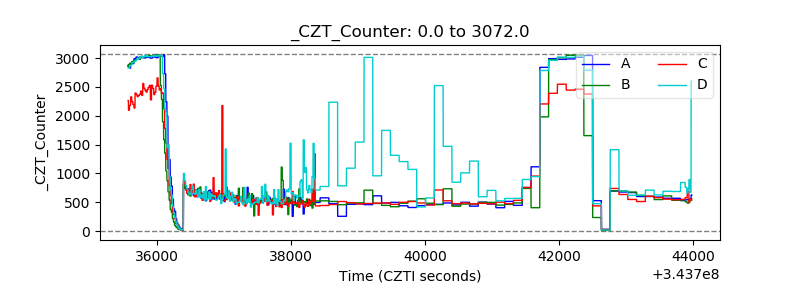 |
| +2.5 Volts monitor |  |
| +5 Volts monitor |  |
| _ROLL_ROT | 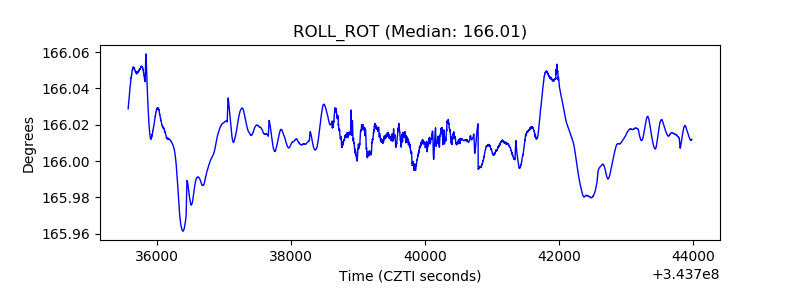 |
| _Roll_DEC |  |
| _Roll_RA | 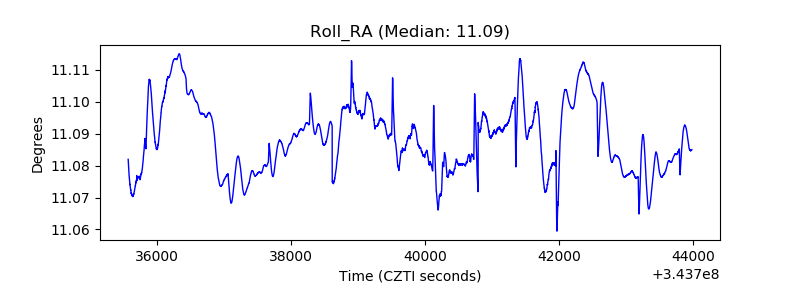 |
| Veto Counter | 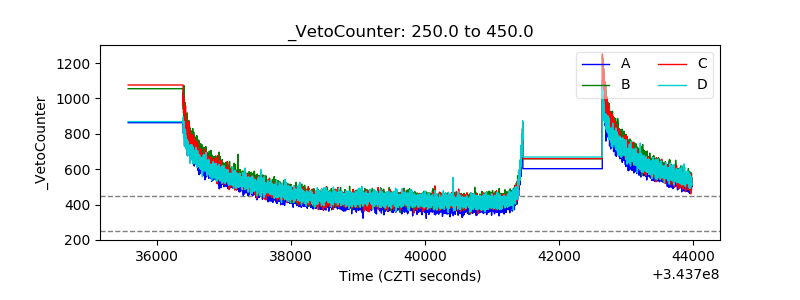 |