| Param | Original file | Final file |
|---|---|---|
| Filename | modeM0/AS1A10_002T05_9000004024_27863cztM0_level2.evt | modeM0/AS1A10_002T05_9000004024_27863cztM0_level2_quad_clean.evt |
| Size (bytes) | 566,524,800 | 122,624,640 |
| Size | 540.3 MB | 116.9 MB |
| Events in quadrant A | 3,643,655 | 856,375 |
| Events in quadrant B | 3,833,901 | 840,214 |
| Events in quadrant C | 3,759,818 | 782,146 |
| Events in quadrant D | 5,471,523 | 773,764 |
| Mode M0 | |||
|---|---|---|---|
| Quadrant | BADHDUFLAG | Total packets | Discarded packets |
| A | 0 | 15050 | 0 |
| B | 0 | 15656 | 0 |
| C | 0 | 15273 | 0 |
| D | 0 | 20864 | 0 |
| Mode M9 | |||
|---|---|---|---|
| Quadrant | BADHDUFLAG | Total packets | Discarded packets |
| A | 0 | 21 | 0 |
| B | 0 | 22 | 0 |
| C | 0 | 22 | 0 |
| D | 0 | 22 | 0 |
| Quadrant | Total seconds | Saturated seconds | Saturation percentage |
|---|---|---|---|
| A | 6620 | 103 | 1.555891% |
| B | 6620 | 142 | 2.145015% |
| C | 6619 | 176 | 2.659012% |
| D | 6619 | 426 | 6.436018% |
Noise dominated data is calculated using 1-second bins in cleaned event files. If a bin has >2000 counts, and if more than 50% of those come from <1% of pixels, then it is considered to be noise-dominated and hence unusable.
| Quadrant | # 1 sec bins | Bins with >0 counts | Bins with >2000 counts | High rate bins dominated by noise | Noise dominated (total time) | Noise dominated (detector-on time) | Marked lightcurve |
|---|---|---|---|---|---|---|---|
| A | 7870 | 6620 | 0 | 0 | 0.00% | 0.00% | 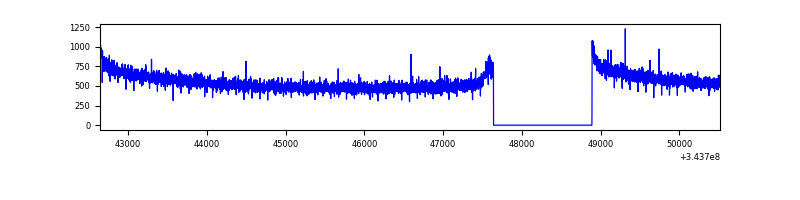 |
| B | 7870 | 6620 | 4 | 4 | 0.05% | 0.06% | 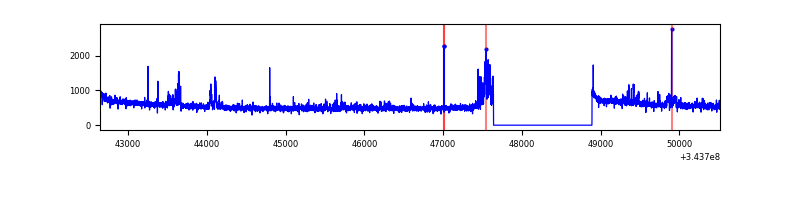 |
| C | 7869 | 6619 | 45 | 45 | 0.57% | 0.68% | 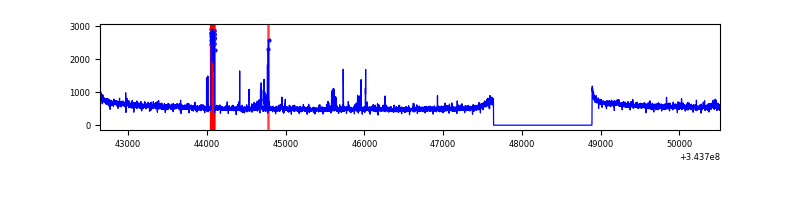 |
| D | 7869 | 6619 | 323 | 323 | 4.10% | 4.88% | 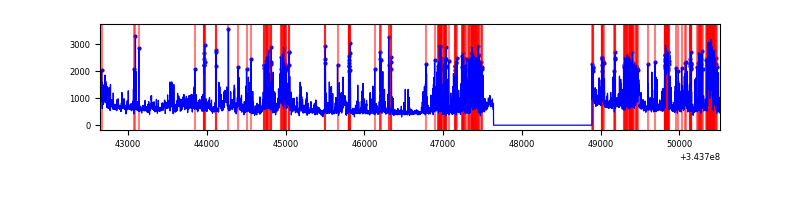 |
Top three noisy pixels from each quadrant. If the there are fewer than three noisy pixels in the level2.evt file, extra rows are filled as -1
| Pixel properties | Quadrant properties | ||||||
|---|---|---|---|---|---|---|---|
| Quadrant | DetID | PixID | Counts | Sigma | Mean | Median | Sigma |
| A | 13 | 254 | 10521 | 51.19 | 945 | 928 | 187.4 |
| A | 0 | 226 | 8387 | 39.81 | 945 | 928 | 187.4 |
| A | 3 | 137 | 7886 | 37.13 | 945 | 928 | 187.4 |
| B | 10 | 245 | 96972 | 566.93 | 911 | 893 | 169.5 |
| B | 0 | 190 | 52428 | 304.09 | 911 | 893 | 169.5 |
| B | 0 | 230 | 49066 | 284.25 | 911 | 893 | 169.5 |
| C | 14 | 238 | 141484 | 703.46 | 871 | 879 | 199.9 |
| C | 2 | 16 | 117712 | 584.53 | 871 | 879 | 199.9 |
| C | 15 | 208 | 66183 | 326.72 | 871 | 879 | 199.9 |
| D | 13 | 104 | 997771 | 4786.9 | 891 | 873 | 208.3 |
| D | 1 | 52 | 683444 | 3277.57 | 891 | 873 | 208.3 |
| D | 2 | 250 | 383455 | 1837.08 | 891 | 873 | 208.3 |
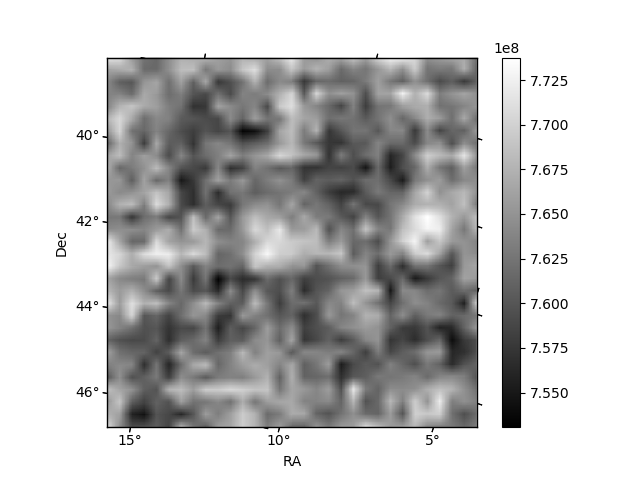
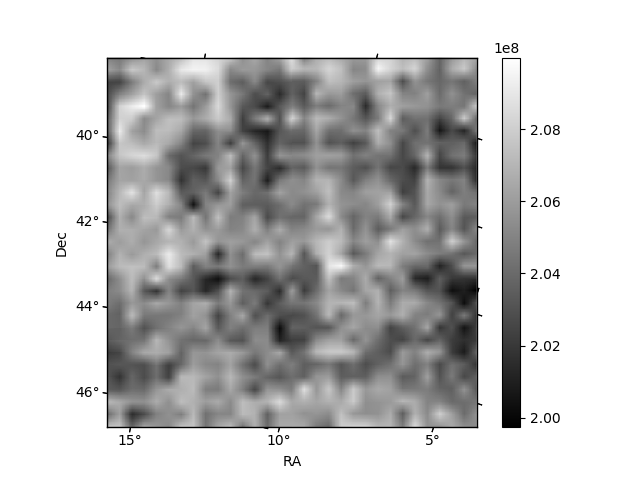
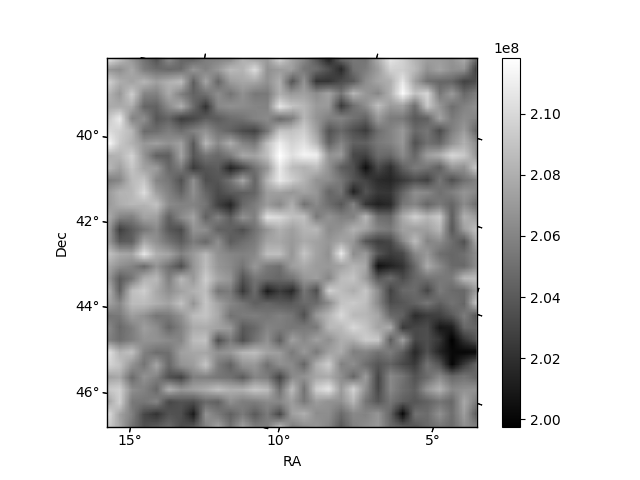
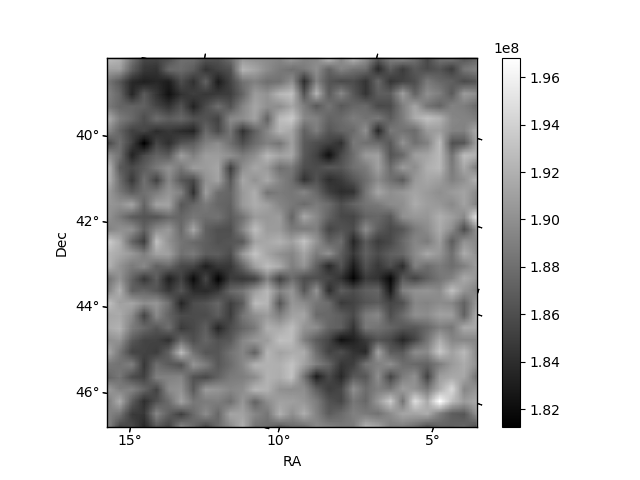
Histogram calculated using DETX and DETY for each event in the final _common_clean file
| Quadrant A | 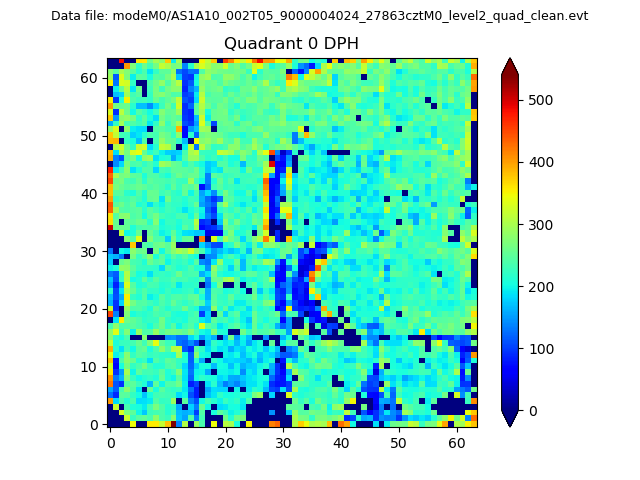 |
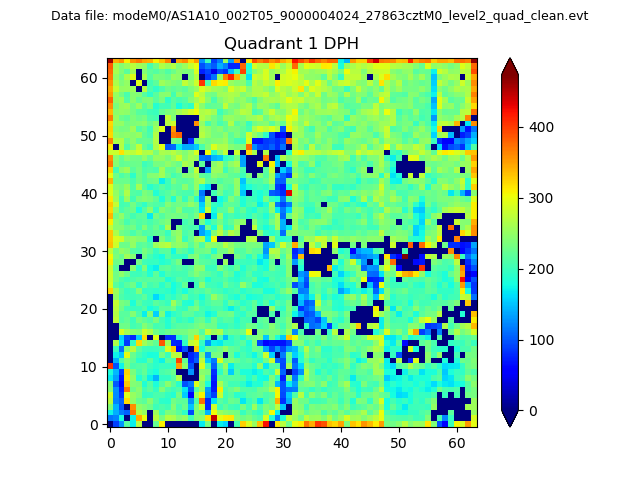 |
Quadrant B |
|---|---|---|---|
| Quadrant D | 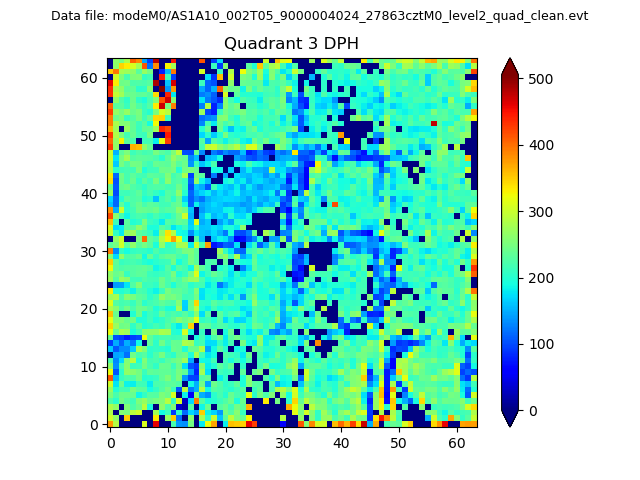 |
 |
Quadrant C |
| Plot type | Count rate plots | Images |
|---|---|---|
| Comparison with Poisson distribution Blue bars denote a histogram of data divided into 1 sec bins. Red curve is a Poisson curve with rate = median count rate of data. |
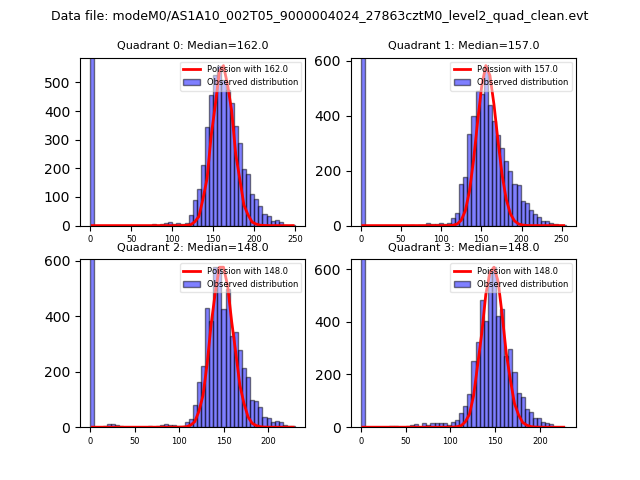 |
 |
| Quadrant-wise count rates Data is divided into 100 sec bins |
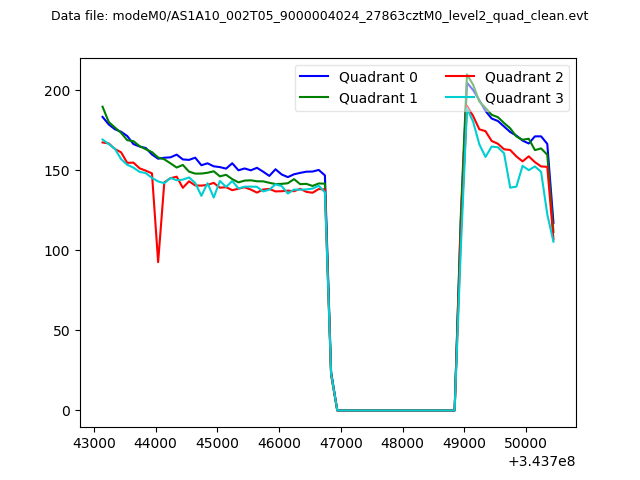 |
|
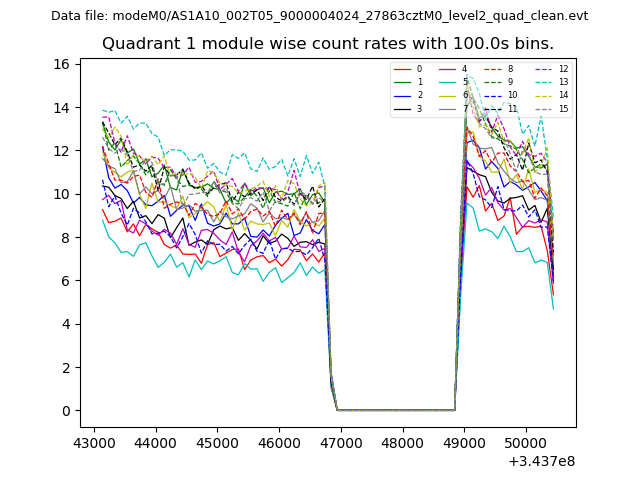
| Module-wise count rates for Quadrant A Data is divided into 100 sec bins |
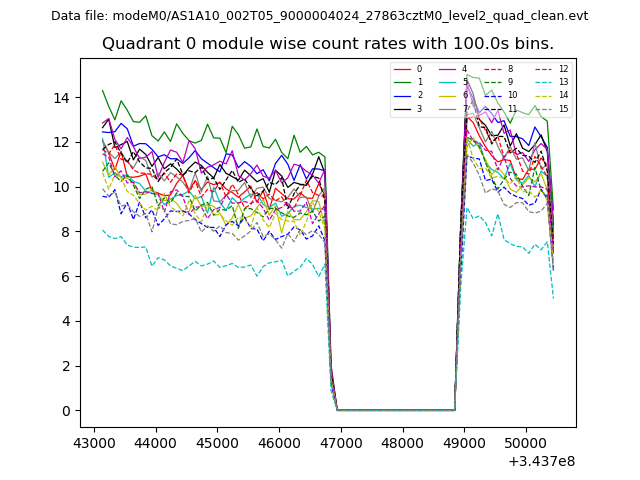 |
 |
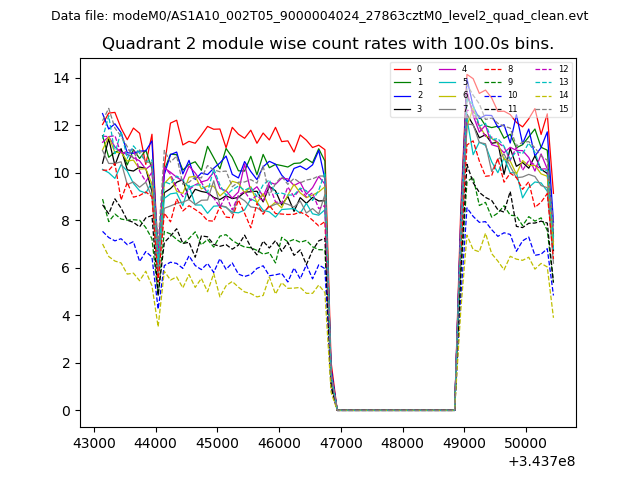
| Module-wise count rates for Quadrant B Data is divided into 100 sec bins |
 |
 |
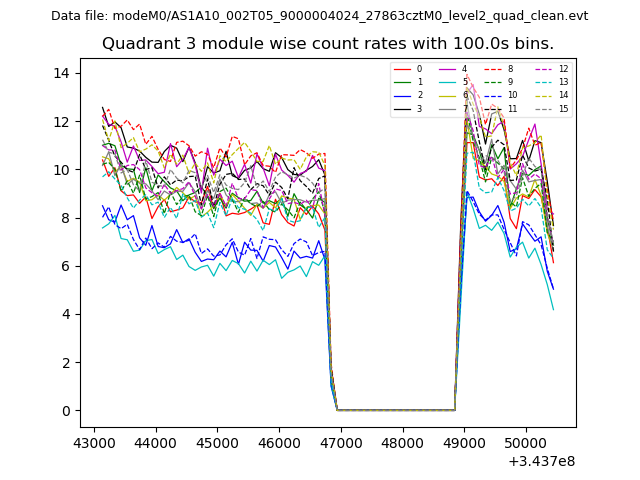
| Module-wise count rates for Quadrant C Data is divided into 100 sec bins |
 |
 |
| Module-wise count rates for Quadrant D Data is divided into 100 sec bins |
 |
 |
| Parameter | Plot |
|---|---|
| CZT HV Monitor | 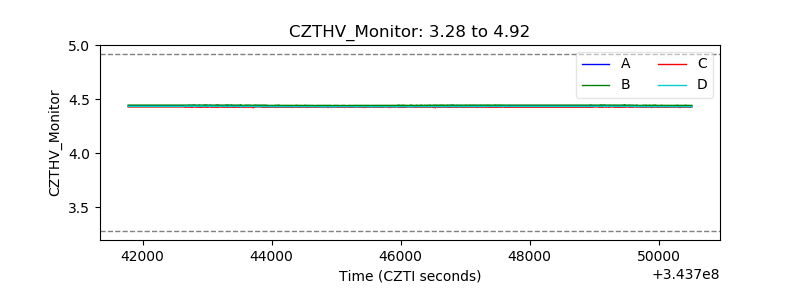 |
| D_VDD | 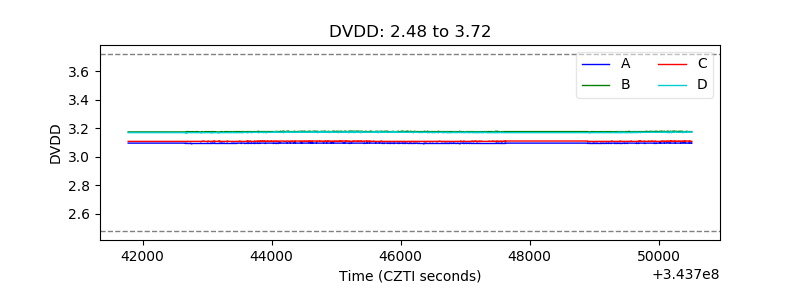 |
| Temperature 1 | 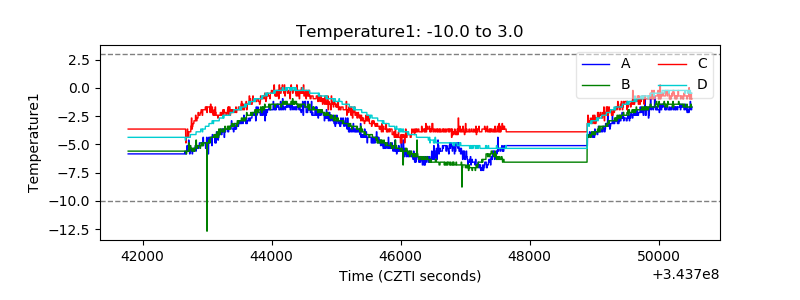 |
| Veto HV Monitor |  |
| Veto LLD | 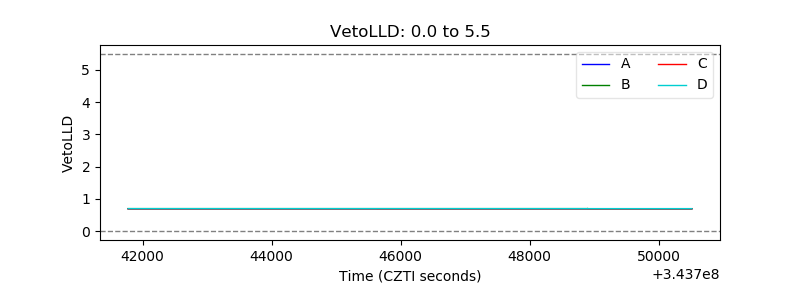 |
| Alpha Counter | 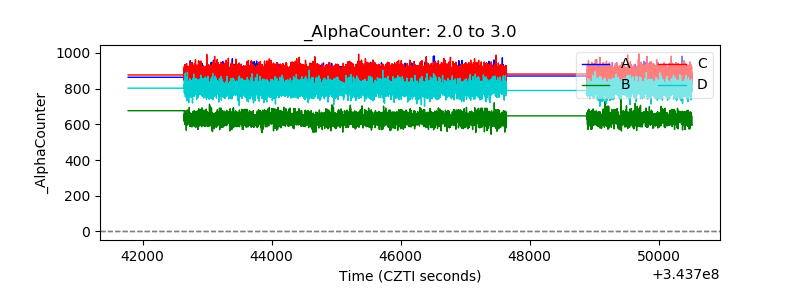 |
| _CPM_Rate | 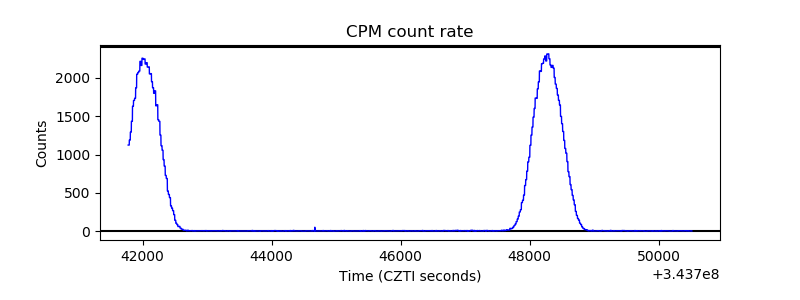 |
| CZT Counter |  |
| +2.5 Volts monitor |  |
| +5 Volts monitor |  |
| _ROLL_ROT | 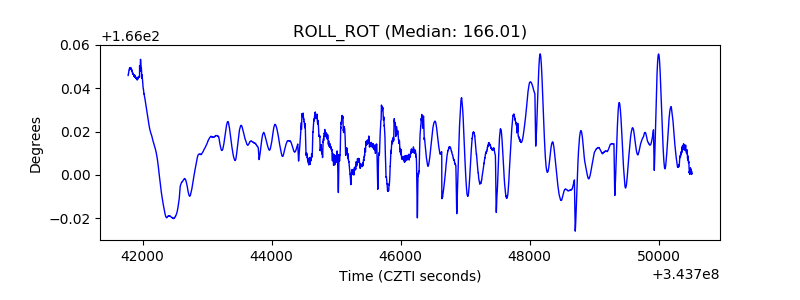 |
| _Roll_DEC | 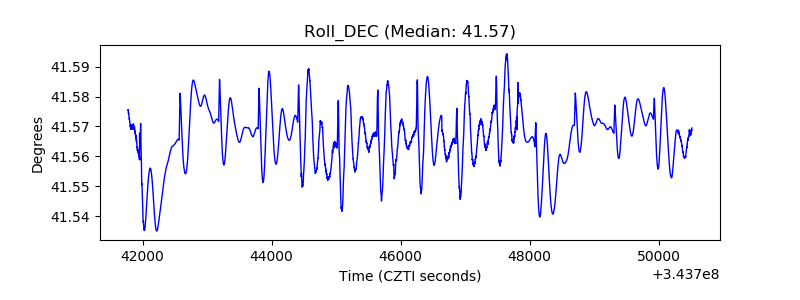 |
| _Roll_RA | 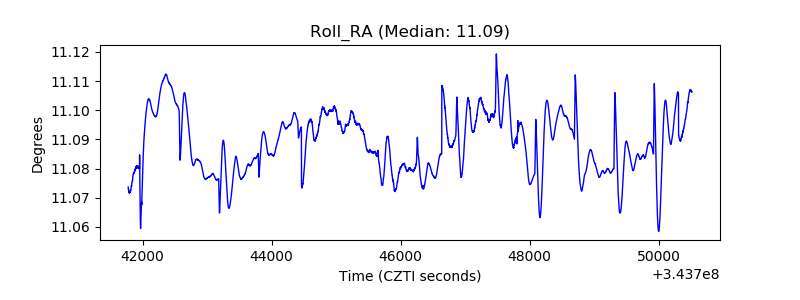 |
| Veto Counter | 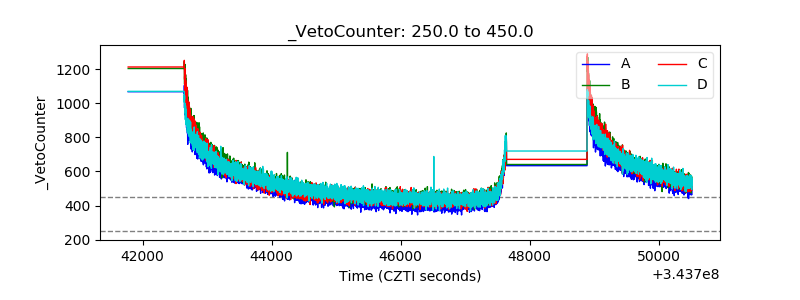 |