| Param | Original file | Final file |
|---|---|---|
| Filename | modeM0/AS1A10_002T05_9000004024_27864cztM0_level2.evt | modeM0/AS1A10_002T05_9000004024_27864cztM0_level2_quad_clean.evt |
| Size (bytes) | 585,722,880 | 107,628,480 |
| Size | 558.6 MB | 102.6 MB |
| Events in quadrant A | 3,129,951 | 770,743 |
| Events in quadrant B | 3,257,064 | 751,146 |
| Events in quadrant C | 3,217,993 | 712,797 |
| Events in quadrant D | 7,739,009 | 617,503 |
| Mode M0 | |||
|---|---|---|---|
| Quadrant | BADHDUFLAG | Total packets | Discarded packets |
| A | 0 | 12802 | 0 |
| B | 0 | 13218 | 0 |
| C | 0 | 13074 | 0 |
| D | 0 | 27094 | 0 |
| Mode M9 | |||
|---|---|---|---|
| Quadrant | BADHDUFLAG | Total packets | Discarded packets |
| A | 0 | 13 | 0 |
| B | 0 | 13 | 0 |
| C | 0 | 13 | 0 |
| D | 0 | 13 | 0 |
| Quadrant | Total seconds | Saturated seconds | Saturation percentage |
|---|---|---|---|
| A | 5823 | 104 | 1.786021% |
| B | 5824 | 119 | 2.043269% |
| C | 5823 | 137 | 2.352739% |
| D | 5823 | 1927 | 33.092907% |
Noise dominated data is calculated using 1-second bins in cleaned event files. If a bin has >2000 counts, and if more than 50% of those come from <1% of pixels, then it is considered to be noise-dominated and hence unusable.
| Quadrant | # 1 sec bins | Bins with >0 counts | Bins with >2000 counts | High rate bins dominated by noise | Noise dominated (total time) | Noise dominated (detector-on time) | Marked lightcurve |
|---|---|---|---|---|---|---|---|
| A | 7098 | 5823 | 0 | 0 | 0.00% | 0.00% | 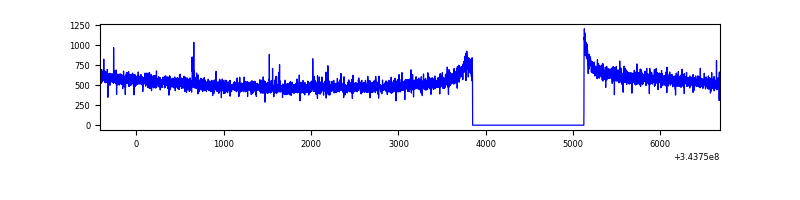 |
| B | 7099 | 5824 | 3 | 3 | 0.04% | 0.05% | 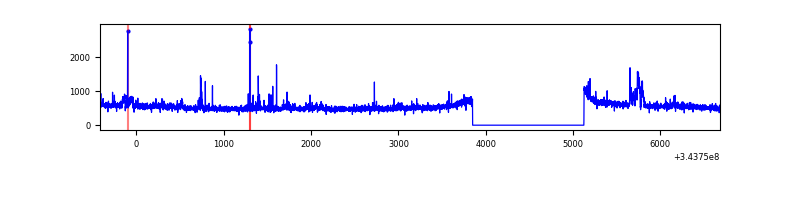 |
| C | 7098 | 5823 | 0 | 0 | 0.00% | 0.00% |  |
| D | 7098 | 5823 | 1475 | 1475 | 20.78% | 25.33% | 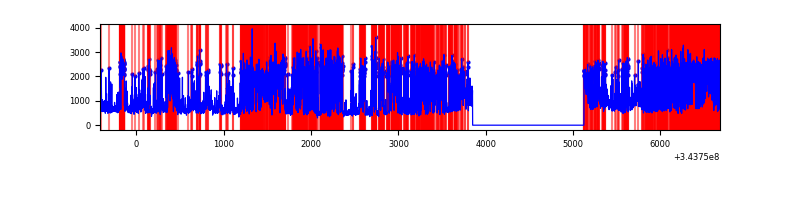 |
Top three noisy pixels from each quadrant. If the there are fewer than three noisy pixels in the level2.evt file, extra rows are filled as -1
| Pixel properties | Quadrant properties | ||||||
|---|---|---|---|---|---|---|---|
| Quadrant | DetID | PixID | Counts | Sigma | Mean | Median | Sigma |
| A | 6 | 16 | 10074 | 58.11 | 807 | 794 | 159.7 |
| A | 13 | 254 | 9646 | 55.43 | 807 | 794 | 159.7 |
| A | 13 | 248 | 7794 | 43.83 | 807 | 794 | 159.7 |
| B | 15 | 32 | 72572 | 493.39 | 780 | 762 | 145.5 |
| B | 10 | 245 | 50608 | 342.48 | 780 | 762 | 145.5 |
| B | 0 | 230 | 30034 | 201.12 | 780 | 762 | 145.5 |
| C | 3 | 233 | 144356 | 826.63 | 754 | 760 | 173.7 |
| C | 14 | 238 | 122169 | 698.91 | 754 | 760 | 173.7 |
| C | 15 | 208 | 11223 | 60.23 | 754 | 760 | 173.7 |
| D | 13 | 104 | 4204332 | 25895.52 | 685 | 668 | 162.3 |
| D | 1 | 52 | 420017 | 2583.28 | 685 | 668 | 162.3 |
| D | 2 | 250 | 402568 | 2475.79 | 685 | 668 | 162.3 |
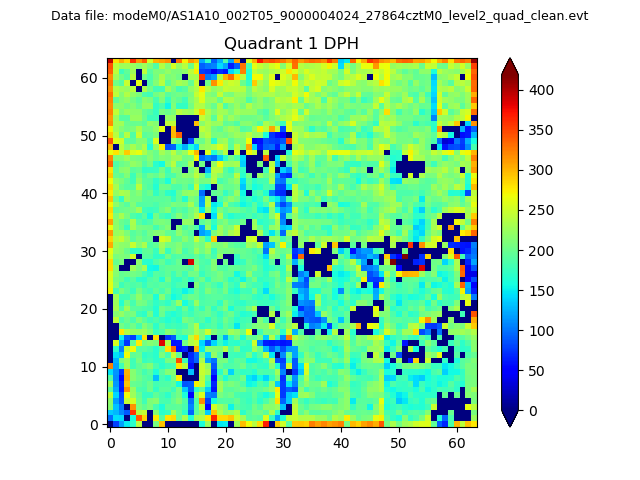
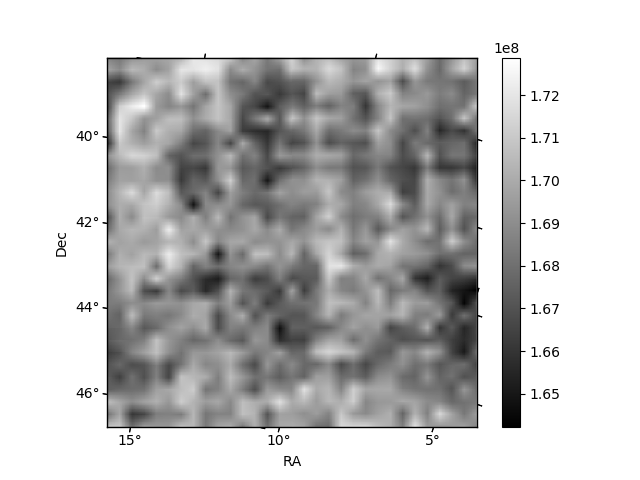
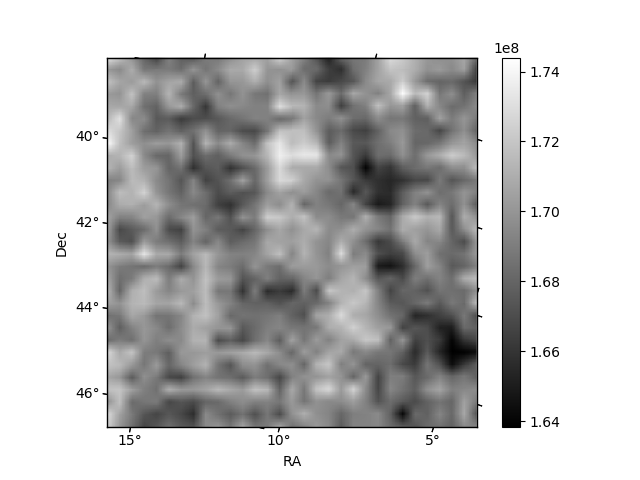
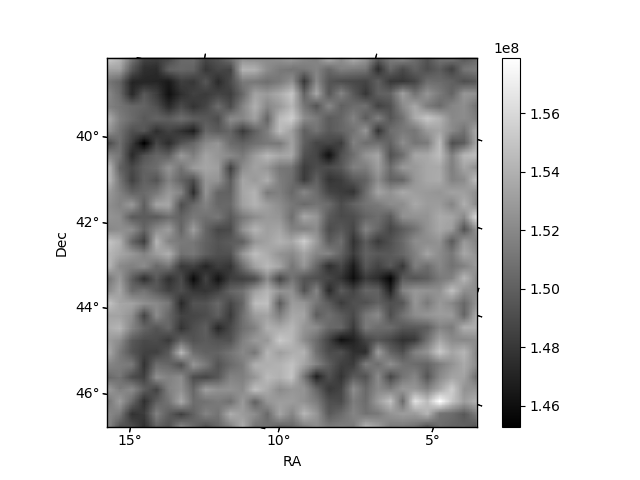
Histogram calculated using DETX and DETY for each event in the final _common_clean file
| Quadrant A | 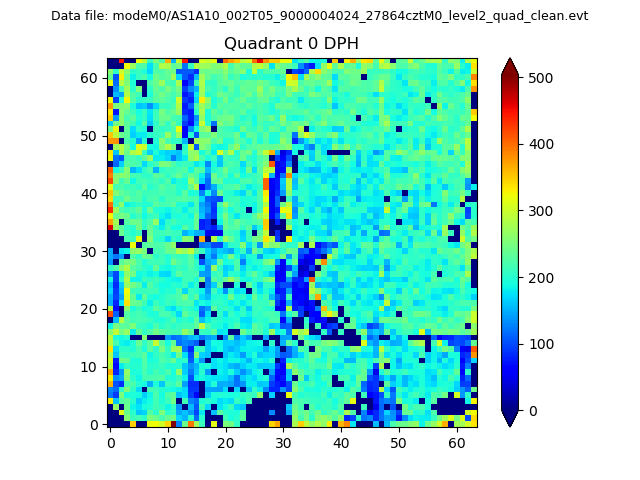 |
 |
Quadrant B |
|---|---|---|---|
| Quadrant D | 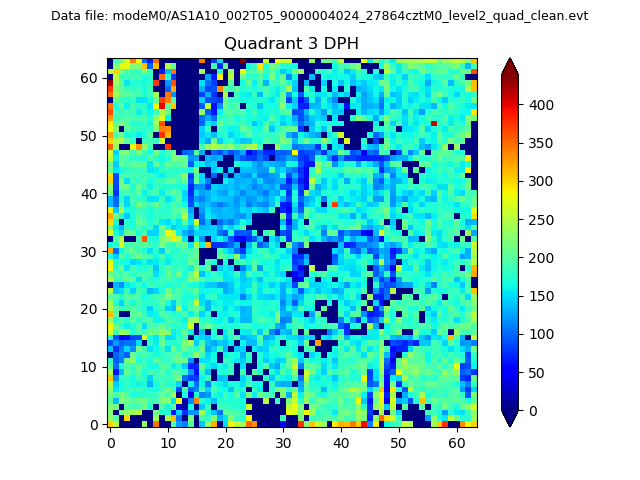 |
 |
Quadrant C |
| Plot type | Count rate plots | Images |
|---|---|---|
| Comparison with Poisson distribution Blue bars denote a histogram of data divided into 1 sec bins. Red curve is a Poisson curve with rate = median count rate of data. |
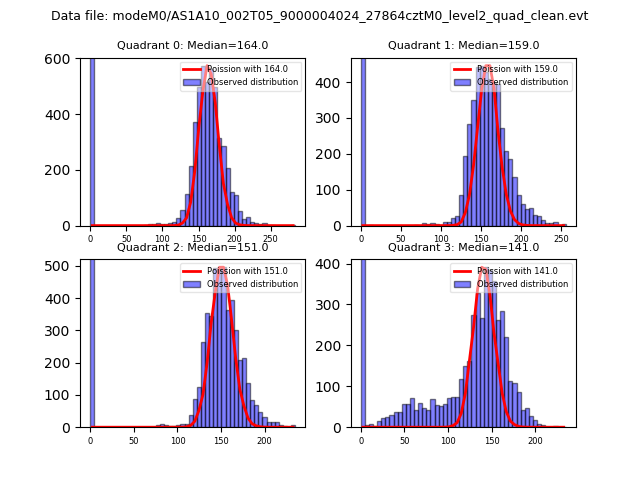 |
 |
| Quadrant-wise count rates Data is divided into 100 sec bins |
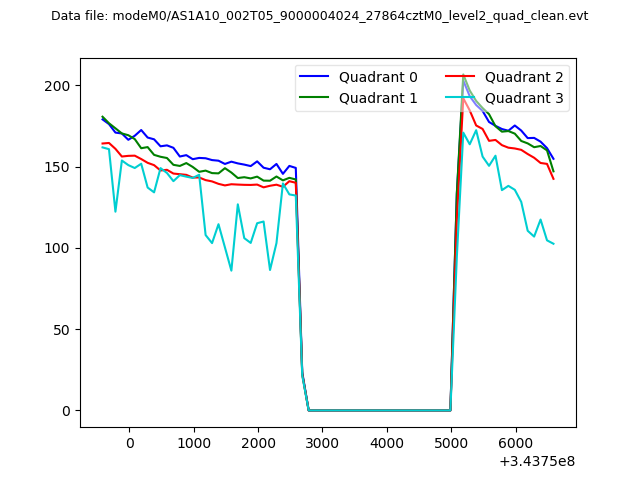 |
|
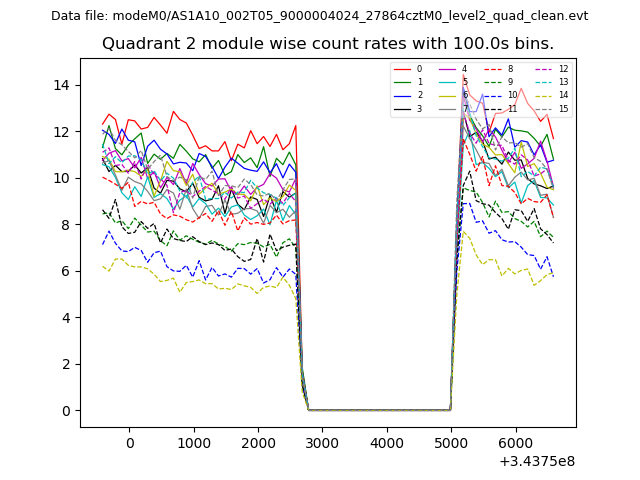
| Module-wise count rates for Quadrant A Data is divided into 100 sec bins |
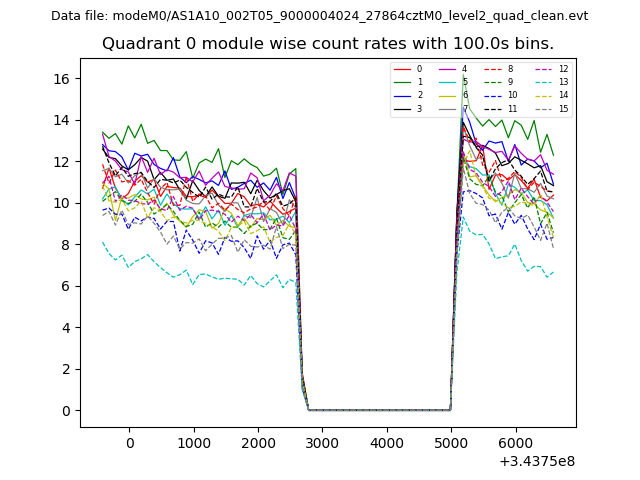 |
 |
| Module-wise count rates for Quadrant B Data is divided into 100 sec bins |
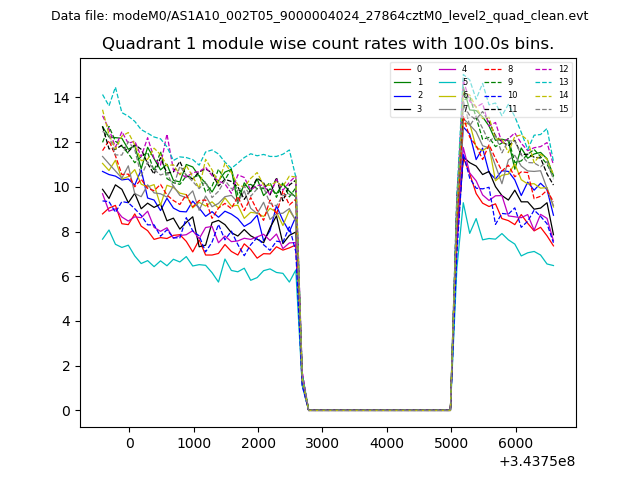 |
 |
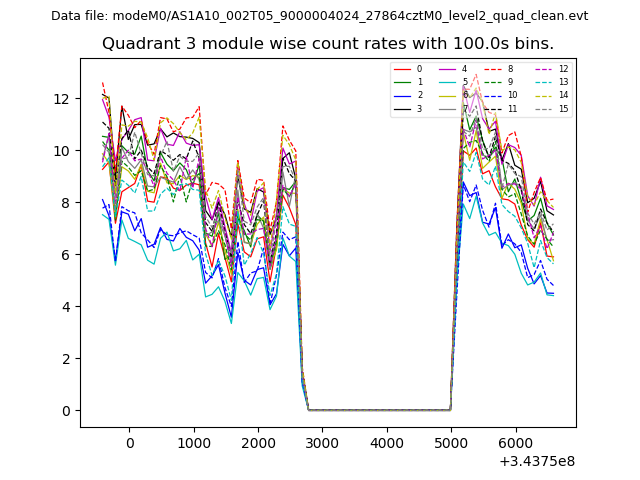
| Module-wise count rates for Quadrant C Data is divided into 100 sec bins |
 |
 |
| Module-wise count rates for Quadrant D Data is divided into 100 sec bins |
 |
 |
| Parameter | Plot |
|---|---|
| CZT HV Monitor | 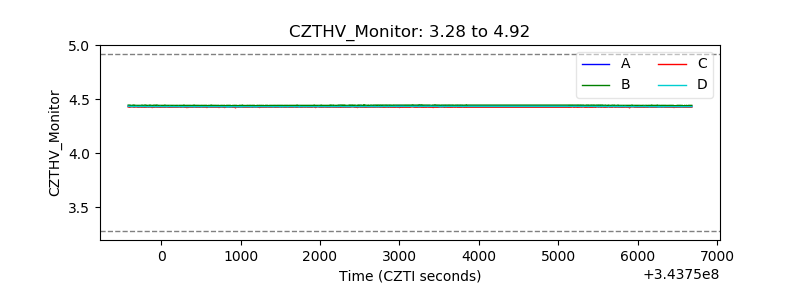 |
| D_VDD | 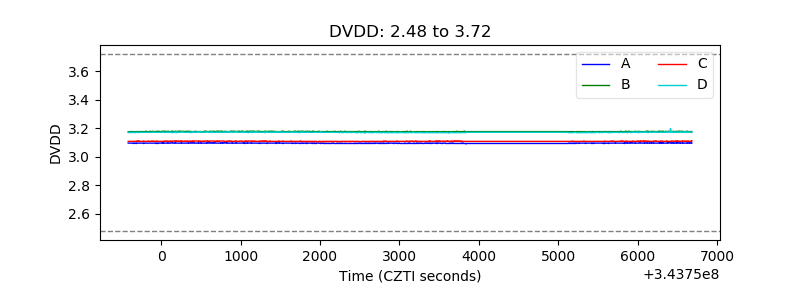 |
| Temperature 1 | 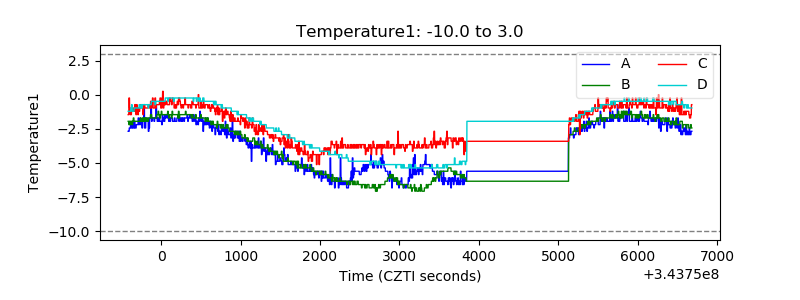 |
| Veto HV Monitor | 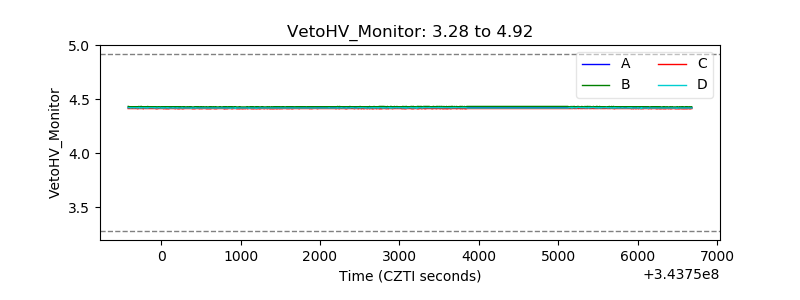 |
| Veto LLD | 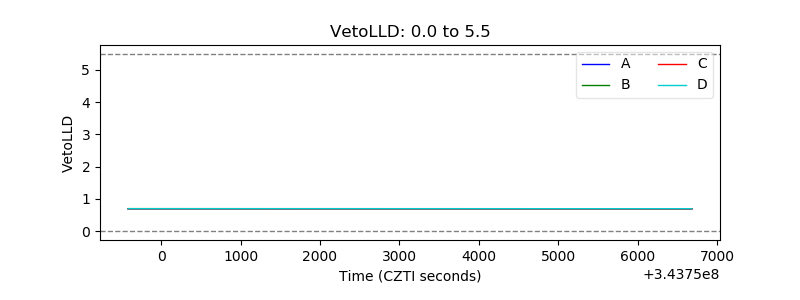 |
| Alpha Counter | 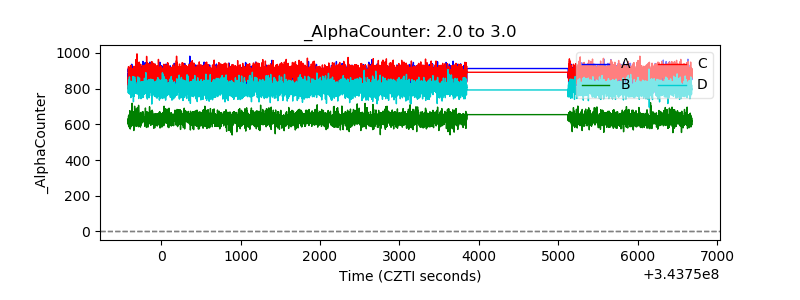 |
| _CPM_Rate | 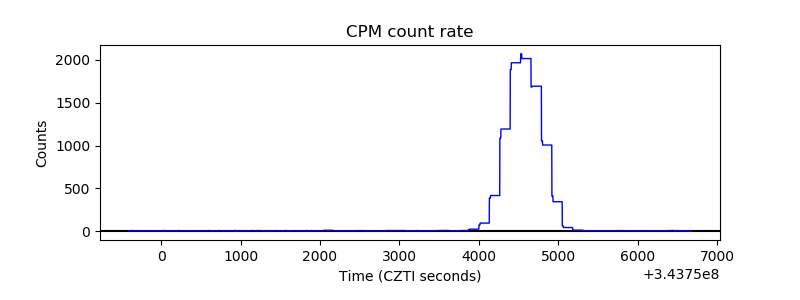 |
| CZT Counter | 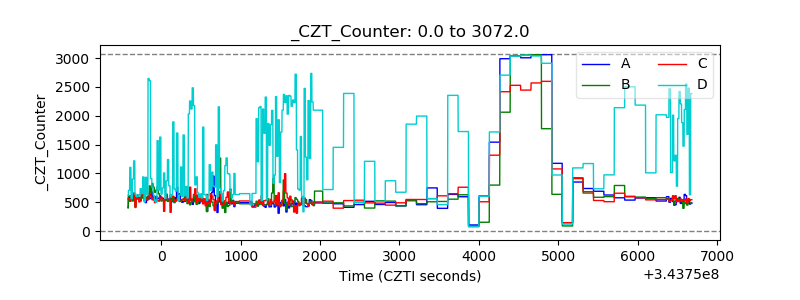 |
| +2.5 Volts monitor |  |
| +5 Volts monitor |  |
| _ROLL_ROT | 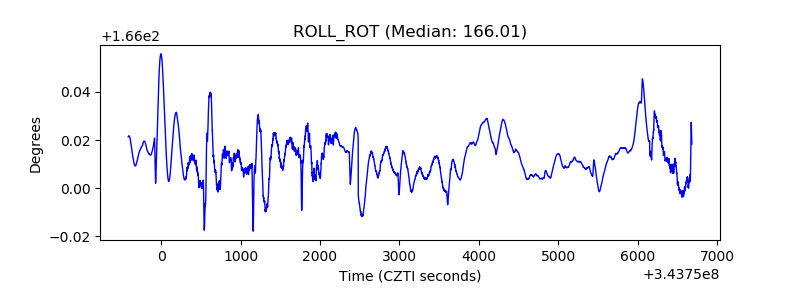 |
| _Roll_DEC | 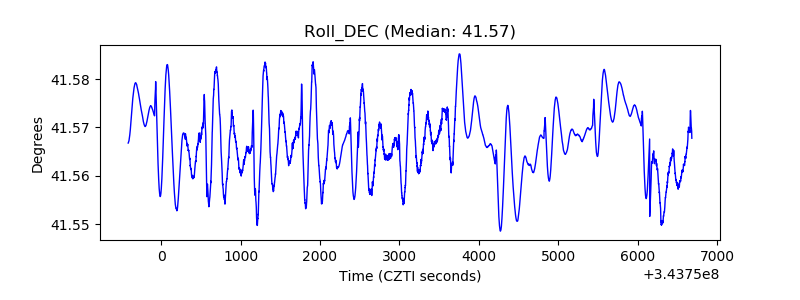 |
| _Roll_RA | 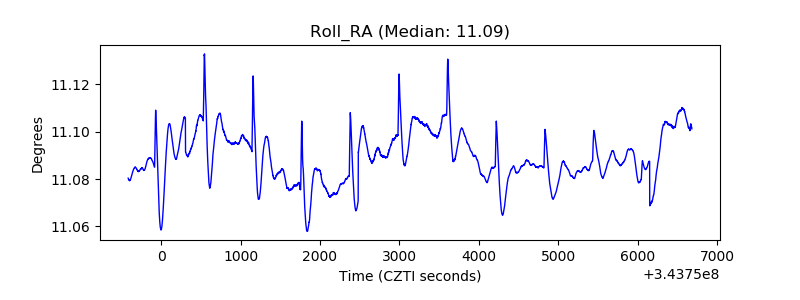 |
| Veto Counter | 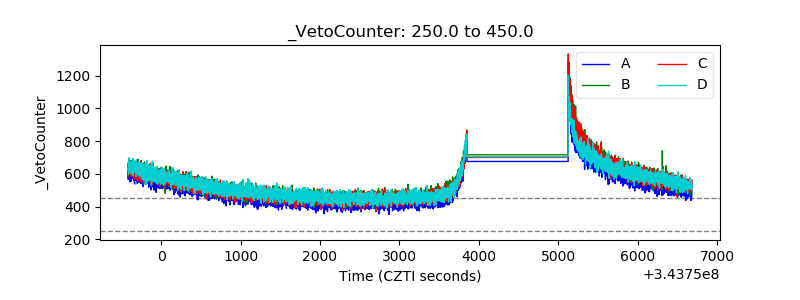 |