| Param | Original file | Final file |
|---|---|---|
| Filename | modeM0/AS1A10_002T05_9000004024_27865cztM0_level2.evt | modeM0/AS1A10_002T05_9000004024_27865cztM0_level2_quad_clean.evt |
| Size (bytes) | 601,464,960 | 112,155,840 |
| Size | 573.6 MB | 107.0 MB |
| Events in quadrant A | 3,427,363 | 788,016 |
| Events in quadrant B | 3,556,684 | 773,785 |
| Events in quadrant C | 3,482,000 | 735,229 |
| Events in quadrant D | 7,312,244 | 649,345 |
| Mode M0 | |||
|---|---|---|---|
| Quadrant | BADHDUFLAG | Total packets | Discarded packets |
| A | 0 | 14166 | 0 |
| B | 0 | 14576 | 0 |
| C | 0 | 14249 | 0 |
| D | 0 | 26142 | 0 |
| Mode M9 | |||
|---|---|---|---|
| Quadrant | BADHDUFLAG | Total packets | Discarded packets |
| A | 0 | 13 | 0 |
| B | 0 | 14 | 0 |
| C | 0 | 14 | 0 |
| D | 0 | 14 | 0 |
| Quadrant | Total seconds | Saturated seconds | Saturation percentage |
|---|---|---|---|
| A | 6454 | 105 | 1.626898% |
| B | 6454 | 117 | 1.812829% |
| C | 6454 | 163 | 2.525566% |
| D | 6453 | 1521 | 23.570432% |
Noise dominated data is calculated using 1-second bins in cleaned event files. If a bin has >2000 counts, and if more than 50% of those come from <1% of pixels, then it is considered to be noise-dominated and hence unusable.
| Quadrant | # 1 sec bins | Bins with >0 counts | Bins with >2000 counts | High rate bins dominated by noise | Noise dominated (total time) | Noise dominated (detector-on time) | Marked lightcurve |
|---|---|---|---|---|---|---|---|
| A | 7699 | 6454 | 0 | 0 | 0.00% | 0.00% |  |
| B | 7699 | 6454 | 1 | 1 | 0.01% | 0.02% | 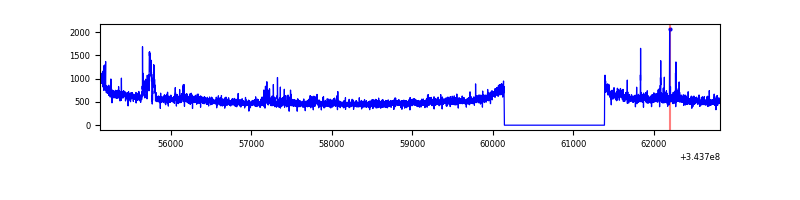 |
| C | 7699 | 6454 | 1 | 1 | 0.01% | 0.02% | 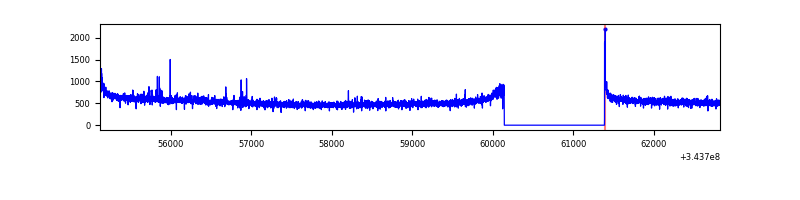 |
| D | 7697 | 6452 | 1162 | 1162 | 15.10% | 18.01% | 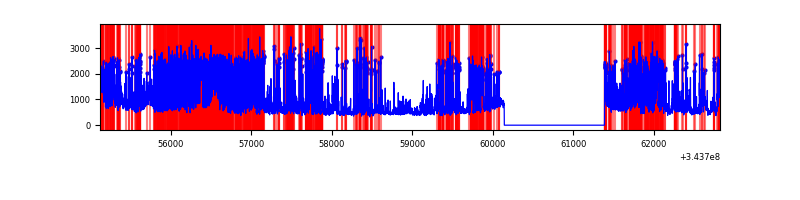 |
Top three noisy pixels from each quadrant. If the there are fewer than three noisy pixels in the level2.evt file, extra rows are filled as -1
| Pixel properties | Quadrant properties | ||||||
|---|---|---|---|---|---|---|---|
| Quadrant | DetID | PixID | Counts | Sigma | Mean | Median | Sigma |
| A | 13 | 254 | 11150 | 58.49 | 886 | 870 | 175.8 |
| A | 0 | 226 | 7827 | 39.58 | 886 | 870 | 175.8 |
| A | 3 | 137 | 7692 | 38.81 | 886 | 870 | 175.8 |
| B | 15 | 32 | 65054 | 400.07 | 863 | 842 | 160.5 |
| B | 0 | 230 | 44213 | 270.22 | 863 | 842 | 160.5 |
| B | 4 | 52 | 42976 | 262.51 | 863 | 842 | 160.5 |
| C | 14 | 238 | 134943 | 701.73 | 835 | 842 | 191.1 |
| C | 3 | 233 | 75090 | 388.53 | 835 | 842 | 191.1 |
| C | 10 | 22 | 10286 | 49.42 | 835 | 842 | 191.1 |
| D | 13 | 104 | 3550568 | 19165.92 | 779 | 760 | 185.2 |
| D | 1 | 52 | 321067 | 1729.38 | 779 | 760 | 185.2 |
| D | 2 | 250 | 307339 | 1655.26 | 779 | 760 | 185.2 |
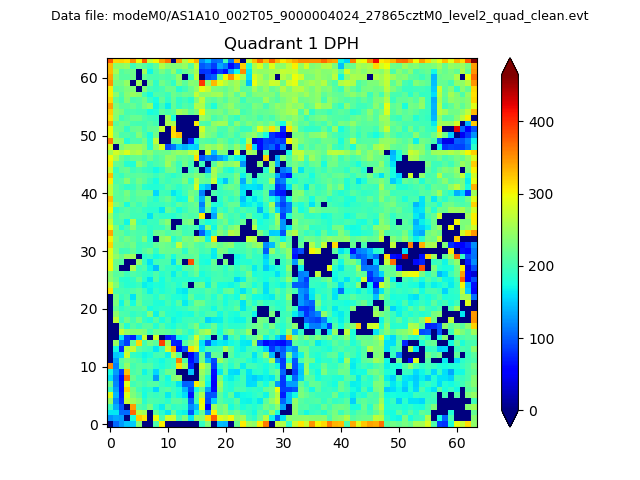
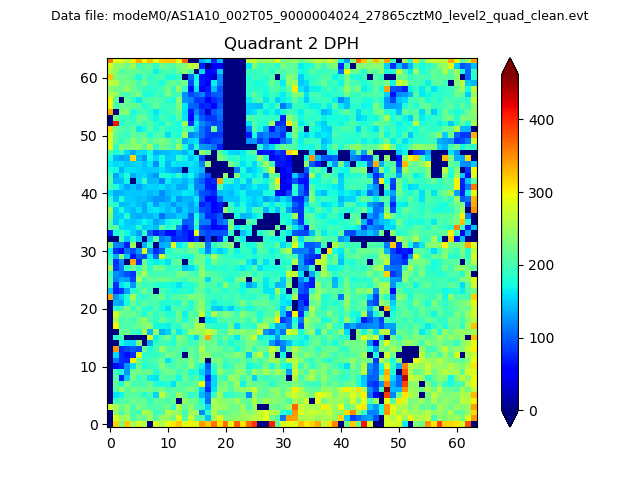
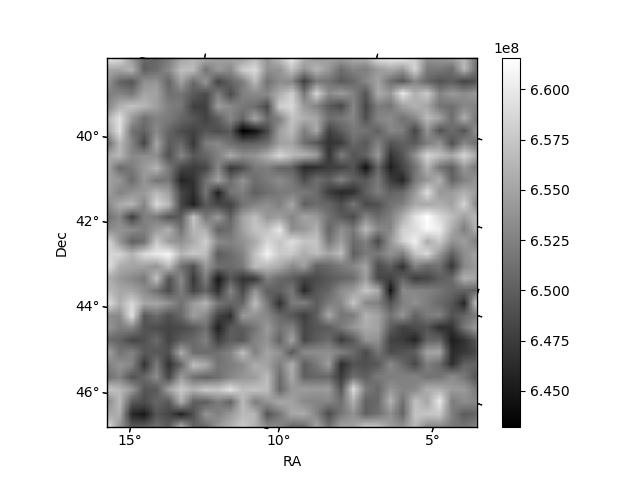
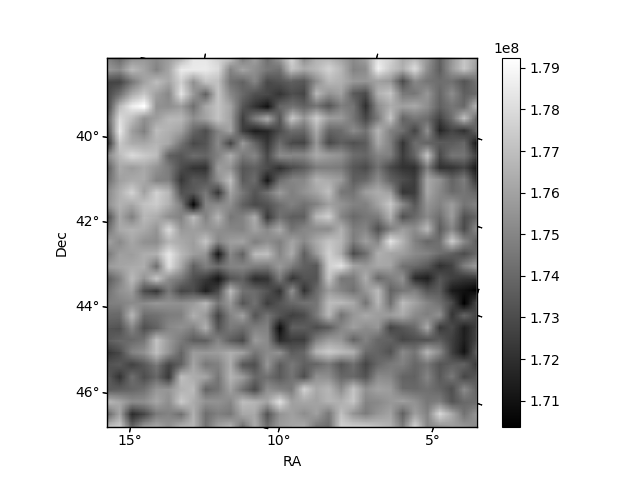
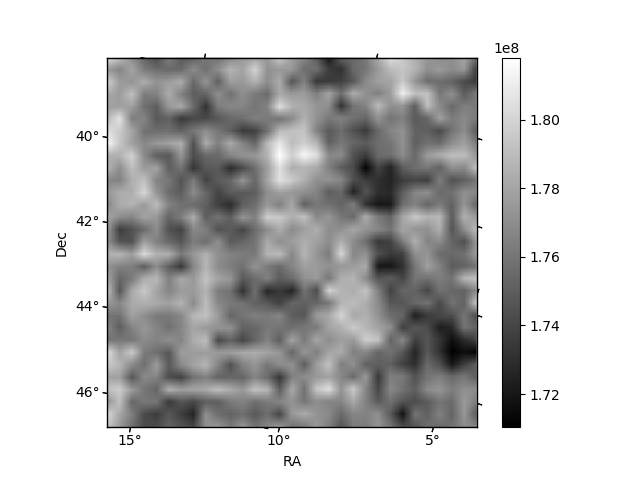
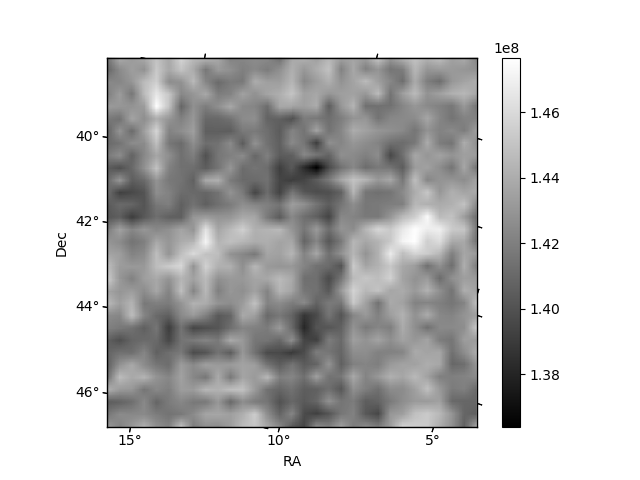
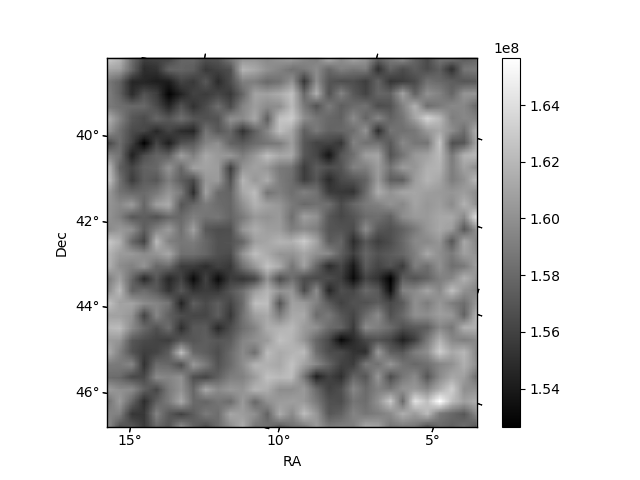
Histogram calculated using DETX and DETY for each event in the final _common_clean file
| Quadrant A | 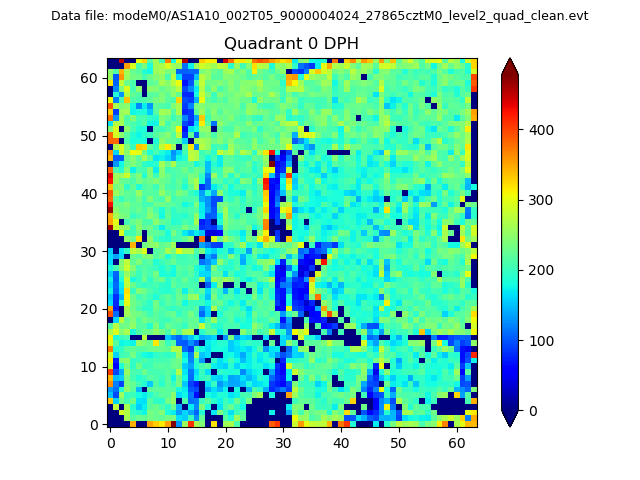 |
 |
Quadrant B |
|---|---|---|---|
| Quadrant D | 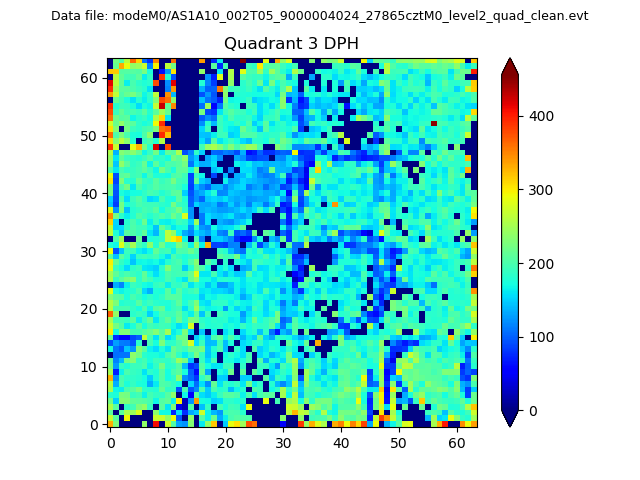 |
 |
Quadrant C |
| Plot type | Count rate plots | Images |
|---|---|---|
| Comparison with Poisson distribution Blue bars denote a histogram of data divided into 1 sec bins. Red curve is a Poisson curve with rate = median count rate of data. |
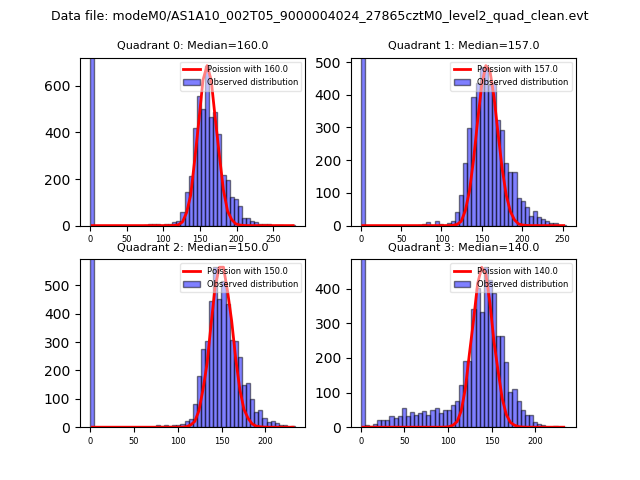 |
 |
| Quadrant-wise count rates Data is divided into 100 sec bins |
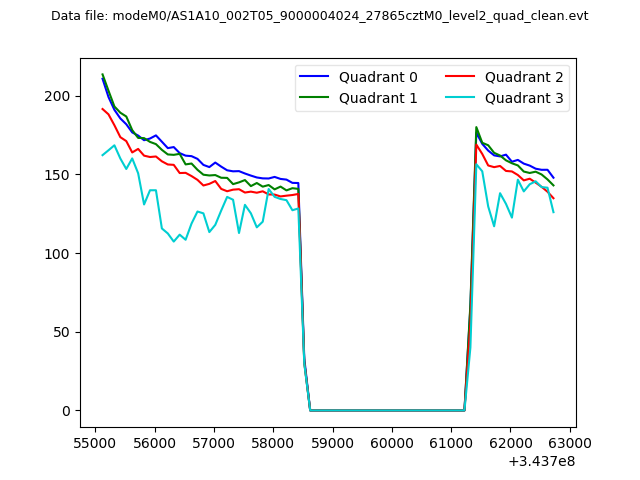 |
|
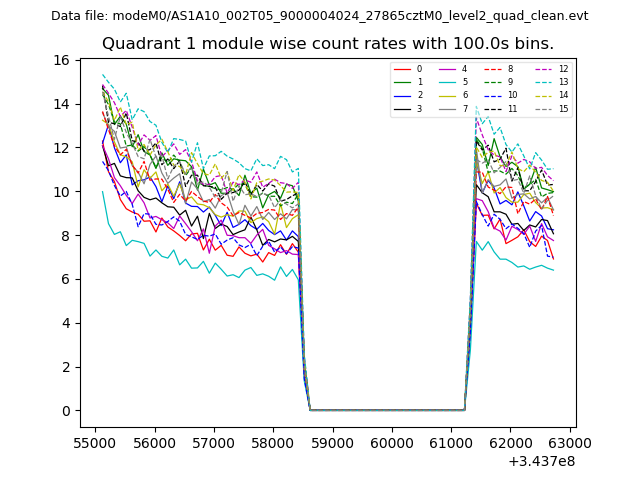
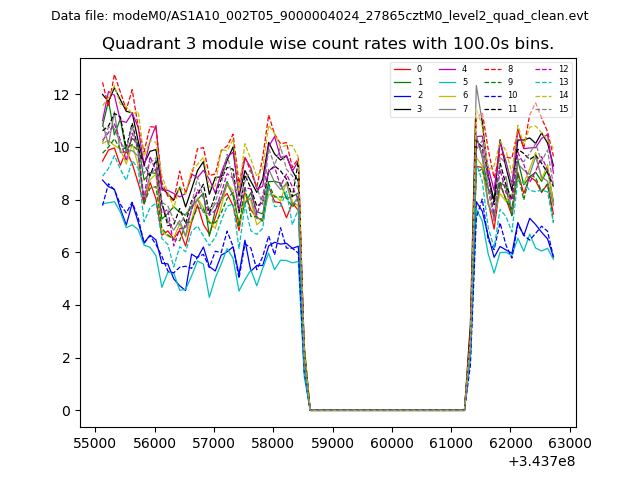
| Module-wise count rates for Quadrant A Data is divided into 100 sec bins |
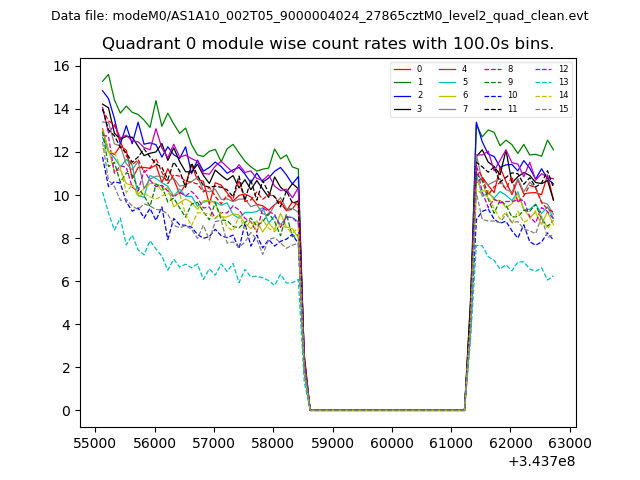 |
 |
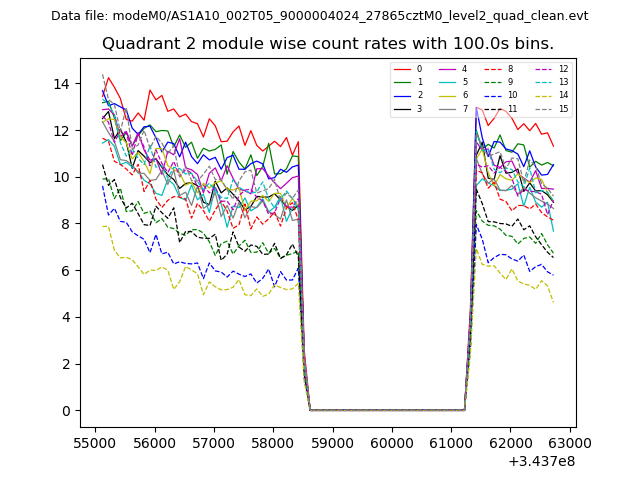
| Module-wise count rates for Quadrant B Data is divided into 100 sec bins |
 |
 |
| Module-wise count rates for Quadrant C Data is divided into 100 sec bins |
 |
 |
| Module-wise count rates for Quadrant D Data is divided into 100 sec bins |
 |
 |
| Parameter | Plot |
|---|---|
| CZT HV Monitor | 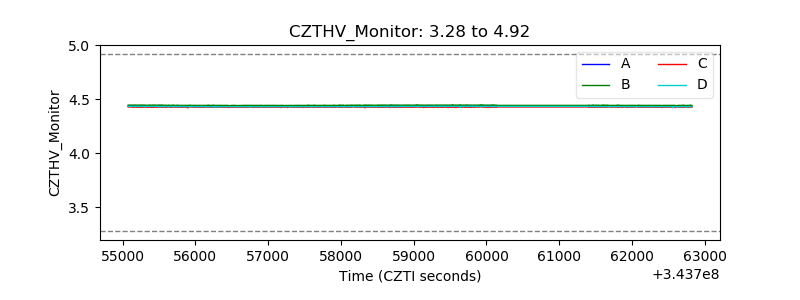 |
| D_VDD | 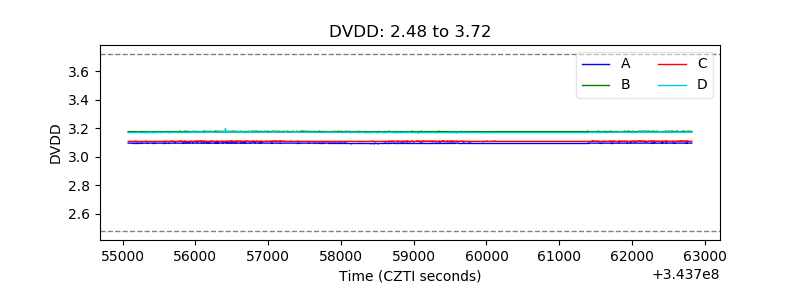 |
| Temperature 1 | 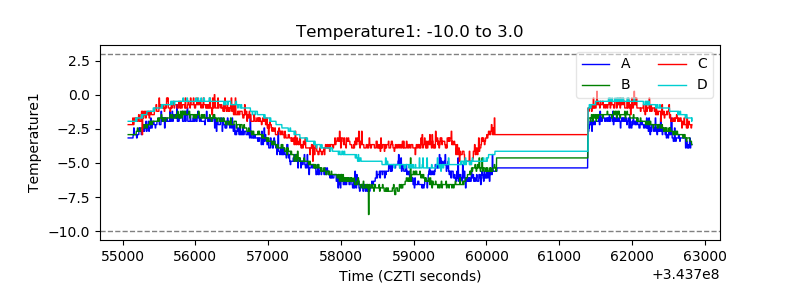 |
| Veto HV Monitor | 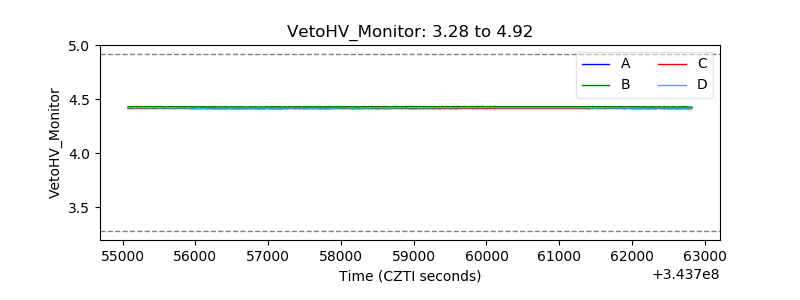 |
| Veto LLD | 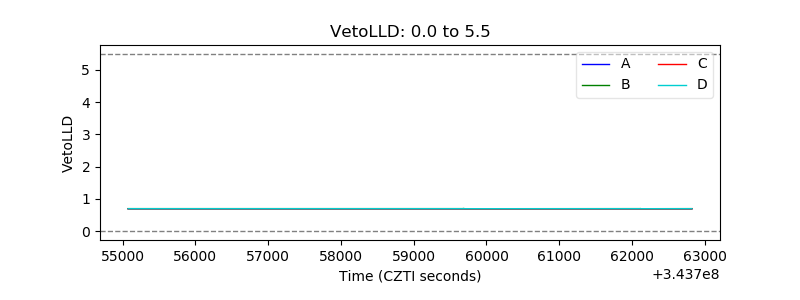 |
| Alpha Counter | 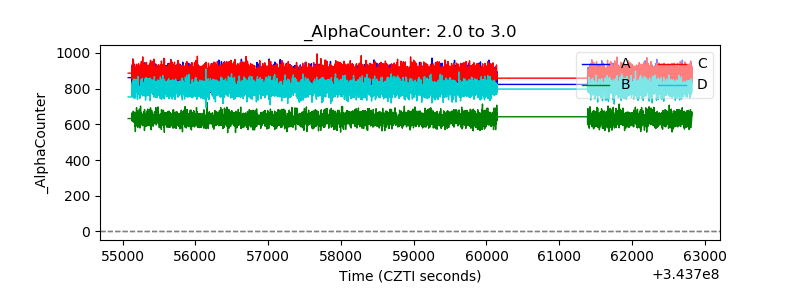 |
| _CPM_Rate | 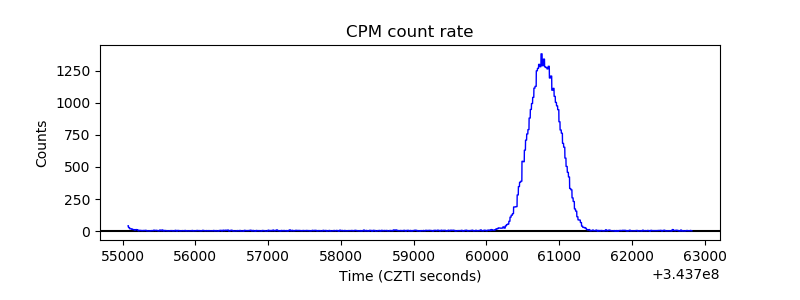 |
| CZT Counter | 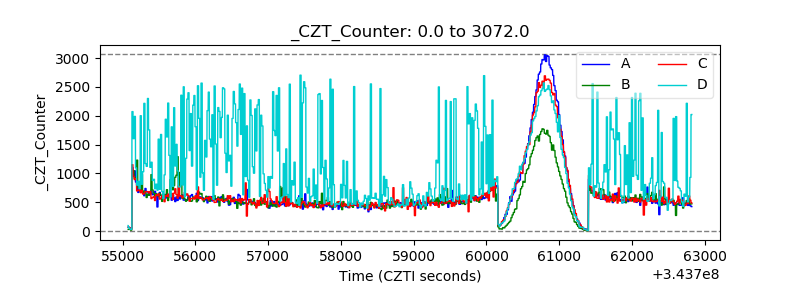 |
| +2.5 Volts monitor |  |
| +5 Volts monitor | 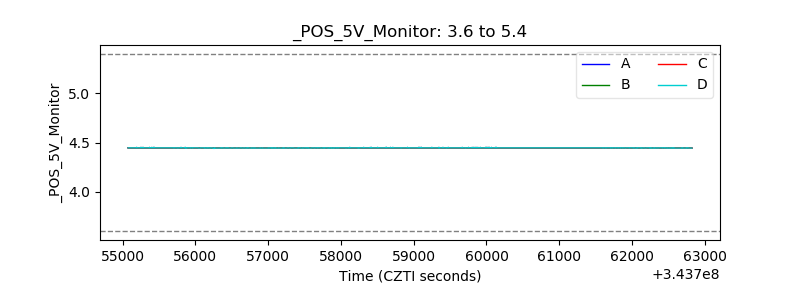 |
| _ROLL_ROT | 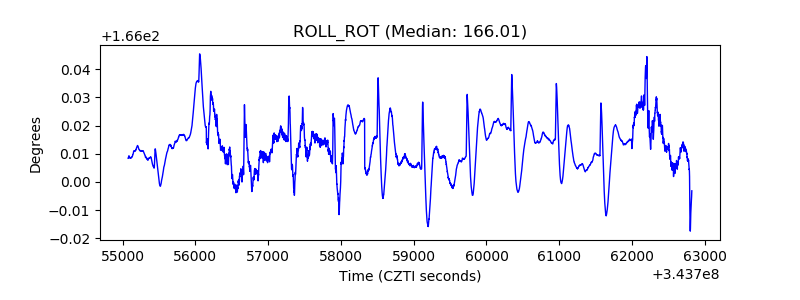 |
| _Roll_DEC | 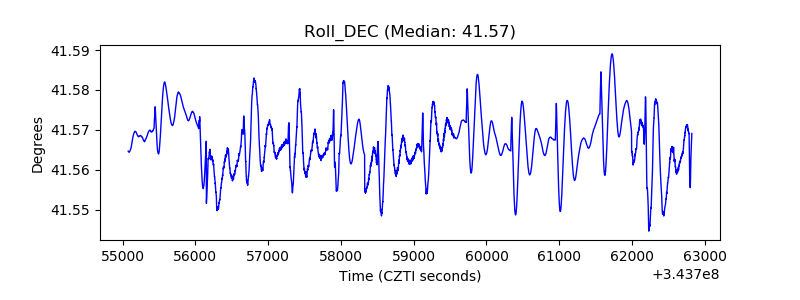 |
| _Roll_RA | 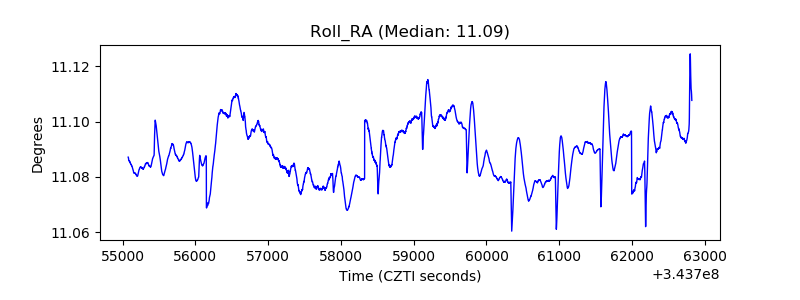 |
| Veto Counter | 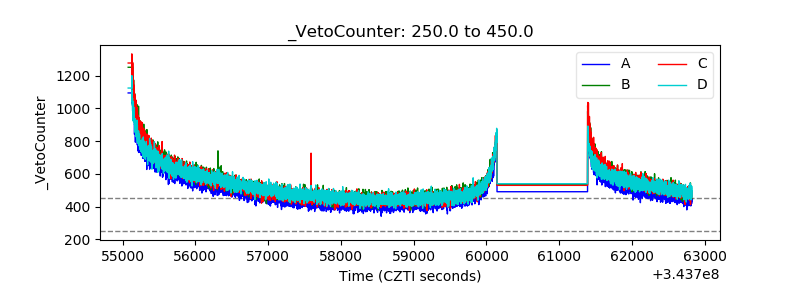 |