| Param | Original file | Final file |
|---|---|---|
| Filename | modeM0/AS1A10_002T05_9000004024_27867cztM0_level2.evt | modeM0/AS1A10_002T05_9000004024_27867cztM0_level2_quad_clean.evt |
| Size (bytes) | 552,098,880 | 101,681,280 |
| Size | 526.5 MB | 97.0 MB |
| Events in quadrant A | 3,437,310 | 677,849 |
| Events in quadrant B | 3,872,685 | 660,051 |
| Events in quadrant C | 3,462,700 | 642,570 |
| Events in quadrant D | 5,476,971 | 614,929 |
| Mode M0 | |||
|---|---|---|---|
| Quadrant | BADHDUFLAG | Total packets | Discarded packets |
| A | 0 | 14640 | 0 |
| B | 0 | 16100 | 0 |
| C | 0 | 14599 | 0 |
| D | 0 | 20979 | 0 |
| Mode M9 | |||
|---|---|---|---|
| Quadrant | BADHDUFLAG | Total packets | Discarded packets |
| A | 0 | 10 | 0 |
| B | 0 | 11 | 0 |
| C | 0 | 11 | 0 |
| D | 0 | 11 | 0 |
| Quadrant | Total seconds | Saturated seconds | Saturation percentage |
|---|---|---|---|
| A | 6947 | 78 | 1.122787% |
| B | 6947 | 102 | 1.468260% |
| C | 6947 | 118 | 1.698575% |
| D | 6947 | 451 | 6.492011% |
Noise dominated data is calculated using 1-second bins in cleaned event files. If a bin has >2000 counts, and if more than 50% of those come from <1% of pixels, then it is considered to be noise-dominated and hence unusable.
| Quadrant | # 1 sec bins | Bins with >0 counts | Bins with >2000 counts | High rate bins dominated by noise | Noise dominated (total time) | Noise dominated (detector-on time) | Marked lightcurve |
|---|---|---|---|---|---|---|---|
| A | 7622 | 6948 | 8 | 8 | 0.10% | 0.12% | 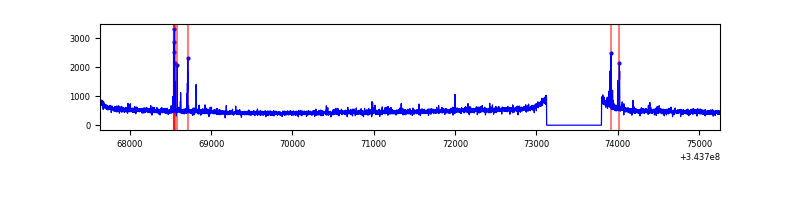 |
| B | 7622 | 6947 | 5 | 5 | 0.07% | 0.07% | 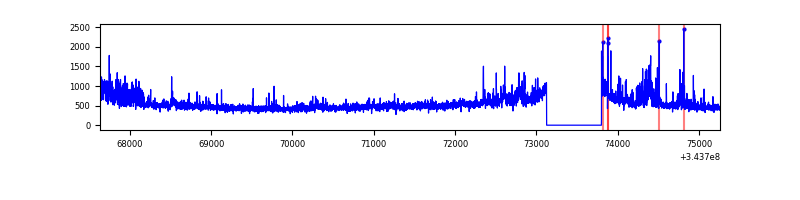 |
| C | 7622 | 6947 | 0 | 0 | 0.00% | 0.00% | 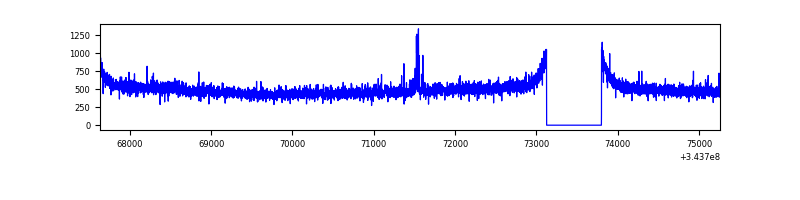 |
| D | 7622 | 6948 | 368 | 368 | 4.83% | 5.30% | 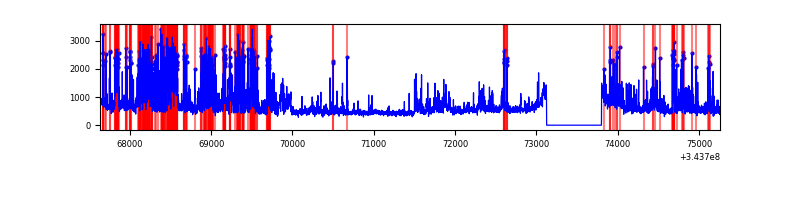 |
Top three noisy pixels from each quadrant. If the there are fewer than three noisy pixels in the level2.evt file, extra rows are filled as -1
| Pixel properties | Quadrant properties | ||||||
|---|---|---|---|---|---|---|---|
| Quadrant | DetID | PixID | Counts | Sigma | Mean | Median | Sigma |
| A | 13 | 248 | 46525 | 258.57 | 874 | 855 | 176.6 |
| A | 13 | 254 | 13002 | 68.77 | 874 | 855 | 176.6 |
| A | 3 | 137 | 8190 | 41.53 | 874 | 855 | 176.6 |
| B | 10 | 246 | 127773 | 775.67 | 856 | 834 | 163.7 |
| B | 0 | 230 | 121860 | 739.54 | 856 | 834 | 163.7 |
| B | 0 | 190 | 113903 | 690.91 | 856 | 834 | 163.7 |
| C | 14 | 238 | 132532 | 673.42 | 833 | 840 | 195.6 |
| C | 3 | 233 | 76223 | 385.48 | 833 | 840 | 195.6 |
| C | 13 | 61 | 5700 | 24.85 | 833 | 840 | 195.6 |
| D | 13 | 104 | 1040797 | 5280.72 | 831 | 812 | 196.9 |
| D | 1 | 52 | 688970 | 3494.25 | 831 | 812 | 196.9 |
| D | 2 | 250 | 504508 | 2557.61 | 831 | 812 | 196.9 |
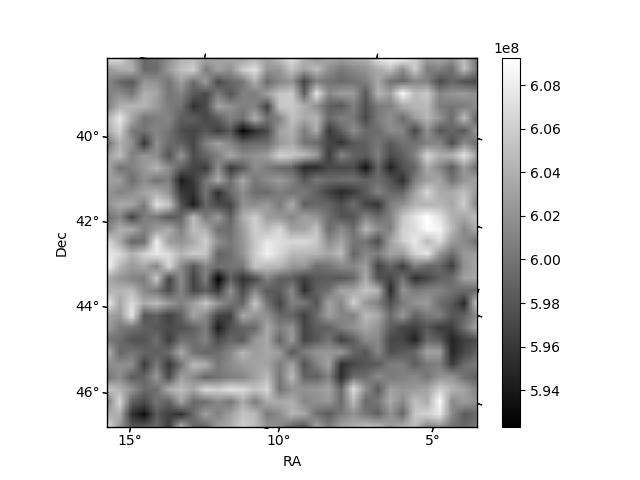
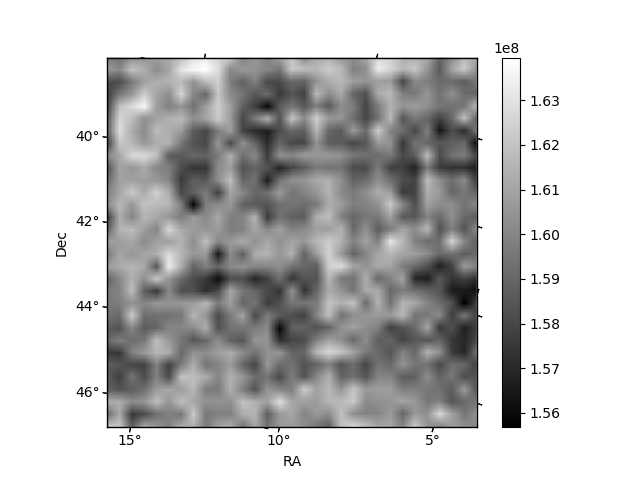
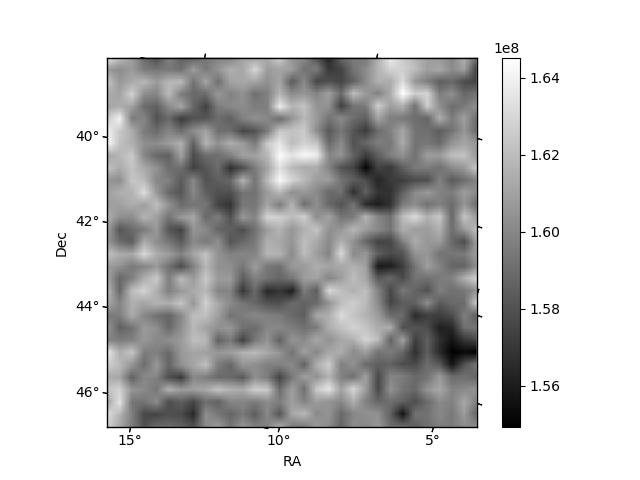
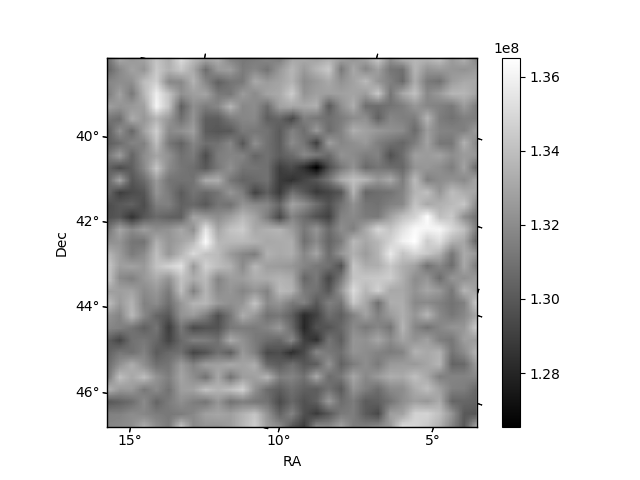
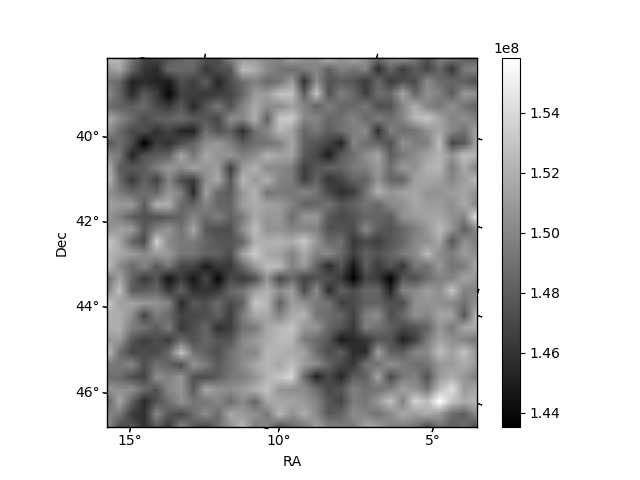
Histogram calculated using DETX and DETY for each event in the final _common_clean file
| Quadrant A | 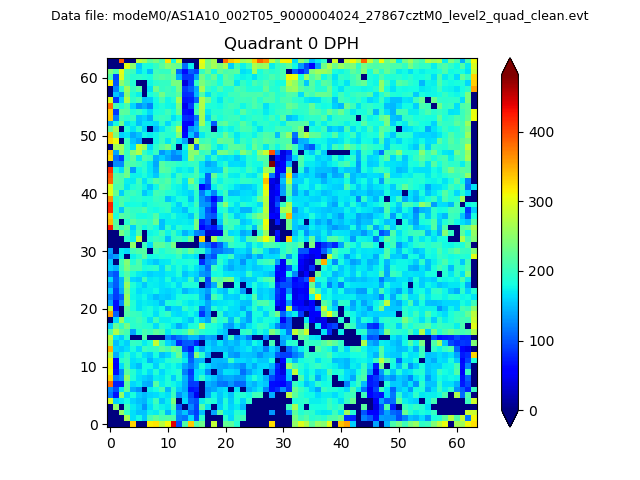 |
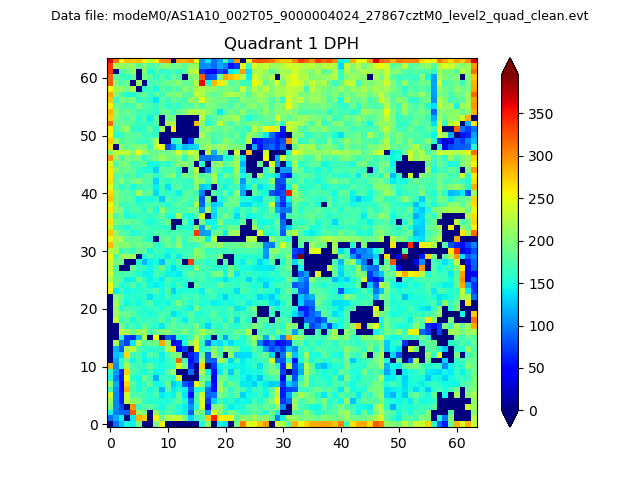 |
Quadrant B |
|---|---|---|---|
| Quadrant D |  |
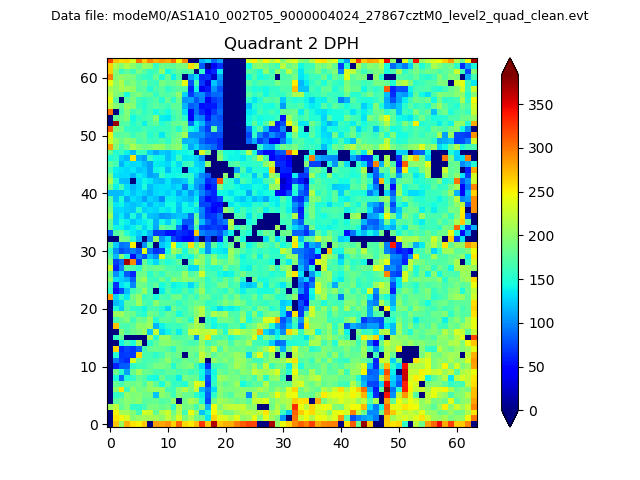 |
Quadrant C |
| Plot type | Count rate plots | Images |
|---|---|---|
| Comparison with Poisson distribution Blue bars denote a histogram of data divided into 1 sec bins. Red curve is a Poisson curve with rate = median count rate of data. |
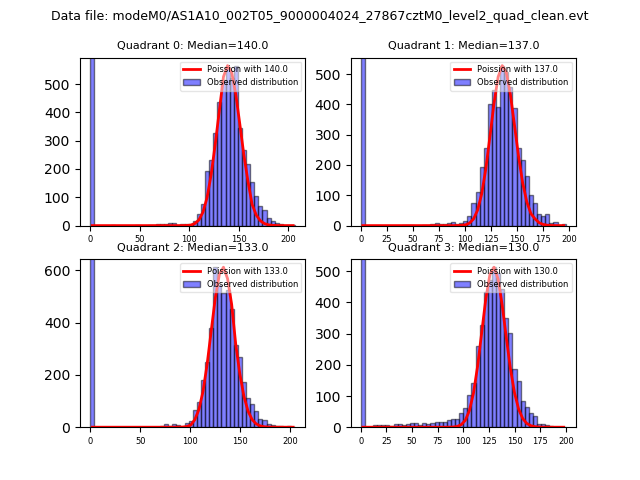 |
 |
| Quadrant-wise count rates Data is divided into 100 sec bins |
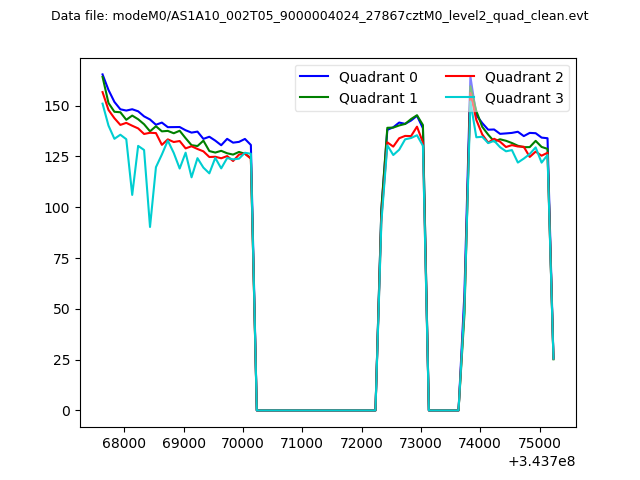 |
|
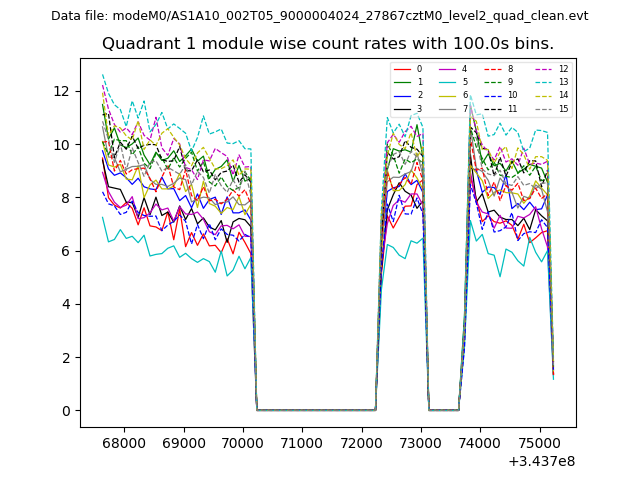
| Module-wise count rates for Quadrant A Data is divided into 100 sec bins |
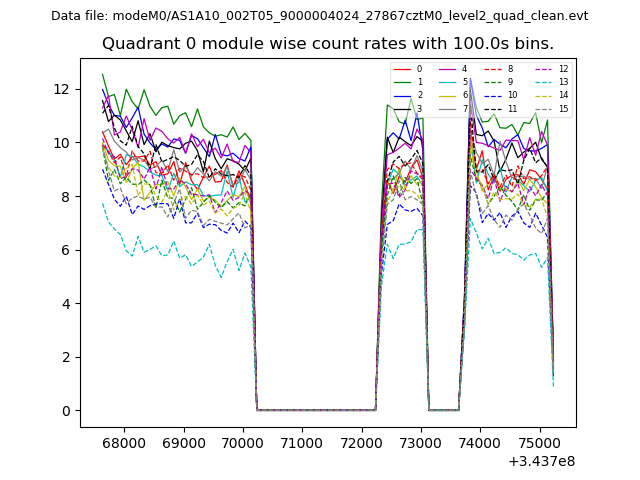 |
 |
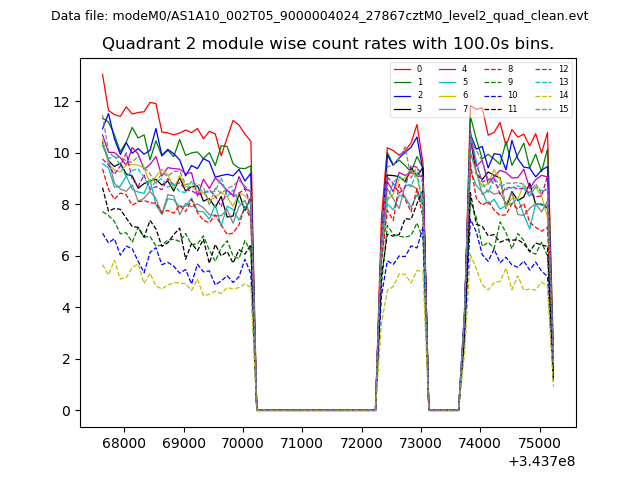
| Module-wise count rates for Quadrant B Data is divided into 100 sec bins |
 |
 |
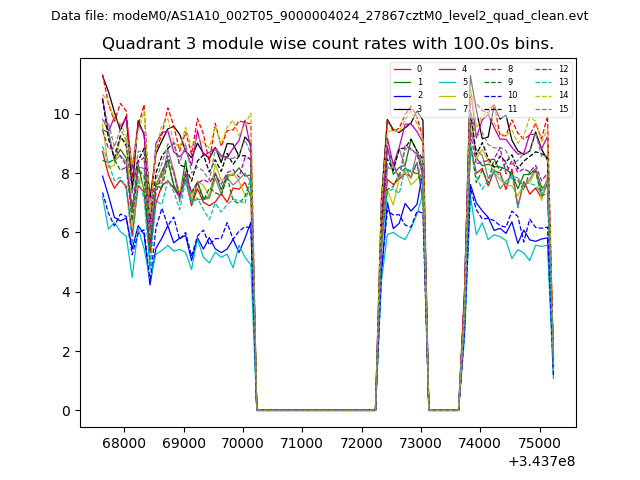
| Module-wise count rates for Quadrant C Data is divided into 100 sec bins |
 |
 |
| Module-wise count rates for Quadrant D Data is divided into 100 sec bins |
 |
 |
| Parameter | Plot |
|---|---|
| CZT HV Monitor | 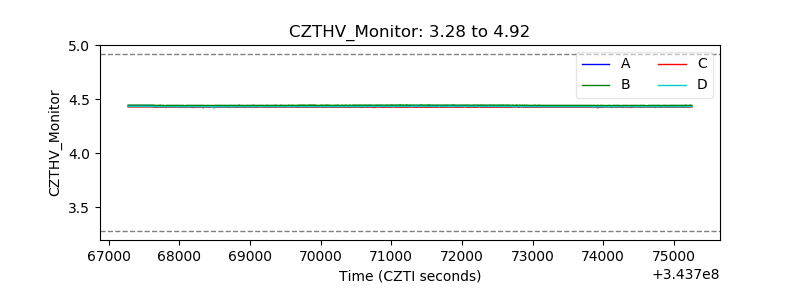 |
| D_VDD | 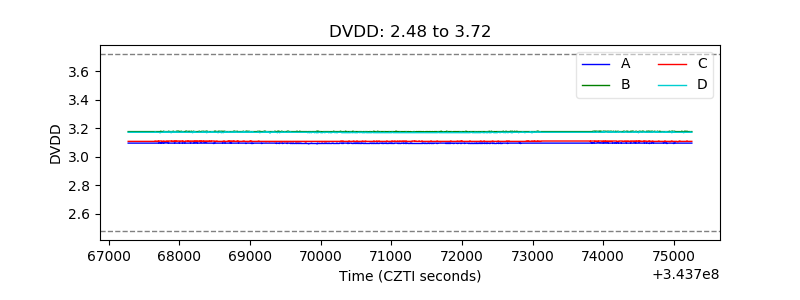 |
| Temperature 1 | 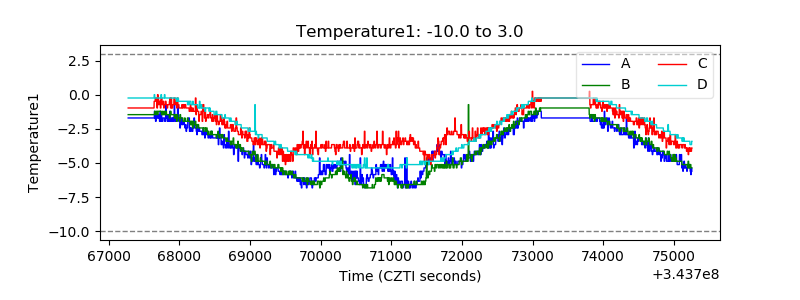 |
| Veto HV Monitor | 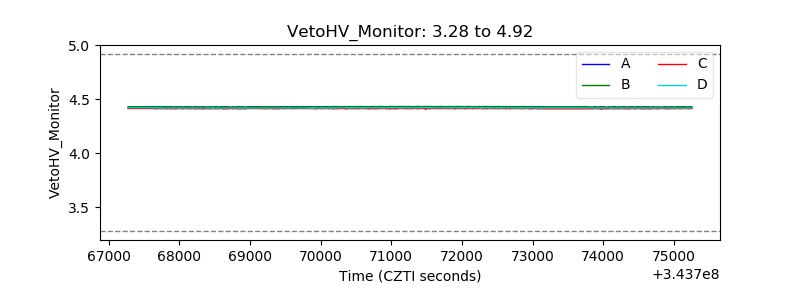 |
| Veto LLD | 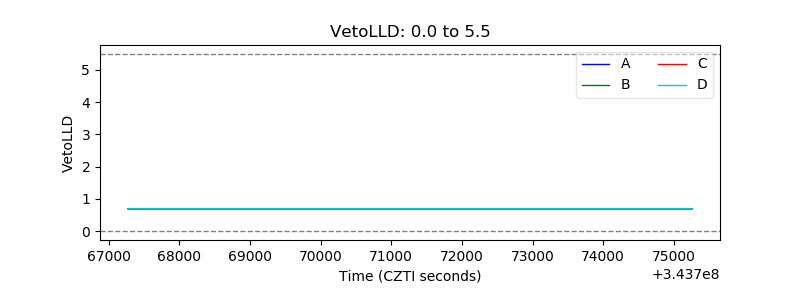 |
| Alpha Counter | 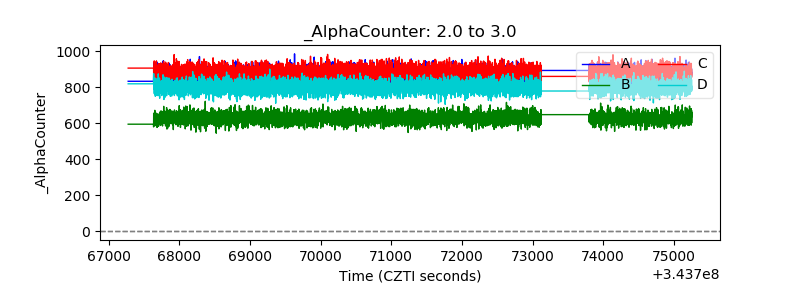 |
| _CPM_Rate | 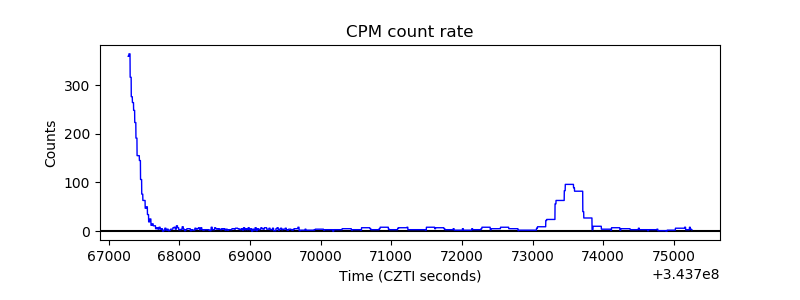 |
| CZT Counter | 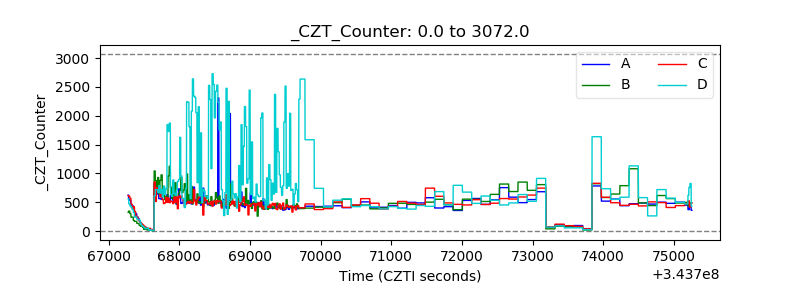 |
| +2.5 Volts monitor | 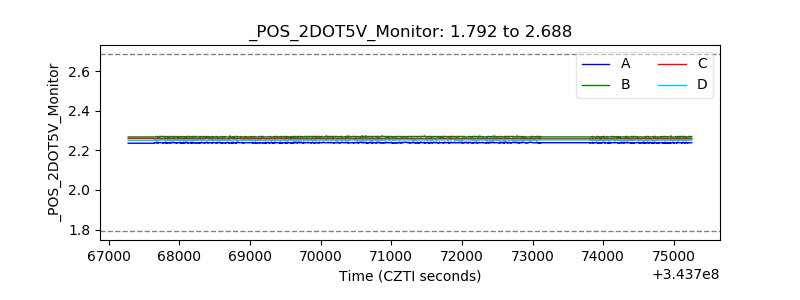 |
| +5 Volts monitor |  |
| _ROLL_ROT | 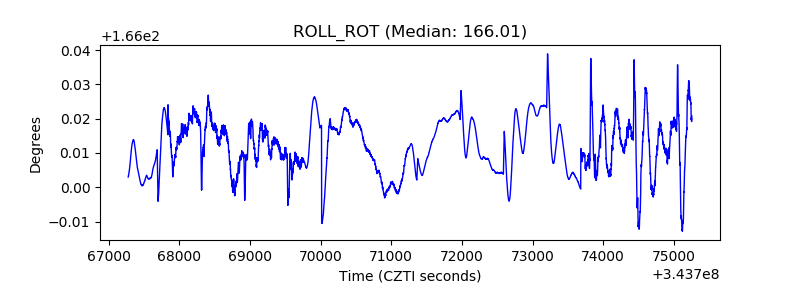 |
| _Roll_DEC |  |
| _Roll_RA | 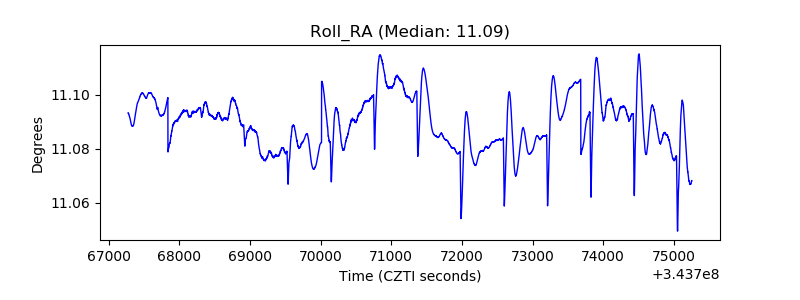 |
| Veto Counter |  |