| Param | Original file | Final file |
|---|---|---|
| Filename | modeM0/AS1A10_002T05_9000004024_27868cztM0_level2.evt | modeM0/AS1A10_002T05_9000004024_27868cztM0_level2_quad_clean.evt |
| Size (bytes) | 563,250,240 | 108,247,680 |
| Size | 537.2 MB | 103.2 MB |
| Events in quadrant A | 3,560,388 | 720,861 |
| Events in quadrant B | 4,091,698 | 699,098 |
| Events in quadrant C | 3,796,496 | 680,493 |
| Events in quadrant D | 5,108,025 | 663,334 |
| Mode M0 | |||
|---|---|---|---|
| Quadrant | BADHDUFLAG | Total packets | Discarded packets |
| A | 0 | 15426 | 0 |
| B | 0 | 17039 | 0 |
| C | 0 | 16124 | 0 |
| D | 0 | 20382 | 0 |
| Mode M9 | |||
|---|---|---|---|
| Quadrant | BADHDUFLAG | Total packets | Discarded packets |
| A | 0 | 8 | 0 |
| B | 0 | 9 | 0 |
| C | 0 | 9 | 0 |
| D | 0 | 9 | 0 |
| Quadrant | Total seconds | Saturated seconds | Saturation percentage |
|---|---|---|---|
| A | 7398 | 54 | 0.729927% |
| B | 7398 | 111 | 1.500406% |
| C | 7398 | 111 | 1.500406% |
| D | 7397 | 341 | 4.609977% |
Noise dominated data is calculated using 1-second bins in cleaned event files. If a bin has >2000 counts, and if more than 50% of those come from <1% of pixels, then it is considered to be noise-dominated and hence unusable.
| Quadrant | # 1 sec bins | Bins with >0 counts | Bins with >2000 counts | High rate bins dominated by noise | Noise dominated (total time) | Noise dominated (detector-on time) | Marked lightcurve |
|---|---|---|---|---|---|---|---|
| A | 7748 | 7399 | 3 | 3 | 0.04% | 0.04% |  |
| B | 7748 | 7398 | 13 | 13 | 0.17% | 0.18% |  |
| C | 7748 | 7399 | 4 | 4 | 0.05% | 0.05% |  |
| D | 7747 | 7398 | 223 | 223 | 2.88% | 3.01% |  |
Top three noisy pixels from each quadrant. If the there are fewer than three noisy pixels in the level2.evt file, extra rows are filled as -1
| Pixel properties | Quadrant properties | ||||||
|---|---|---|---|---|---|---|---|
| Quadrant | DetID | PixID | Counts | Sigma | Mean | Median | Sigma |
| A | 13 | 248 | 15189 | 76.99 | 914 | 894 | 185.7 |
| A | 13 | 254 | 13793 | 69.47 | 914 | 894 | 185.7 |
| A | 3 | 137 | 8664 | 41.85 | 914 | 894 | 185.7 |
| B | 10 | 245 | 154727 | 901.06 | 896 | 873 | 170.7 |
| B | 0 | 190 | 113634 | 660.39 | 896 | 873 | 170.7 |
| B | 4 | 52 | 91559 | 531.11 | 896 | 873 | 170.7 |
| C | 3 | 233 | 242440 | 1189.68 | 873 | 879 | 203.0 |
| C | 14 | 238 | 138144 | 676.03 | 873 | 879 | 203.0 |
| C | 13 | 61 | 5985 | 25.15 | 873 | 879 | 203.0 |
| D | 1 | 52 | 1278163 | 6108.75 | 874 | 853 | 209.1 |
| D | 2 | 250 | 351229 | 1675.68 | 874 | 853 | 209.1 |
| D | 11 | 176 | 48962 | 230.08 | 874 | 853 | 209.1 |
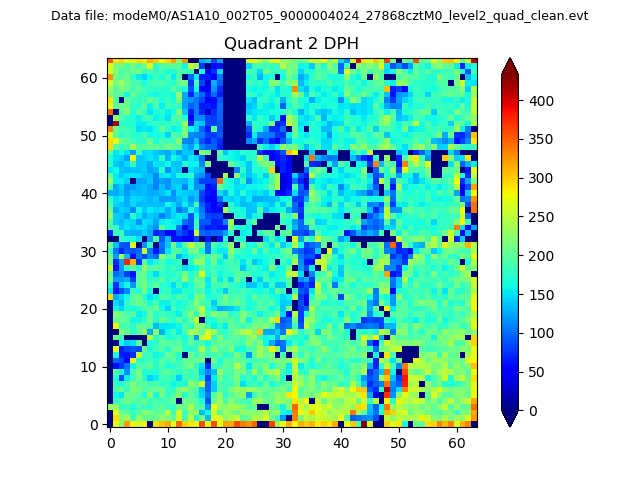
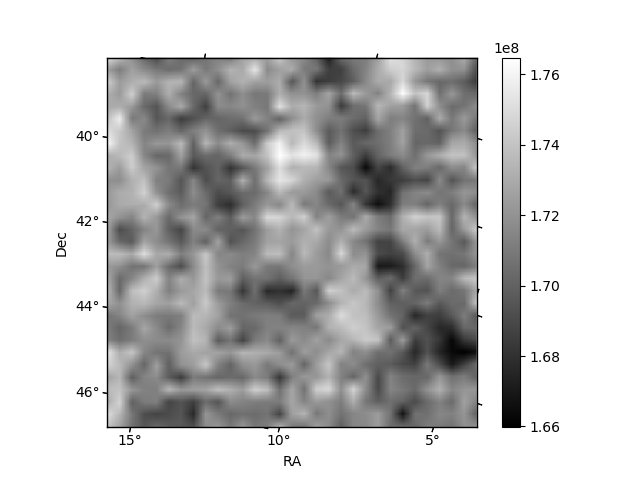
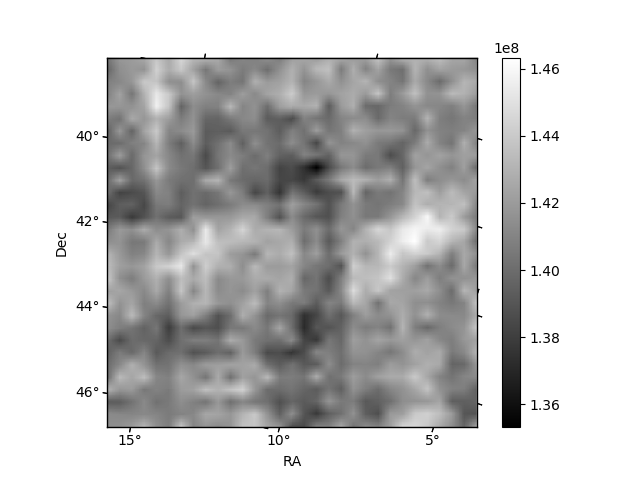
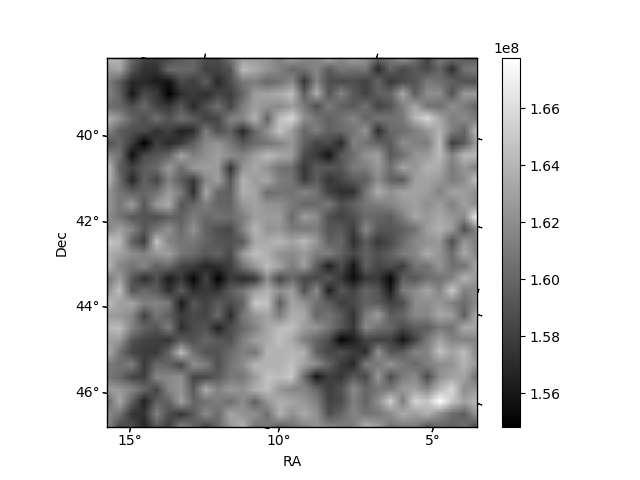
Histogram calculated using DETX and DETY for each event in the final _common_clean file
| Quadrant A | 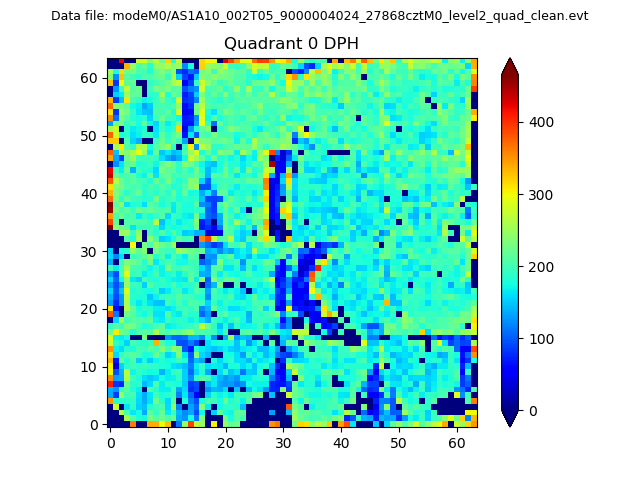 |
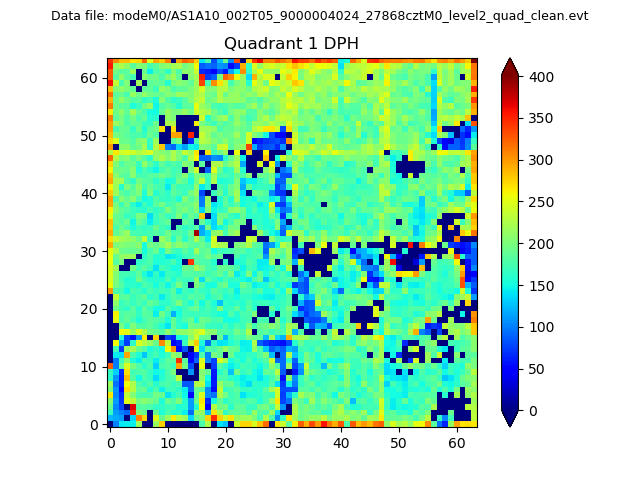 |
Quadrant B |
|---|---|---|---|
| Quadrant D | 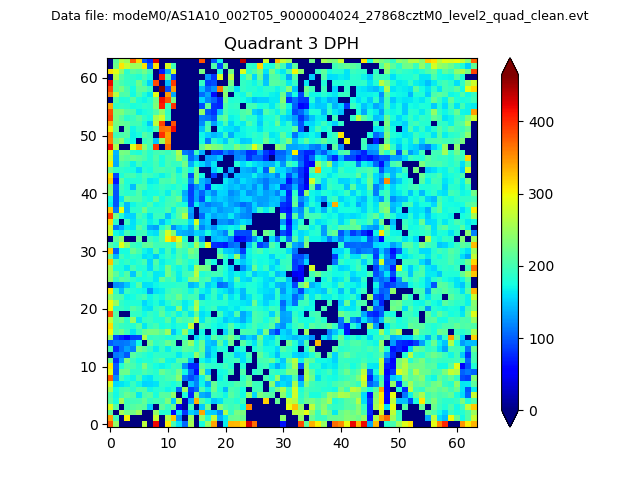 |
 |
Quadrant C |
| Plot type | Count rate plots | Images |
|---|---|---|
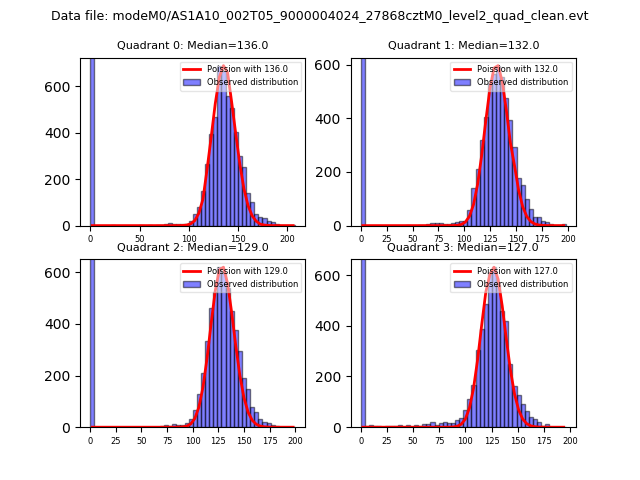
| Comparison with Poisson distribution Blue bars denote a histogram of data divided into 1 sec bins. Red curve is a Poisson curve with rate = median count rate of data. |
 |
 |
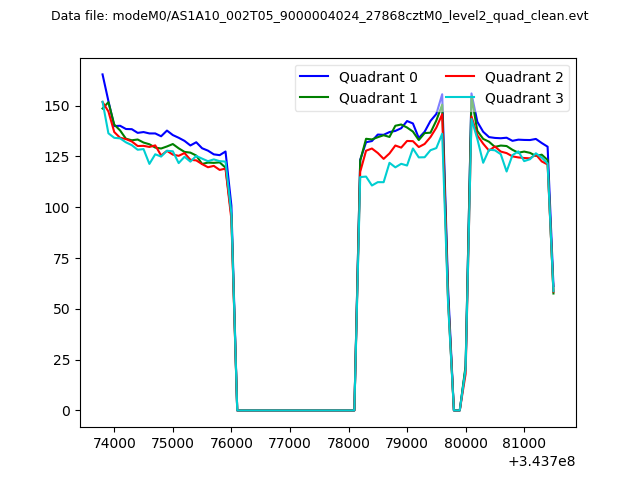
| Quadrant-wise count rates Data is divided into 100 sec bins |
 |
|
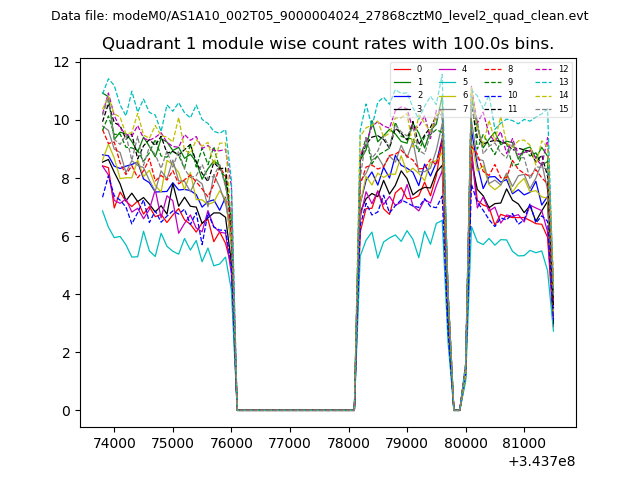
| Module-wise count rates for Quadrant A Data is divided into 100 sec bins |
 |
 |
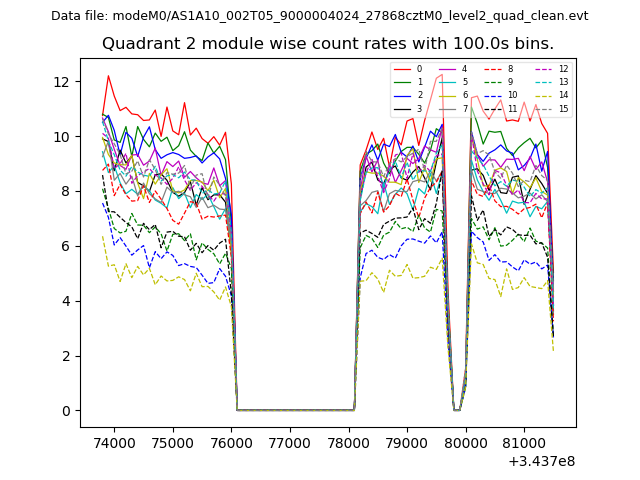
| Module-wise count rates for Quadrant B Data is divided into 100 sec bins |
 |
 |
| Module-wise count rates for Quadrant C Data is divided into 100 sec bins |
 |
 |
| Module-wise count rates for Quadrant D Data is divided into 100 sec bins |
 |
 |
| Parameter | Plot |
|---|---|
| CZT HV Monitor |  |
| D_VDD | 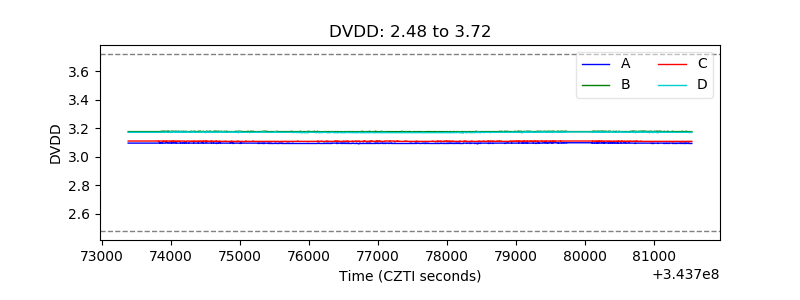 |
| Temperature 1 | 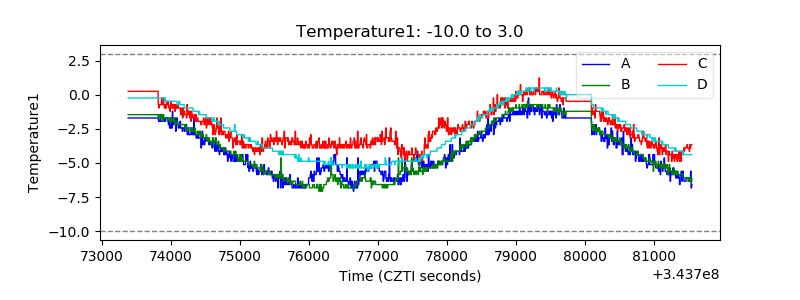 |
| Veto HV Monitor | 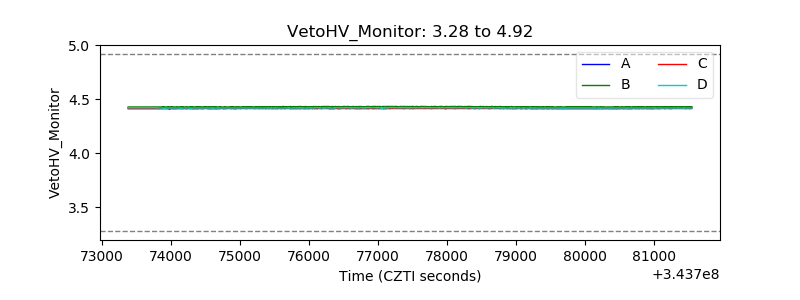 |
| Veto LLD |  |
| Alpha Counter | 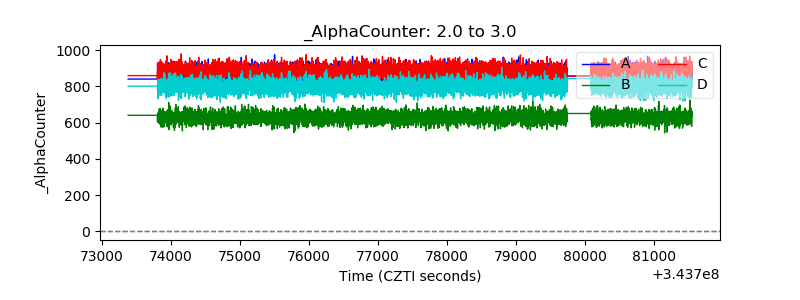 |
| _CPM_Rate | 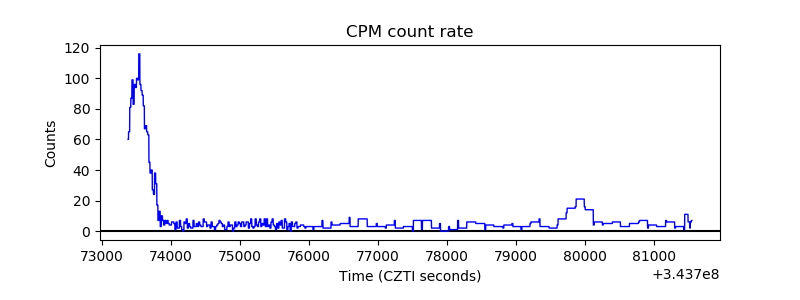 |
| CZT Counter | 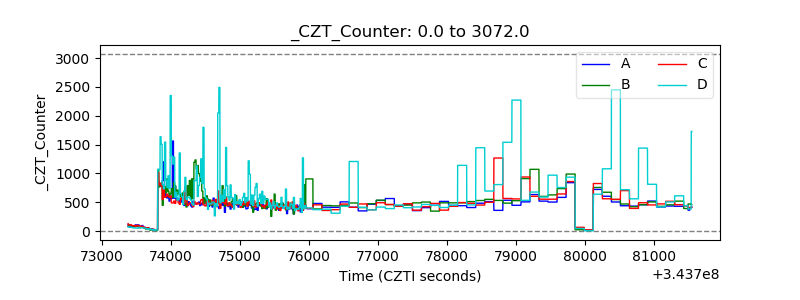 |
| +2.5 Volts monitor |  |
| +5 Volts monitor |  |
| _ROLL_ROT |  |
| _Roll_DEC | 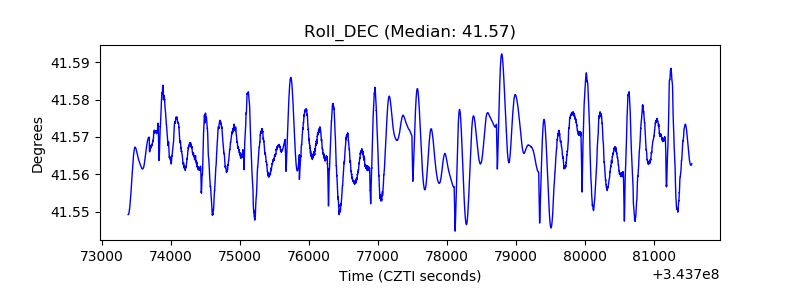 |
| _Roll_RA | 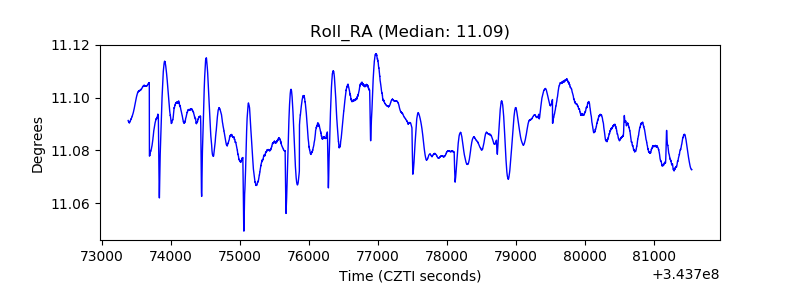 |
| Veto Counter |  |