| Param | Original file | Final file |
|---|---|---|
| Filename | modeM0/AS1A10_002T05_9000004024_27869cztM0_level2.evt | modeM0/AS1A10_002T05_9000004024_27869cztM0_level2_quad_clean.evt |
| Size (bytes) | 651,216,960 | 119,931,840 |
| Size | 621.0 MB | 114.4 MB |
| Events in quadrant A | 3,937,025 | 800,591 |
| Events in quadrant B | 4,609,701 | 777,360 |
| Events in quadrant C | 4,386,062 | 757,953 |
| Events in quadrant D | 6,234,083 | 726,329 |
| Mode M0 | |||
|---|---|---|---|
| Quadrant | BADHDUFLAG | Total packets | Discarded packets |
| A | 0 | 17126 | 0 |
| B | 0 | 19189 | 0 |
| C | 0 | 18380 | 0 |
| D | 0 | 24214 | 0 |
| Mode M9 | |||
|---|---|---|---|
| Quadrant | BADHDUFLAG | Total packets | Discarded packets |
| A | 0 | 6 | 0 |
| B | 0 | 6 | 0 |
| C | 0 | 6 | 0 |
| D | 0 | 6 | 0 |
| Quadrant | Total seconds | Saturated seconds | Saturation percentage |
|---|---|---|---|
| A | 8204 | 83 | 1.011702% |
| B | 8205 | 190 | 2.315661% |
| C | 8205 | 171 | 2.084095% |
| D | 8205 | 606 | 7.385740% |
Noise dominated data is calculated using 1-second bins in cleaned event files. If a bin has >2000 counts, and if more than 50% of those come from <1% of pixels, then it is considered to be noise-dominated and hence unusable.
| Quadrant | # 1 sec bins | Bins with >0 counts | Bins with >2000 counts | High rate bins dominated by noise | Noise dominated (total time) | Noise dominated (detector-on time) | Marked lightcurve |
|---|---|---|---|---|---|---|---|
| A | 8719 | 8206 | 0 | 0 | 0.00% | 0.00% | 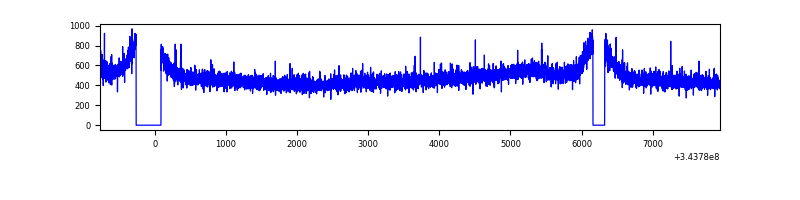 |
| B | 8720 | 8205 | 18 | 18 | 0.21% | 0.22% | 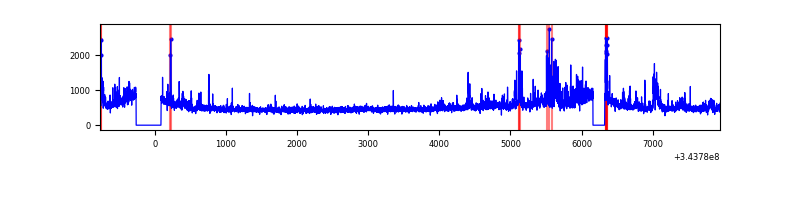 |
| C | 8720 | 8206 | 0 | 0 | 0.00% | 0.00% | 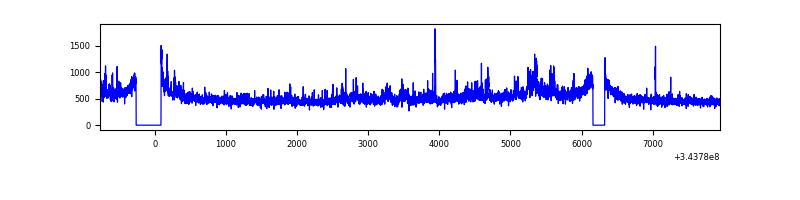 |
| D | 8720 | 8206 | 340 | 340 | 3.90% | 4.14% | 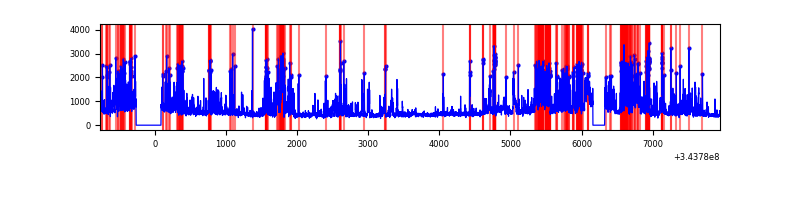 |
Top three noisy pixels from each quadrant. If the there are fewer than three noisy pixels in the level2.evt file, extra rows are filled as -1
| Pixel properties | Quadrant properties | ||||||
|---|---|---|---|---|---|---|---|
| Quadrant | DetID | PixID | Counts | Sigma | Mean | Median | Sigma |
| A | 13 | 254 | 14828 | 66.8 | 1019 | 997 | 207.1 |
| A | 3 | 137 | 9619 | 41.64 | 1019 | 997 | 207.1 |
| A | 0 | 226 | 8729 | 37.34 | 1019 | 997 | 207.1 |
| B | 10 | 245 | 298032 | 1546.15 | 999 | 971 | 192.1 |
| B | 0 | 190 | 111193 | 573.68 | 999 | 971 | 192.1 |
| B | 10 | 246 | 100831 | 519.75 | 999 | 971 | 192.1 |
| C | 3 | 233 | 426613 | 1861.97 | 973 | 977 | 228.6 |
| C | 14 | 238 | 152426 | 662.52 | 973 | 977 | 228.6 |
| C | 15 | 208 | 9725 | 38.27 | 973 | 977 | 228.6 |
| D | 1 | 52 | 1970041 | 8481.48 | 966 | 942 | 232.2 |
| D | 2 | 250 | 437757 | 1881.49 | 966 | 942 | 232.2 |
| D | 2 | 234 | 40946 | 172.31 | 966 | 942 | 232.2 |
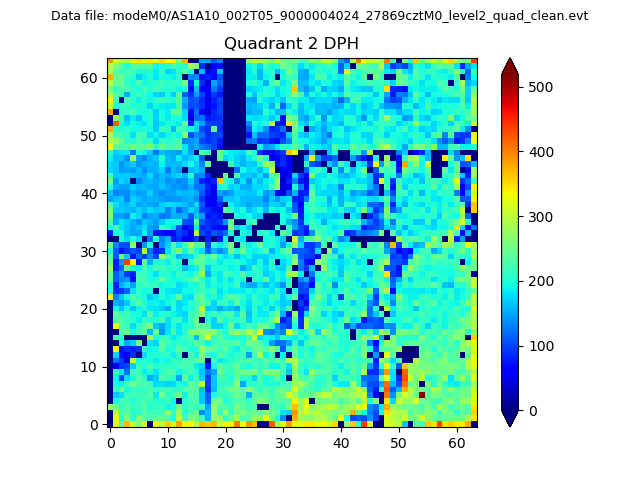
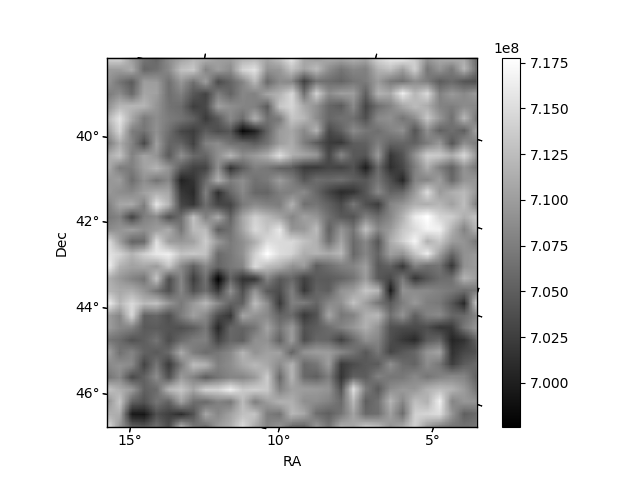
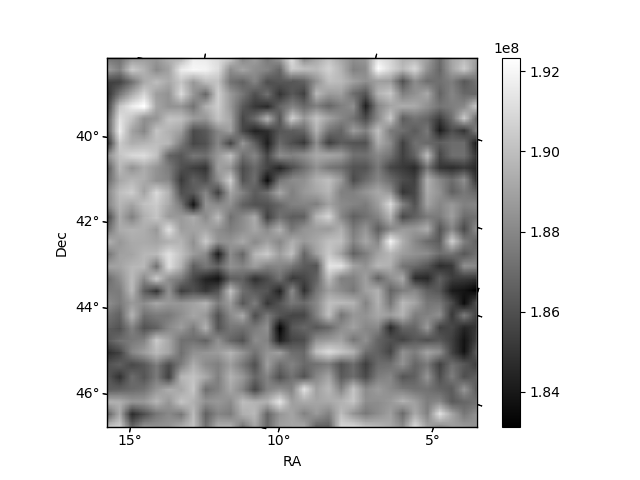
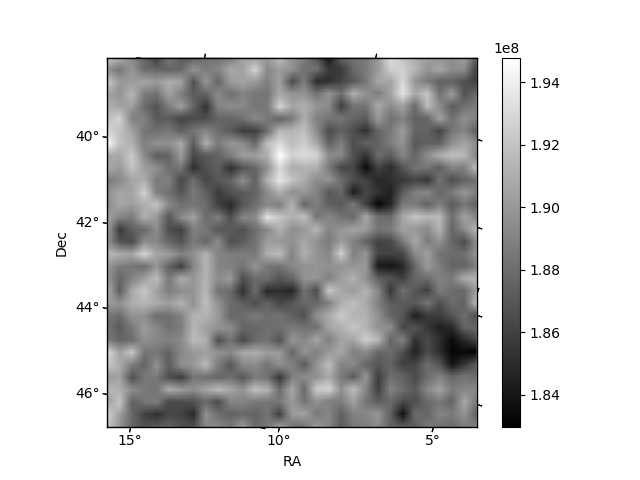
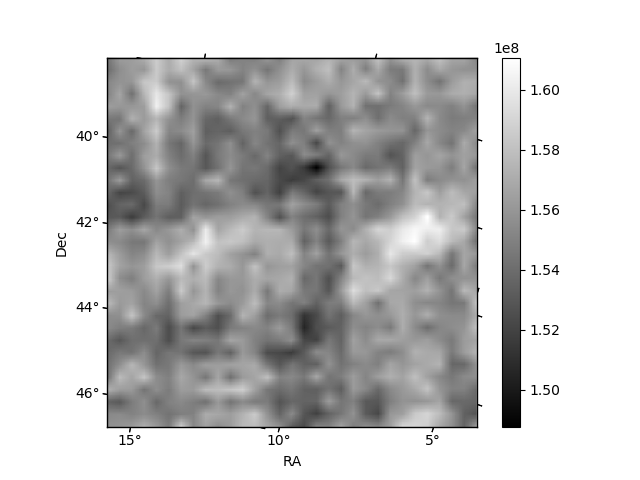
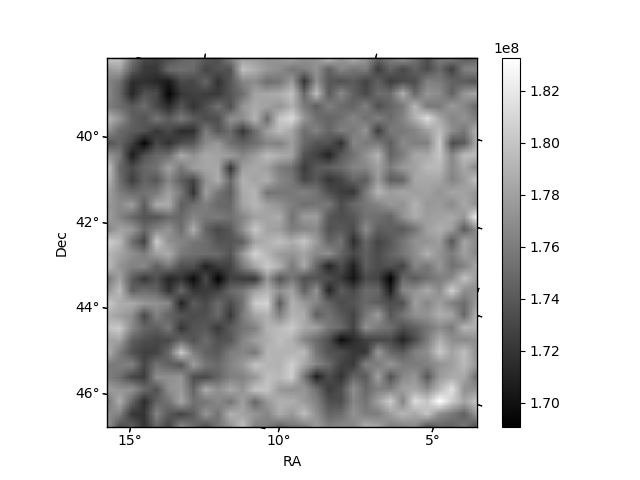
Histogram calculated using DETX and DETY for each event in the final _common_clean file
| Quadrant A | 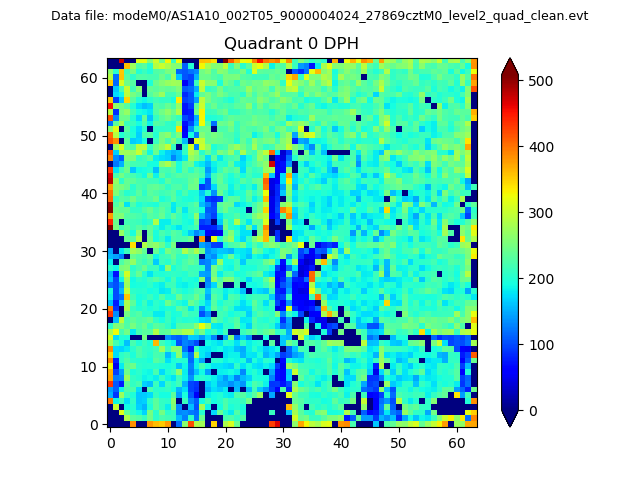 |
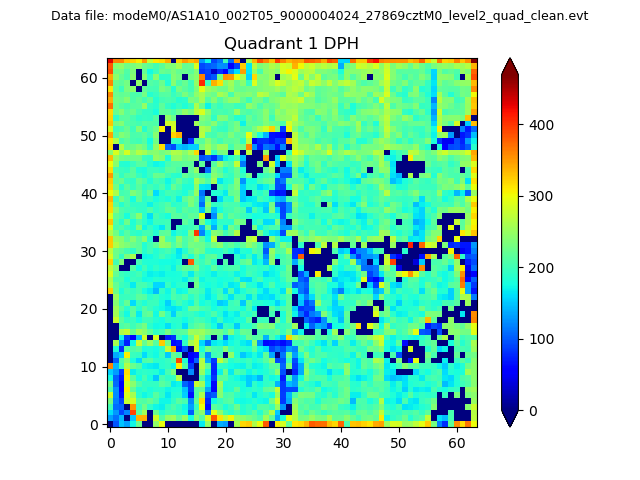 |
Quadrant B |
|---|---|---|---|
| Quadrant D | 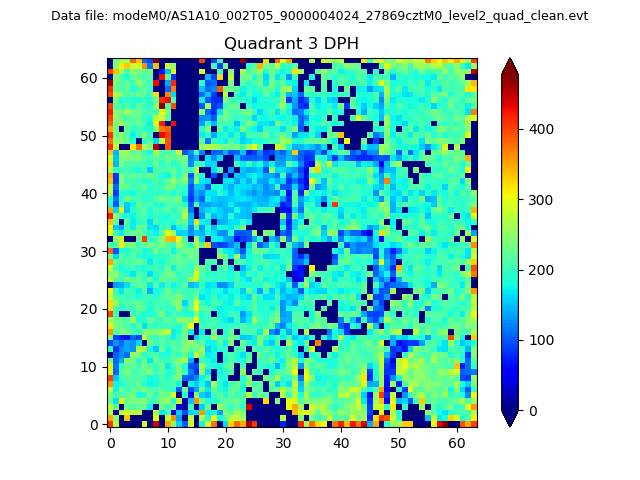 |
 |
Quadrant C |
| Plot type | Count rate plots | Images |
|---|---|---|
| Comparison with Poisson distribution Blue bars denote a histogram of data divided into 1 sec bins. Red curve is a Poisson curve with rate = median count rate of data. |
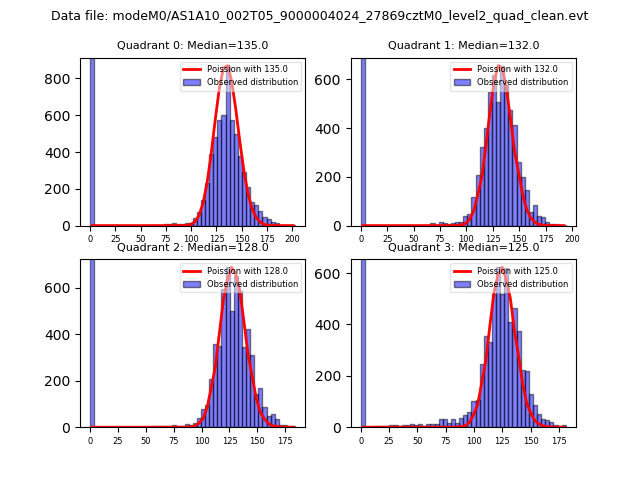 |
 |
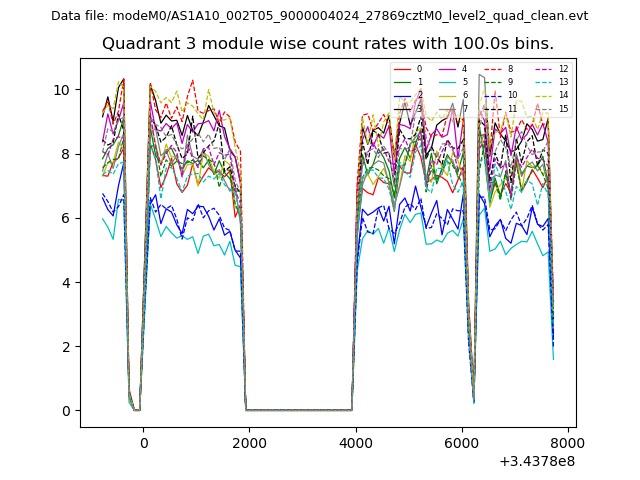
| Quadrant-wise count rates Data is divided into 100 sec bins |
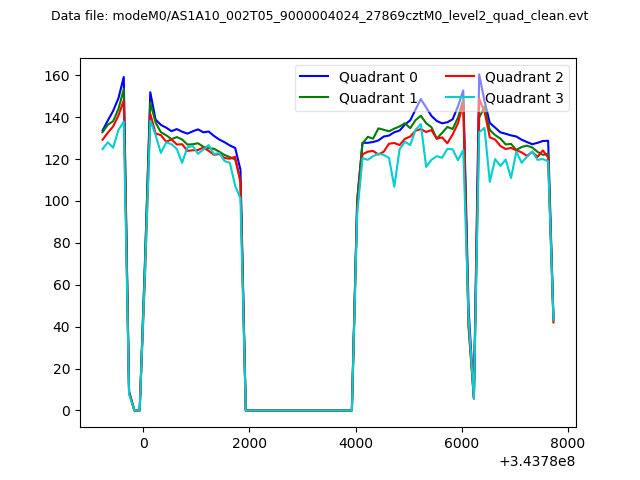 |
|
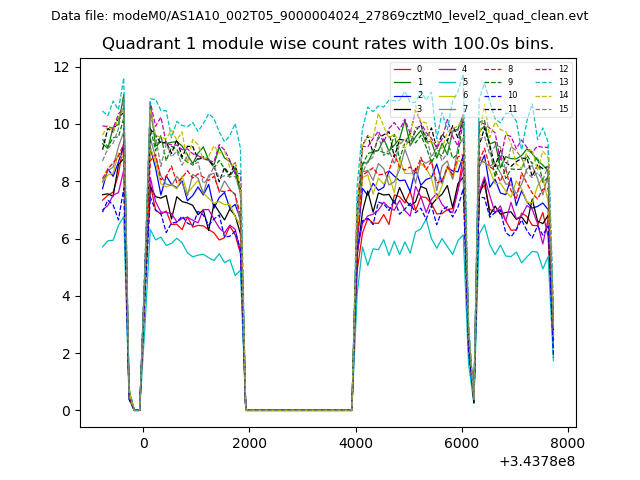
| Module-wise count rates for Quadrant A Data is divided into 100 sec bins |
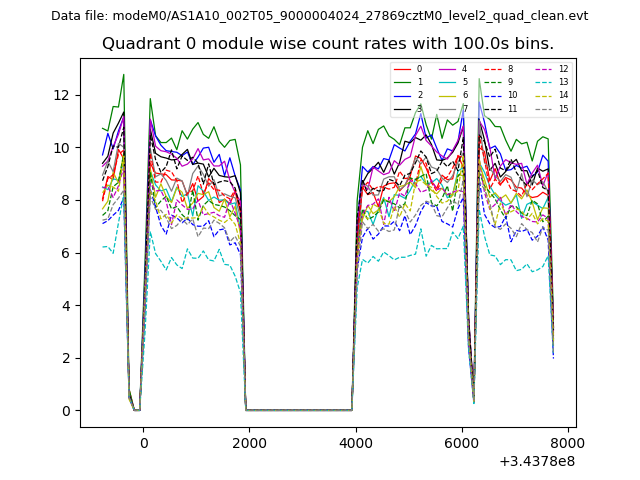 |
 |
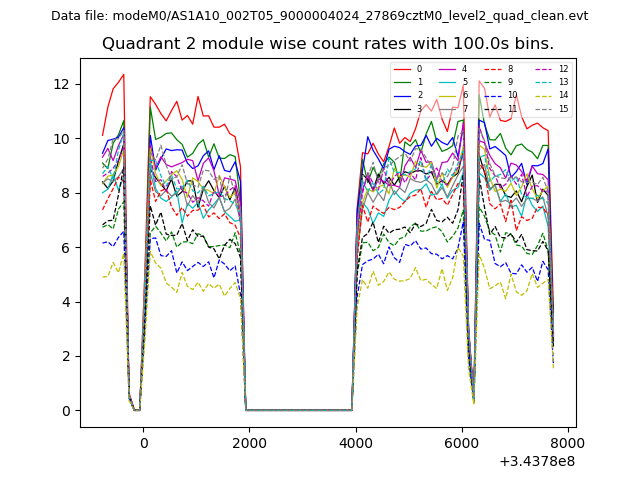
| Module-wise count rates for Quadrant B Data is divided into 100 sec bins |
 |
 |
| Module-wise count rates for Quadrant C Data is divided into 100 sec bins |
 |
 |
| Module-wise count rates for Quadrant D Data is divided into 100 sec bins |
 |
 |
| Parameter | Plot |
|---|---|
| CZT HV Monitor |  |
| D_VDD | 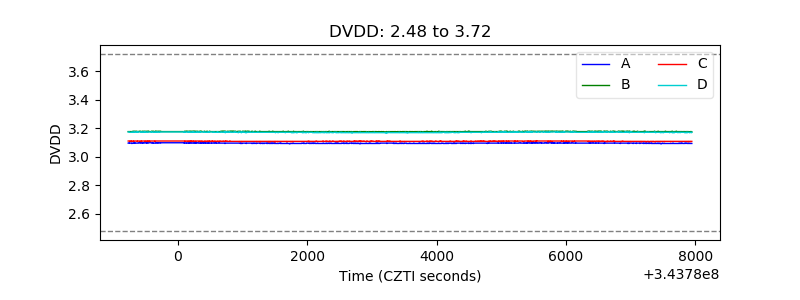 |
| Temperature 1 | 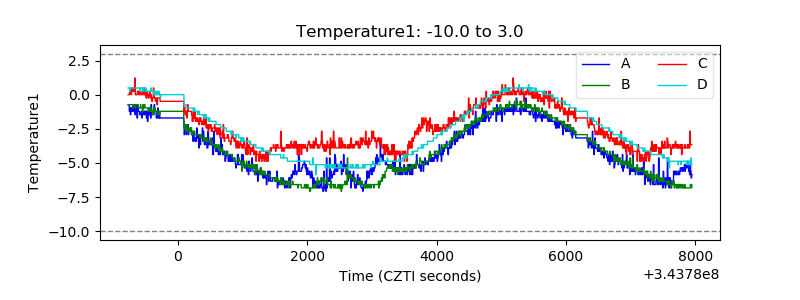 |
| Veto HV Monitor | 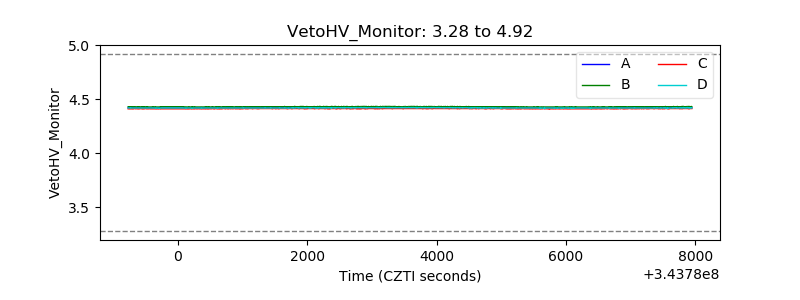 |
| Veto LLD |  |
| Alpha Counter | 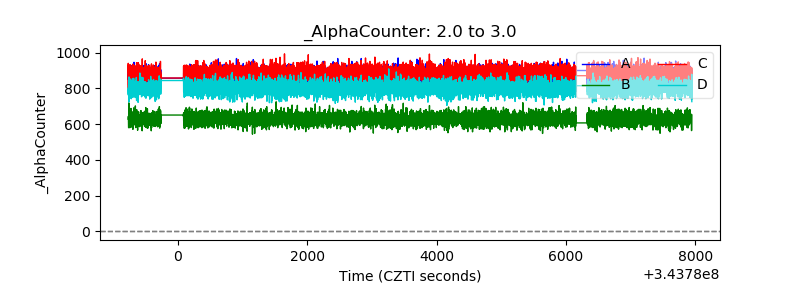 |
| _CPM_Rate | 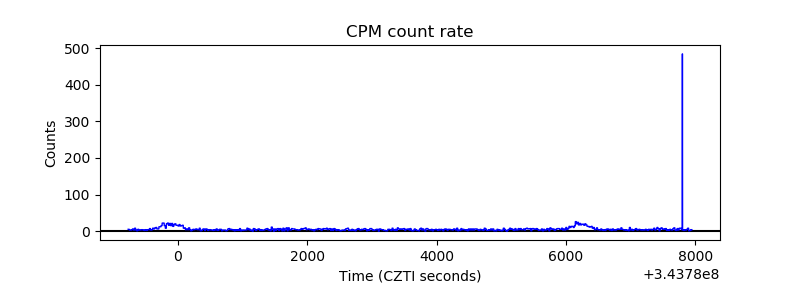 |
| CZT Counter | 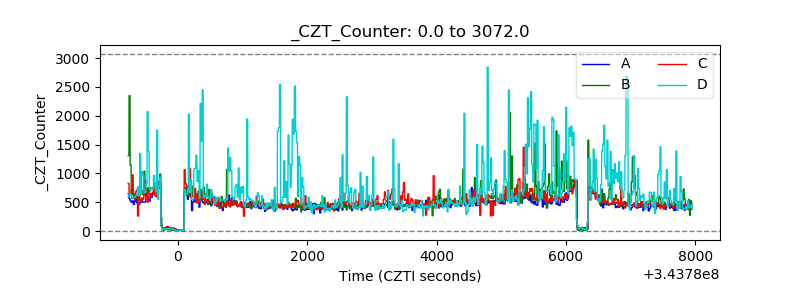 |
| +2.5 Volts monitor |  |
| +5 Volts monitor |  |
| _ROLL_ROT | 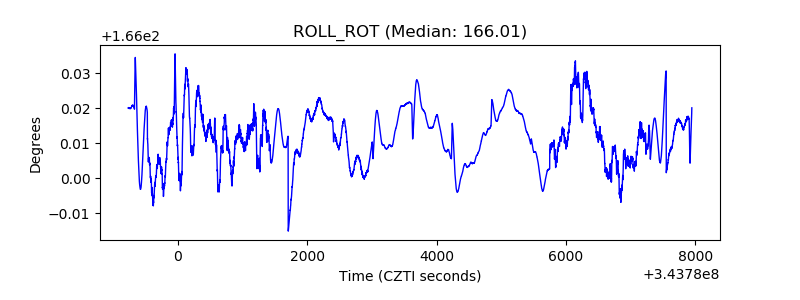 |
| _Roll_DEC | 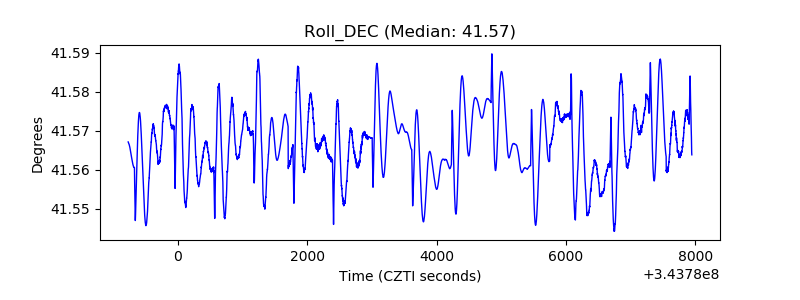 |
| _Roll_RA | 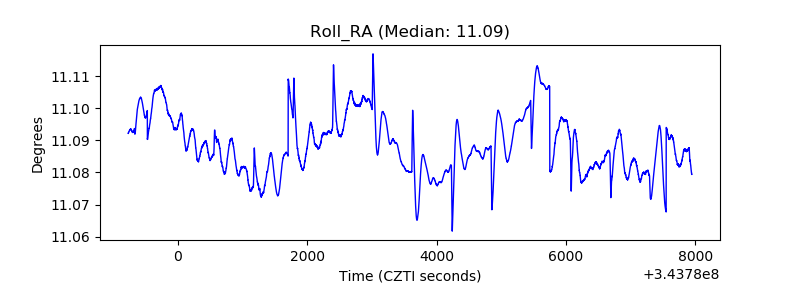 |
| Veto Counter | 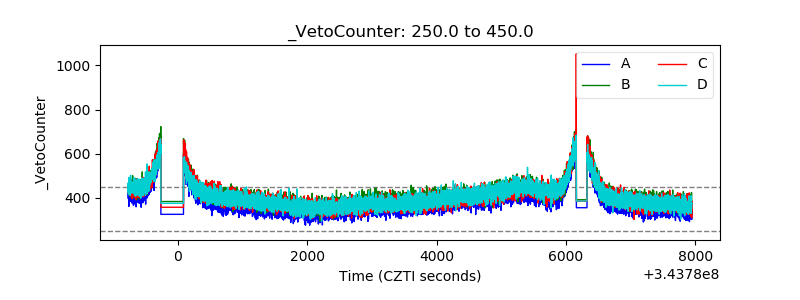 |