| Param | Original file | Final file |
|---|---|---|
| Filename | modeM0/AS1A10_002T05_9000004024_27870cztM0_level2.evt | modeM0/AS1A10_002T05_9000004024_27870cztM0_level2_quad_clean.evt |
| Size (bytes) | 647,746,560 | 116,043,840 |
| Size | 617.7 MB | 110.7 MB |
| Events in quadrant A | 4,002,621 | 766,344 |
| Events in quadrant B | 5,308,973 | 736,784 |
| Events in quadrant C | 4,215,622 | 727,121 |
| Events in quadrant D | 5,524,328 | 704,050 |
| Mode M0 | |||
|---|---|---|---|
| Quadrant | BADHDUFLAG | Total packets | Discarded packets |
| A | 0 | 17330 | 0 |
| B | 0 | 21325 | 0 |
| C | 0 | 17949 | 0 |
| D | 0 | 22153 | 0 |
| Mode M9 | |||
|---|---|---|---|
| Quadrant | BADHDUFLAG | Total packets | Discarded packets |
| A | 0 | 6 | 0 |
| B | 0 | 6 | 0 |
| C | 0 | 6 | 0 |
| D | 0 | 6 | 0 |
| Quadrant | Total seconds | Saturated seconds | Saturation percentage |
|---|---|---|---|
| A | 8348 | 97 | 1.161955% |
| B | 8348 | 303 | 3.629612% |
| C | 8348 | 186 | 2.228079% |
| D | 8348 | 490 | 5.869669% |
Noise dominated data is calculated using 1-second bins in cleaned event files. If a bin has >2000 counts, and if more than 50% of those come from <1% of pixels, then it is considered to be noise-dominated and hence unusable.
| Quadrant | # 1 sec bins | Bins with >0 counts | Bins with >2000 counts | High rate bins dominated by noise | Noise dominated (total time) | Noise dominated (detector-on time) | Marked lightcurve |
|---|---|---|---|---|---|---|---|
| A | 8918 | 8350 | 1 | 1 | 0.01% | 0.01% | 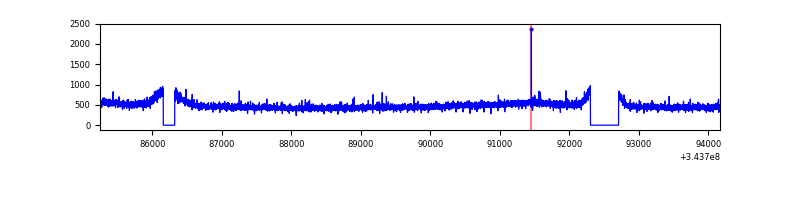 |
| B | 8918 | 8348 | 70 | 70 | 0.78% | 0.84% | 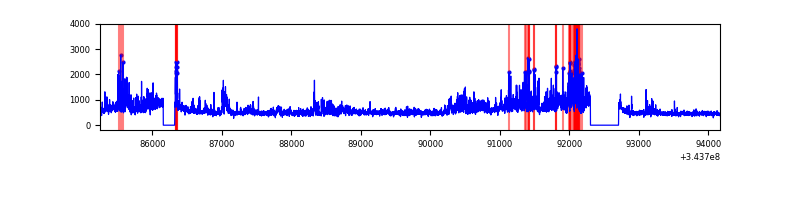 |
| C | 8918 | 8348 | 0 | 0 | 0.00% | 0.00% | 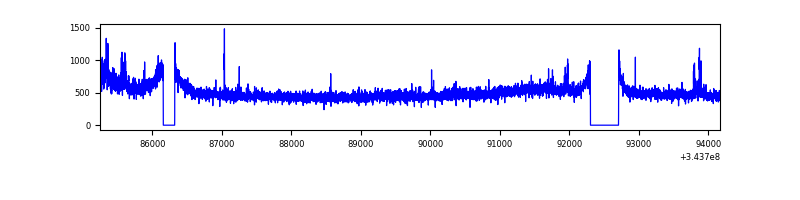 |
| D | 8918 | 8349 | 239 | 239 | 2.68% | 2.86% | 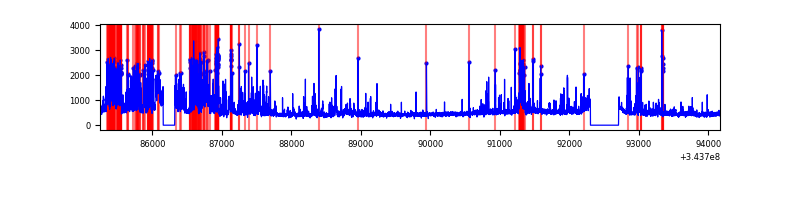 |
Top three noisy pixels from each quadrant. If the there are fewer than three noisy pixels in the level2.evt file, extra rows are filled as -1
| Pixel properties | Quadrant properties | ||||||
|---|---|---|---|---|---|---|---|
| Quadrant | DetID | PixID | Counts | Sigma | Mean | Median | Sigma |
| A | 13 | 254 | 14682 | 65.1 | 1034 | 1011 | 210.0 |
| A | 3 | 137 | 9948 | 42.56 | 1034 | 1011 | 210.0 |
| A | 0 | 226 | 8925 | 37.69 | 1034 | 1011 | 210.0 |
| B | 10 | 245 | 742297 | 3822.52 | 1011 | 982 | 193.9 |
| B | 10 | 246 | 165806 | 849.9 | 1011 | 982 | 193.9 |
| B | 0 | 230 | 151936 | 778.38 | 1011 | 982 | 193.9 |
| C | 3 | 233 | 186089 | 789.44 | 989 | 993 | 234.5 |
| C | 14 | 238 | 155641 | 659.58 | 989 | 993 | 234.5 |
| C | 6 | 112 | 9087 | 34.52 | 989 | 993 | 234.5 |
| D | 1 | 52 | 1200486 | 5097.89 | 987 | 961 | 235.3 |
| D | 2 | 250 | 450080 | 1908.72 | 987 | 961 | 235.3 |
| D | 2 | 234 | 41030 | 170.29 | 987 | 961 | 235.3 |
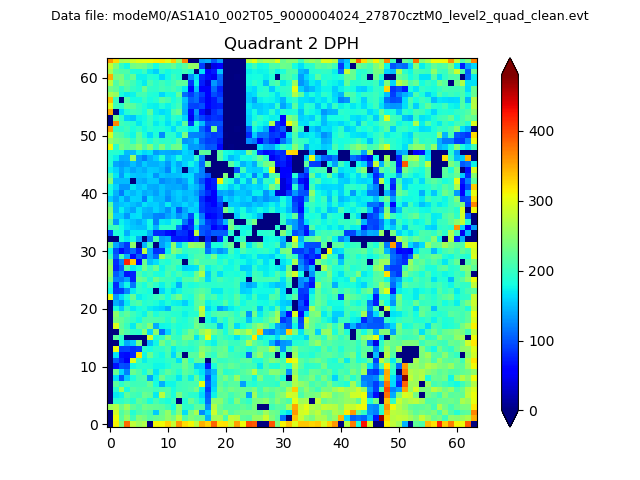
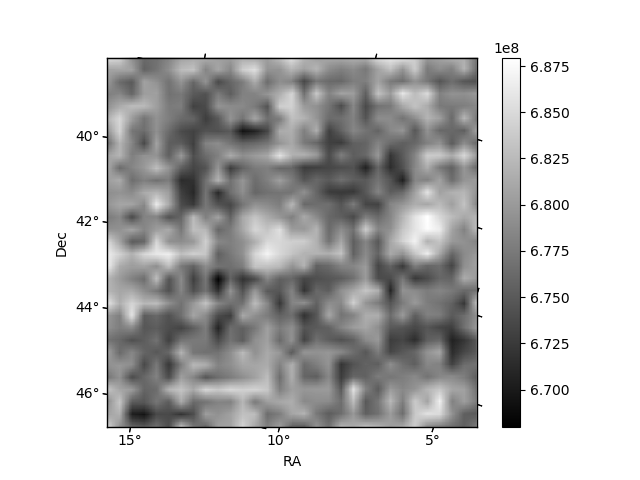
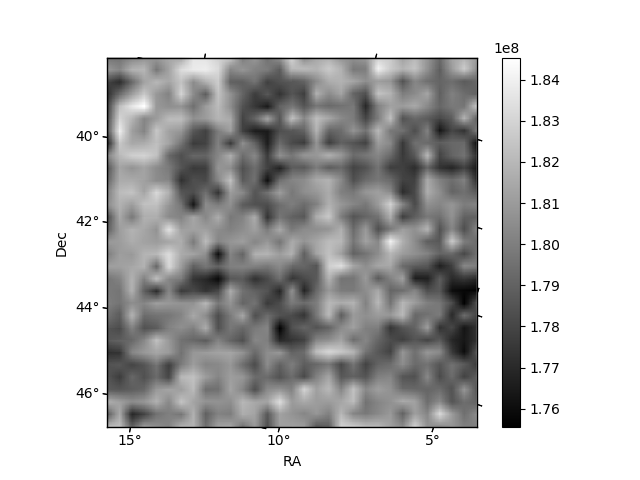
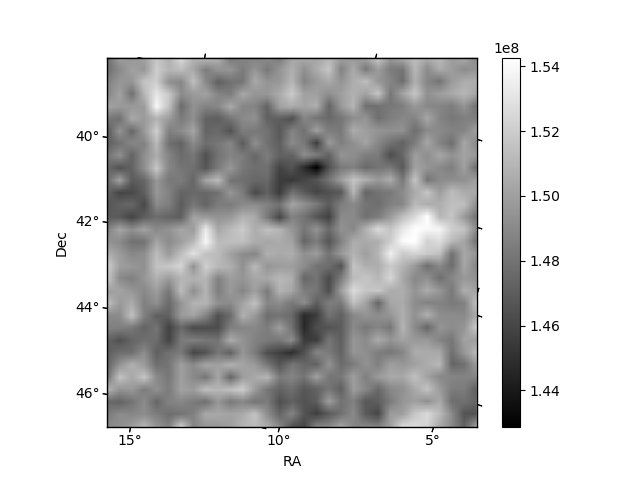
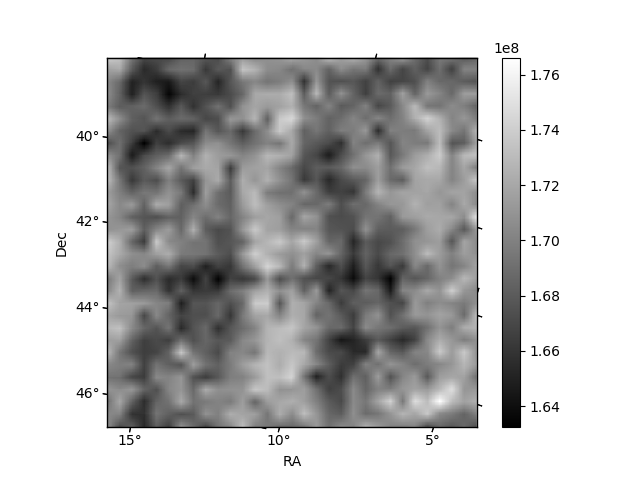
Histogram calculated using DETX and DETY for each event in the final _common_clean file
| Quadrant A | 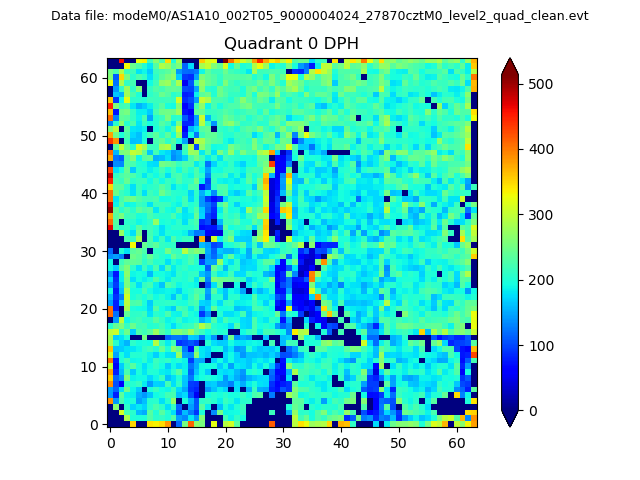 |
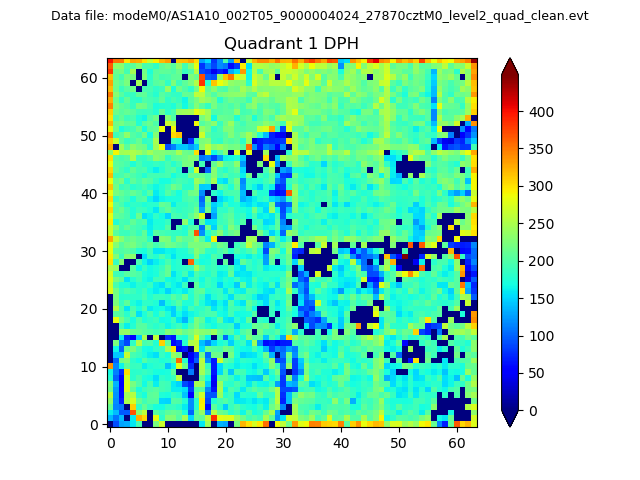 |
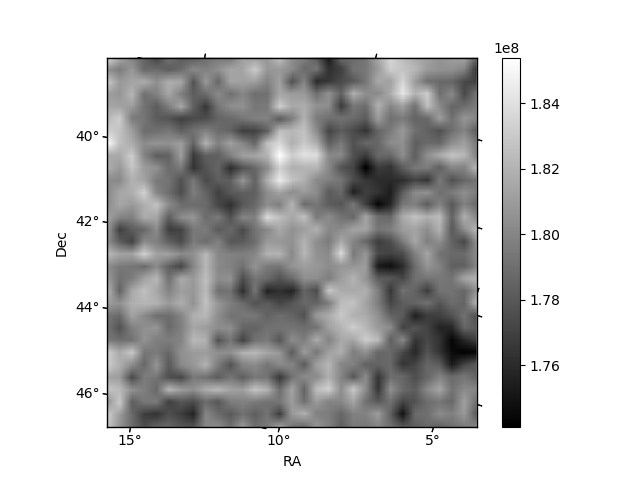
Quadrant B |
|---|---|---|---|
| Quadrant D | 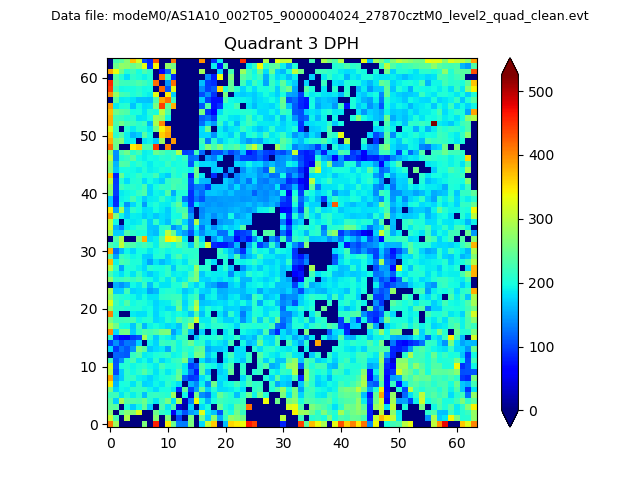 |
 |
Quadrant C |
| Plot type | Count rate plots | Images |
|---|---|---|
| Comparison with Poisson distribution Blue bars denote a histogram of data divided into 1 sec bins. Red curve is a Poisson curve with rate = median count rate of data. |
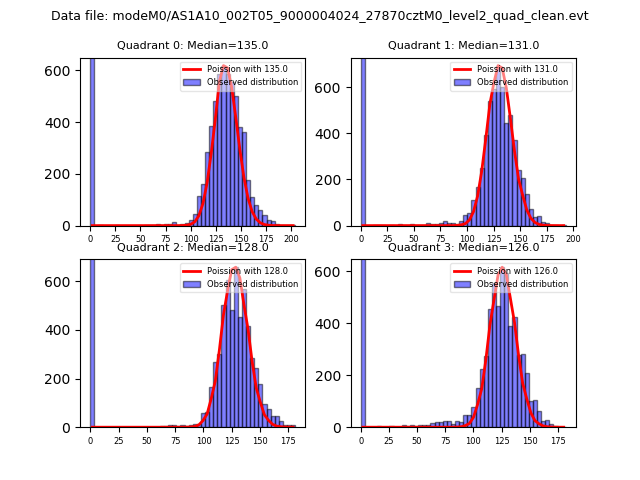 |
 |
| Quadrant-wise count rates Data is divided into 100 sec bins |
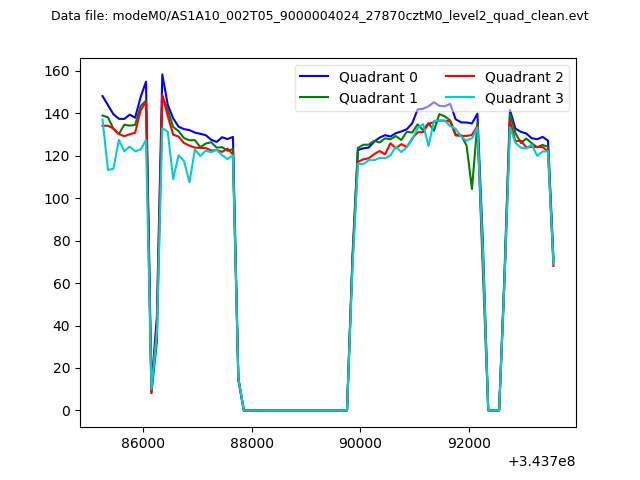 |
|
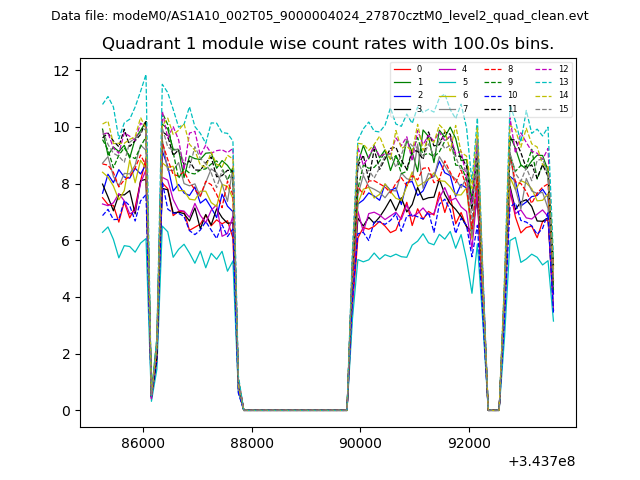
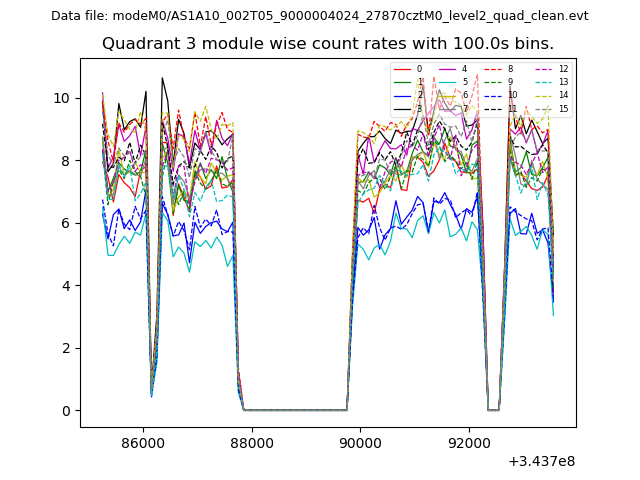
| Module-wise count rates for Quadrant A Data is divided into 100 sec bins |
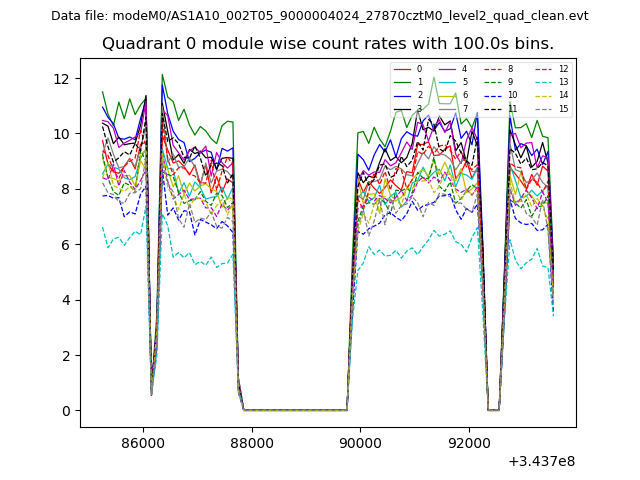 |
 |
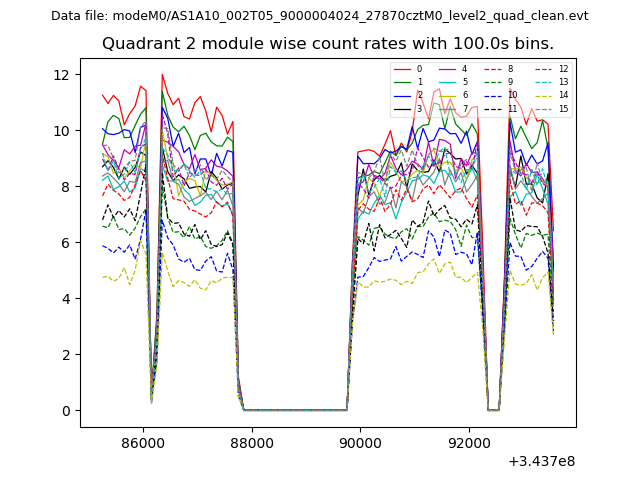
| Module-wise count rates for Quadrant B Data is divided into 100 sec bins |
 |
 |
| Module-wise count rates for Quadrant C Data is divided into 100 sec bins |
 |
 |
| Module-wise count rates for Quadrant D Data is divided into 100 sec bins |
 |
 |
| Parameter | Plot |
|---|---|
| CZT HV Monitor | 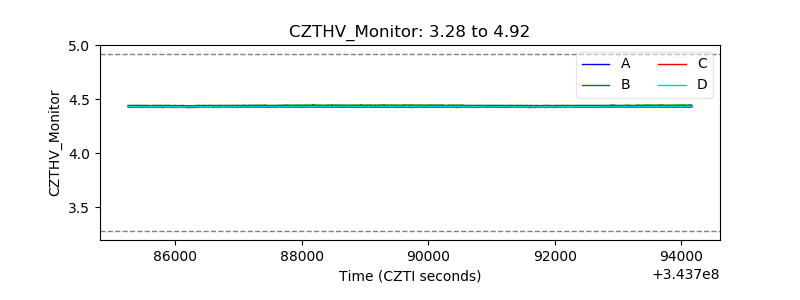 |
| D_VDD | 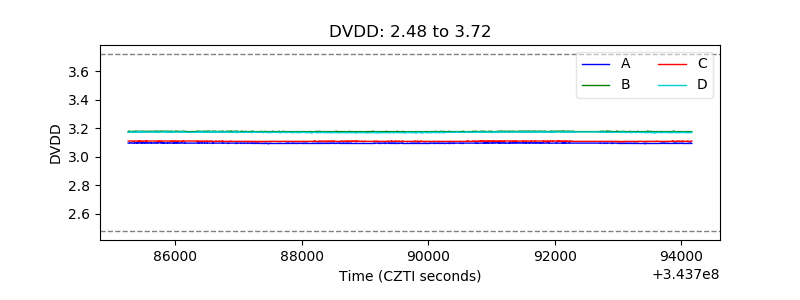 |
| Temperature 1 |  |
| Veto HV Monitor | 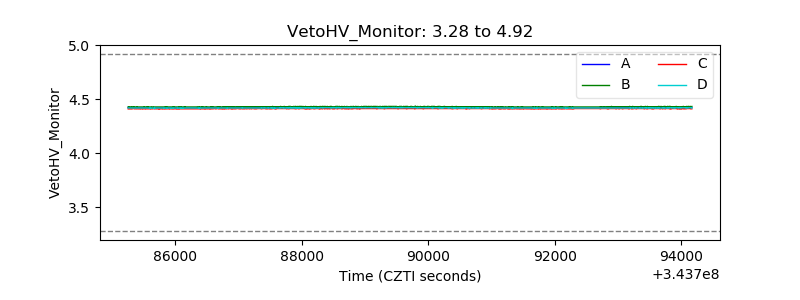 |
| Veto LLD | 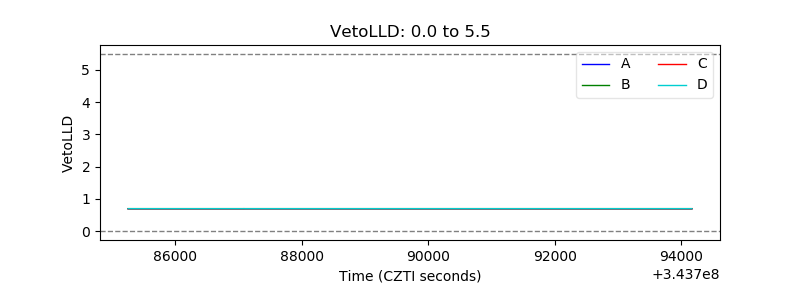 |
| Alpha Counter | 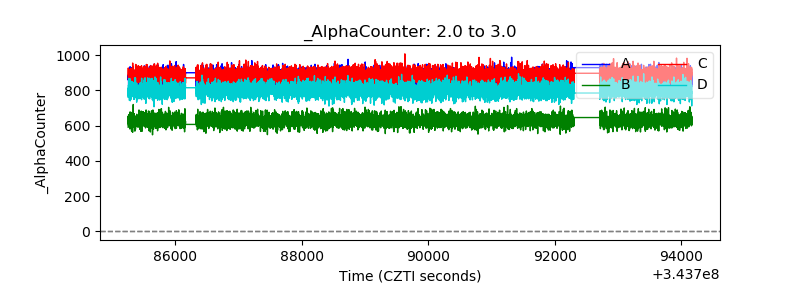 |
| _CPM_Rate | 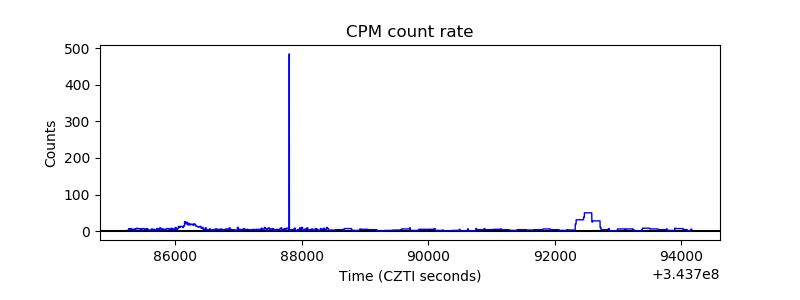 |
| CZT Counter | 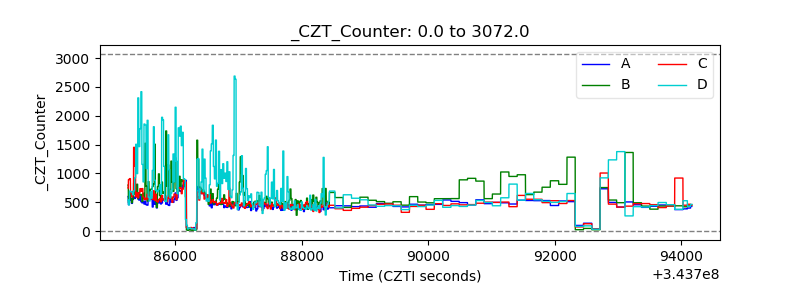 |
| +2.5 Volts monitor |  |
| +5 Volts monitor |  |
| _ROLL_ROT | 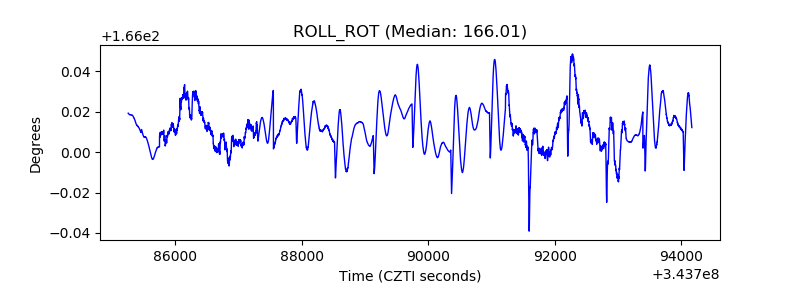 |
| _Roll_DEC |  |
| _Roll_RA | 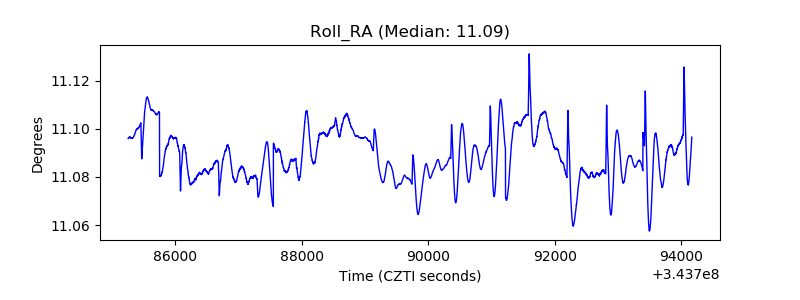 |
| Veto Counter |  |