| Param | Original file | Final file |
|---|---|---|
| Filename | modeM0/AS1A10_002T05_9000004024_27872cztM0_level2.evt | modeM0/AS1A10_002T05_9000004024_27872cztM0_level2_quad_clean.evt |
| Size (bytes) | 987,344,640 | 146,721,600 |
| Size | 941.6 MB | 139.9 MB |
| Events in quadrant A | 6,018,056 | 927,069 |
| Events in quadrant B | 7,258,560 | 900,238 |
| Events in quadrant C | 7,294,270 | 876,975 |
| Events in quadrant D | 8,469,415 | 857,791 |
| Mode M0 | |||
|---|---|---|---|
| Quadrant | BADHDUFLAG | Total packets | Discarded packets |
| A | 0 | 26125 | 0 |
| B | 0 | 29614 | 0 |
| C | 0 | 29963 | 0 |
| D | 0 | 33964 | 0 |
| Mode M9 | |||
|---|---|---|---|
| Quadrant | BADHDUFLAG | Total packets | Discarded packets |
| A | 0 | 17 | 0 |
| B | 0 | 18 | 0 |
| C | 0 | 18 | 0 |
| D | 0 | 18 | 0 |
| Quadrant | Total seconds | Saturated seconds | Saturation percentage |
|---|---|---|---|
| A | 12753 | 52 | 0.407747% |
| B | 12753 | 230 | 1.803497% |
| C | 12753 | 259 | 2.030895% |
| D | 12753 | 552 | 4.328393% |
Noise dominated data is calculated using 1-second bins in cleaned event files. If a bin has >2000 counts, and if more than 50% of those come from <1% of pixels, then it is considered to be noise-dominated and hence unusable.
| Quadrant | # 1 sec bins | Bins with >0 counts | Bins with >2000 counts | High rate bins dominated by noise | Noise dominated (total time) | Noise dominated (detector-on time) | Marked lightcurve |
|---|---|---|---|---|---|---|---|
| A | 14073 | 12754 | 2 | 2 | 0.01% | 0.02% | 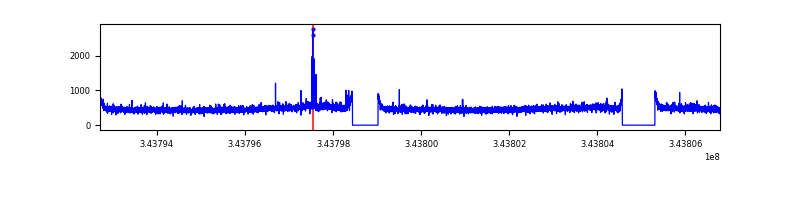 |
| B | 14073 | 12753 | 94 | 94 | 0.67% | 0.74% | 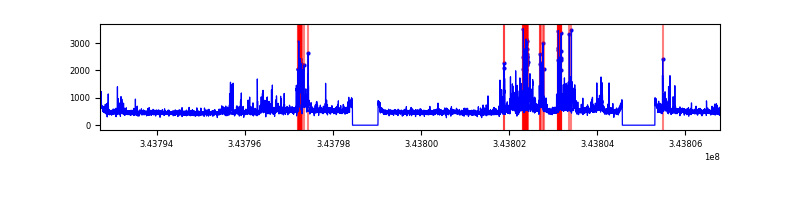 |
| C | 14073 | 12754 | 42 | 42 | 0.30% | 0.33% | 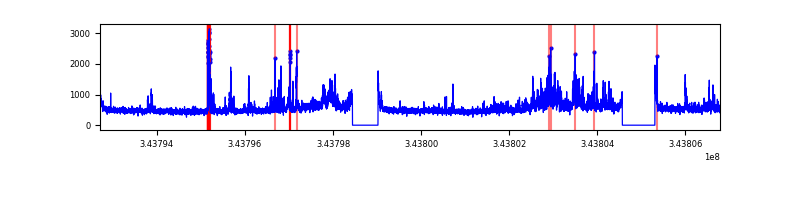 |
| D | 14073 | 12754 | 464 | 464 | 3.30% | 3.64% |  |
Top three noisy pixels from each quadrant. If the there are fewer than three noisy pixels in the level2.evt file, extra rows are filled as -1
| Pixel properties | Quadrant properties | ||||||
|---|---|---|---|---|---|---|---|
| Quadrant | DetID | PixID | Counts | Sigma | Mean | Median | Sigma |
| A | 0 | 13 | 31140 | 94.57 | 1544 | 1512 | 313.3 |
| A | 13 | 248 | 26554 | 79.93 | 1544 | 1512 | 313.3 |
| A | 13 | 254 | 22529 | 67.08 | 1544 | 1512 | 313.3 |
| B | 10 | 245 | 1099472 | 3747.23 | 1523 | 1480 | 293.0 |
| B | 0 | 190 | 85085 | 285.33 | 1523 | 1480 | 293.0 |
| B | 0 | 230 | 54584 | 181.23 | 1523 | 1480 | 293.0 |
| C | 3 | 233 | 1083999 | 3128.44 | 1474 | 1482 | 346.0 |
| C | 14 | 238 | 234192 | 672.52 | 1474 | 1482 | 346.0 |
| C | 15 | 208 | 154498 | 442.21 | 1474 | 1482 | 346.0 |
| D | 1 | 52 | 2282440 | 6475.08 | 1478 | 1443 | 352.3 |
| D | 2 | 250 | 470461 | 1331.4 | 1478 | 1443 | 352.3 |
| D | 2 | 234 | 57826 | 160.05 | 1478 | 1443 | 352.3 |
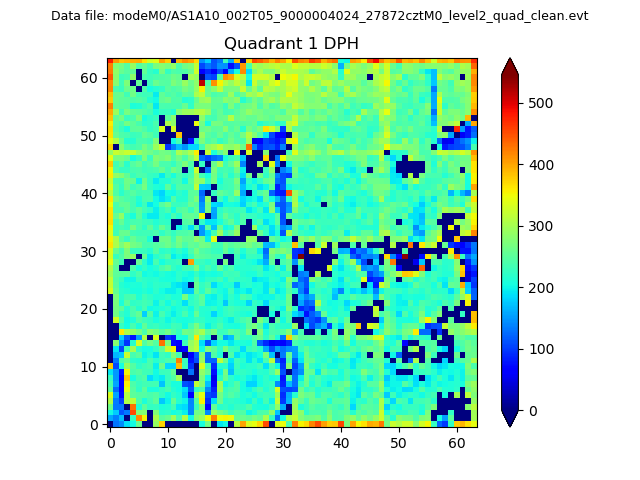
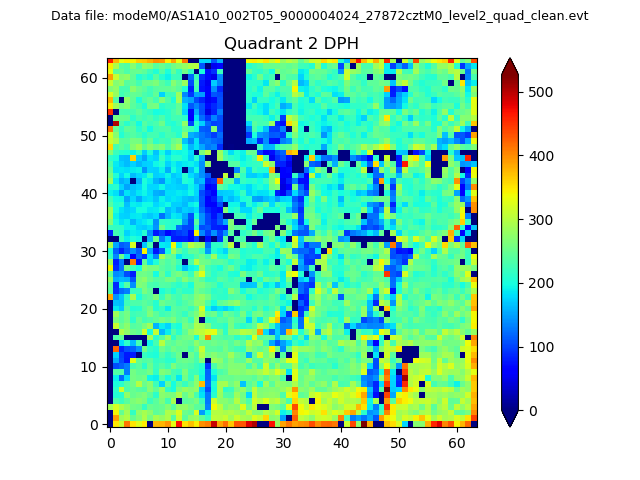
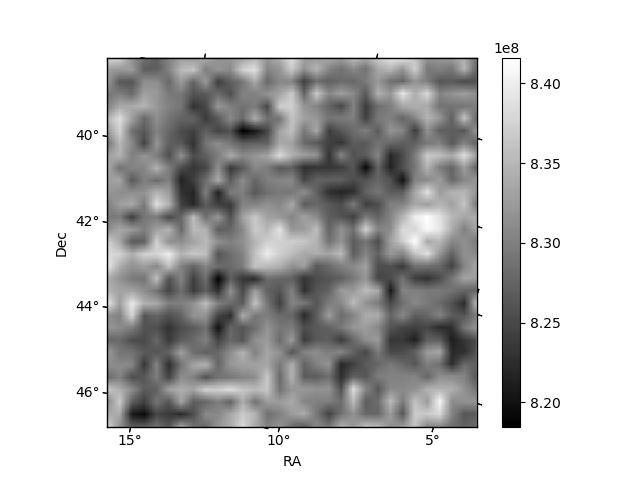
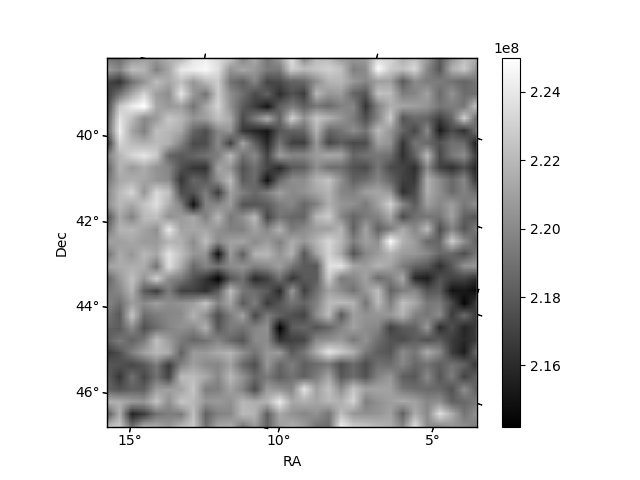
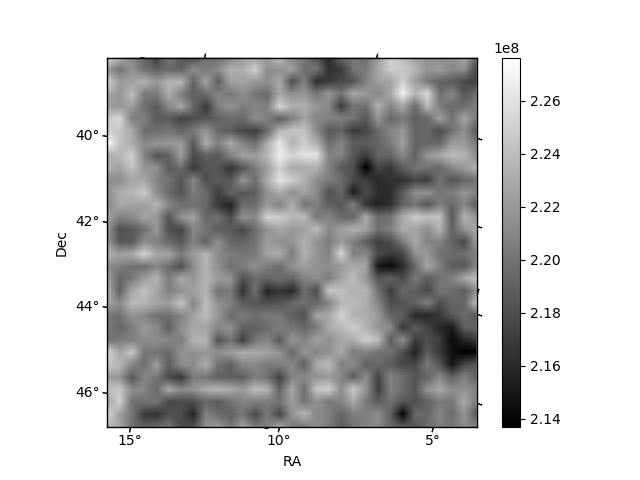
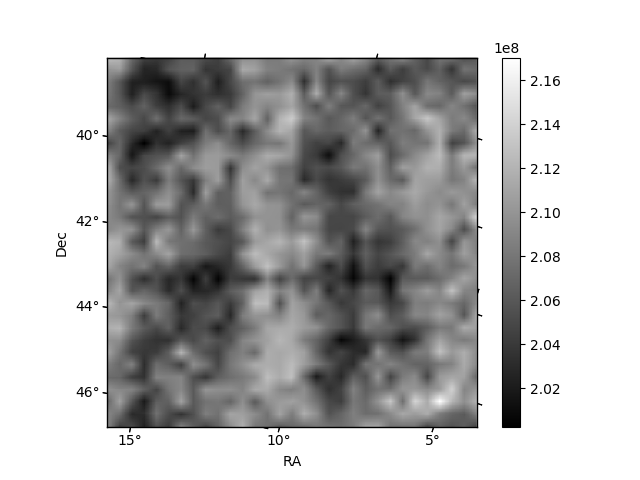
Histogram calculated using DETX and DETY for each event in the final _common_clean file
| Quadrant A | 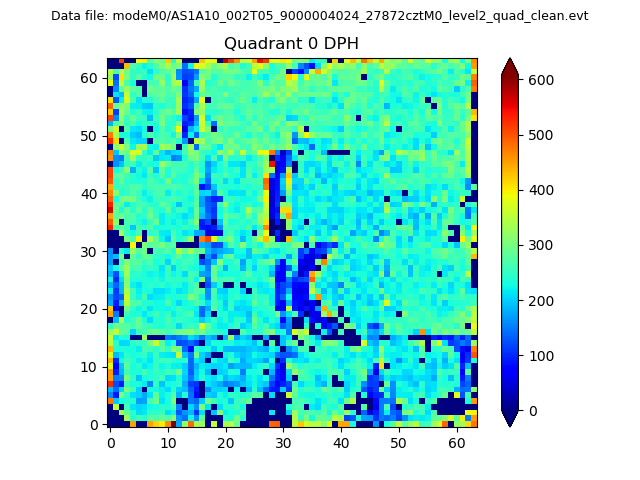 |
 |
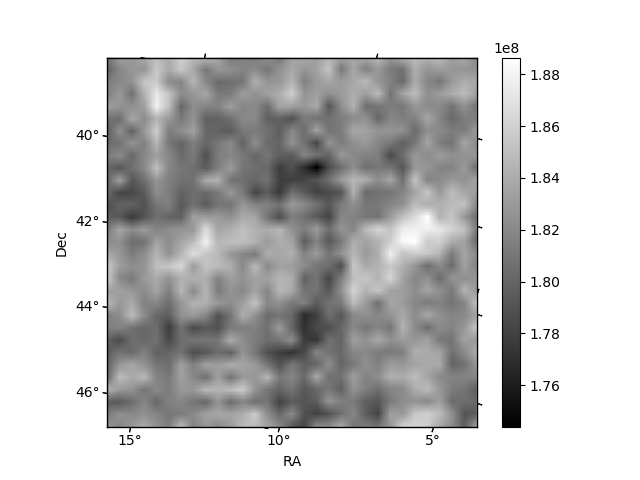
Quadrant B |
|---|---|---|---|
| Quadrant D | 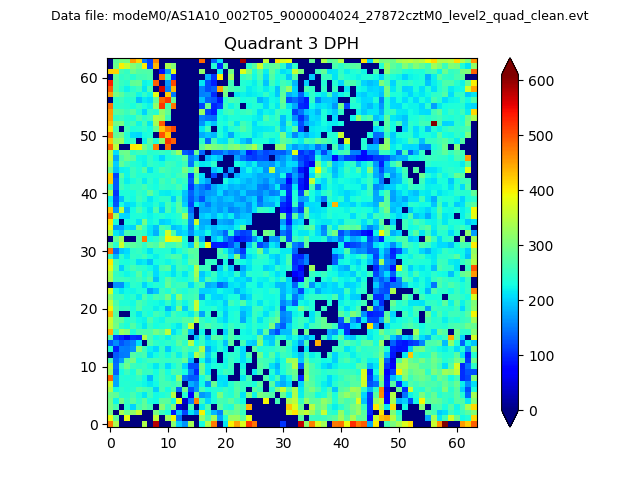 |
 |
Quadrant C |
| Plot type | Count rate plots | Images |
|---|---|---|
| Comparison with Poisson distribution Blue bars denote a histogram of data divided into 1 sec bins. Red curve is a Poisson curve with rate = median count rate of data. |
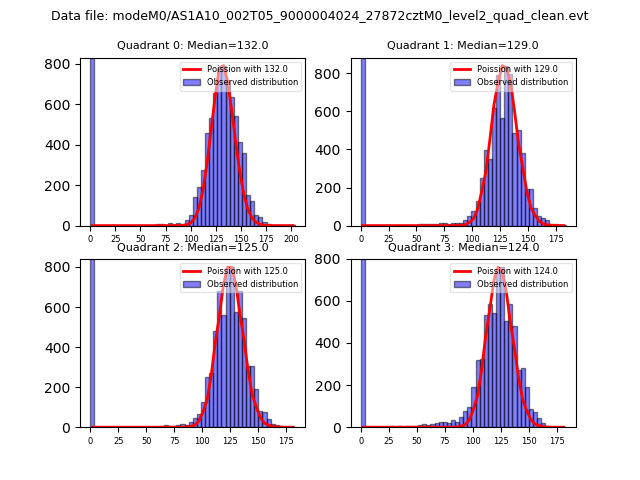 |
 |
| Quadrant-wise count rates Data is divided into 100 sec bins |
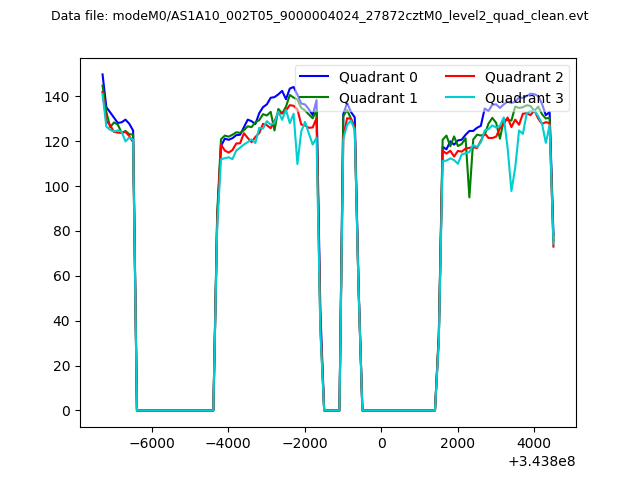 |
|
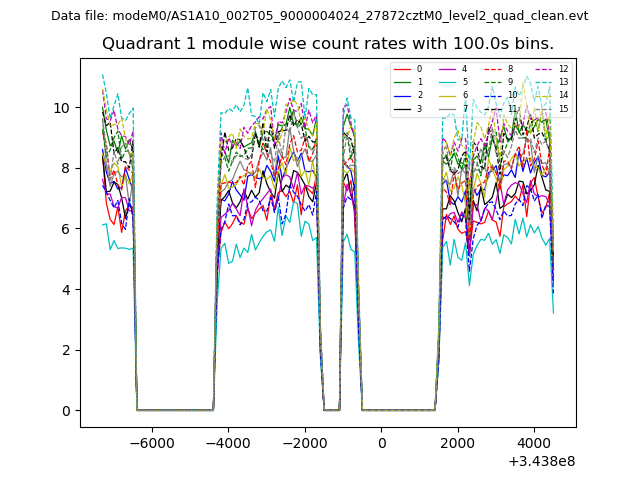
| Module-wise count rates for Quadrant A Data is divided into 100 sec bins |
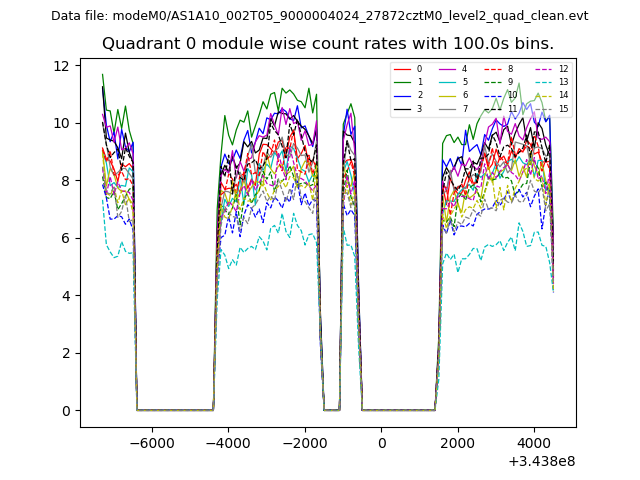 |
 |
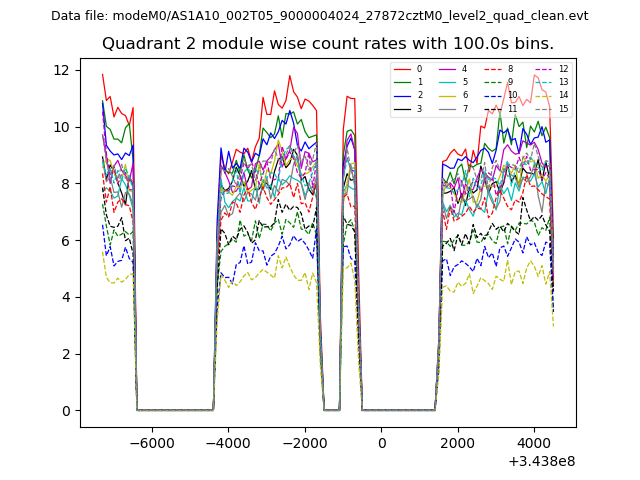
| Module-wise count rates for Quadrant B Data is divided into 100 sec bins |
 |
 |
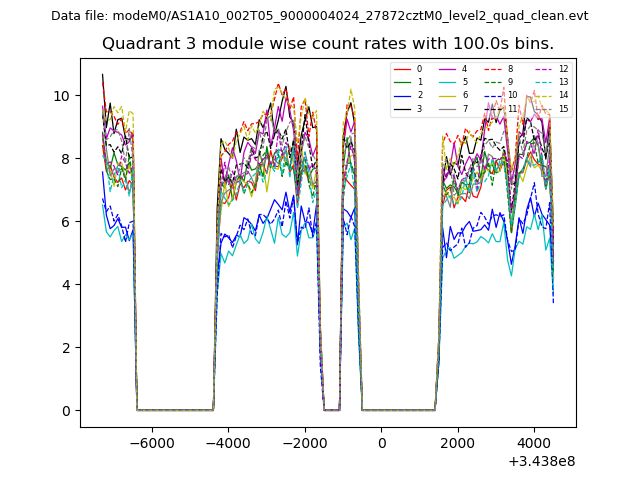
| Module-wise count rates for Quadrant C Data is divided into 100 sec bins |
 |
 |
| Module-wise count rates for Quadrant D Data is divided into 100 sec bins |
 |
 |
| Parameter | Plot |
|---|---|
| CZT HV Monitor | 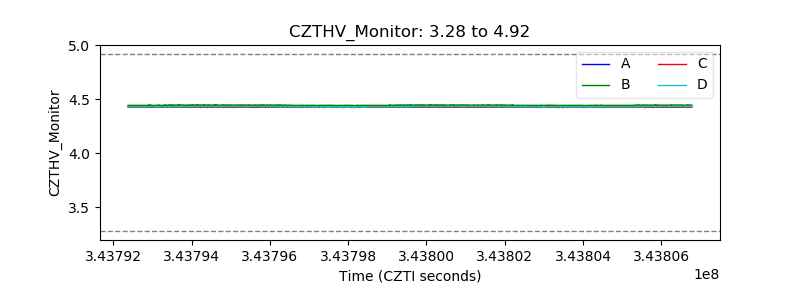 |
| D_VDD | 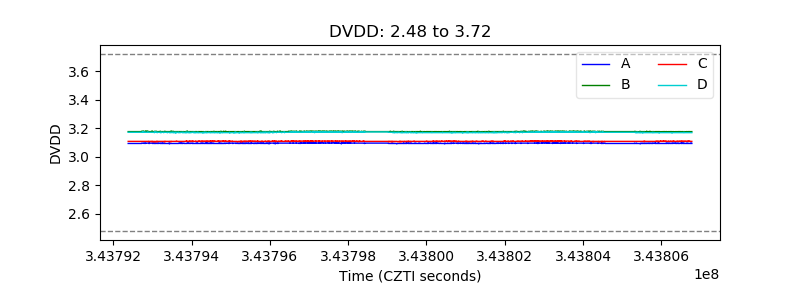 |
| Temperature 1 |  |
| Veto HV Monitor | 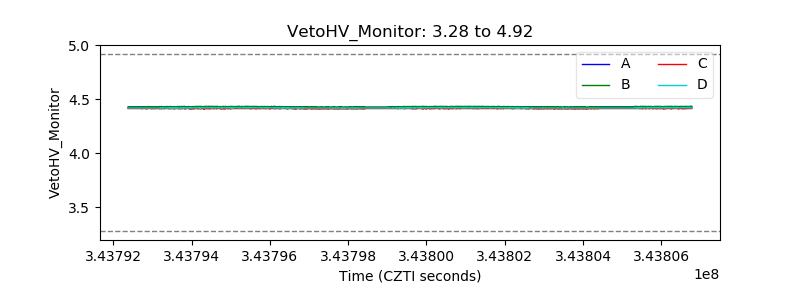 |
| Veto LLD | 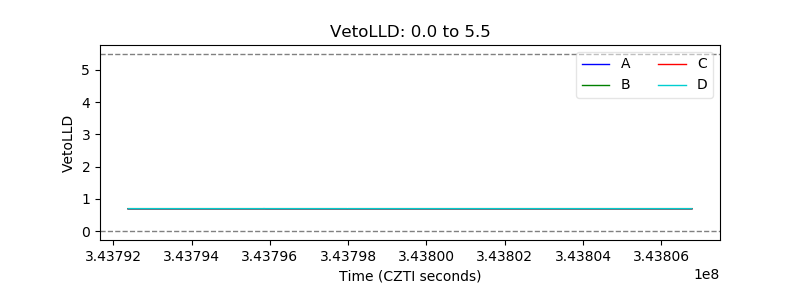 |
| Alpha Counter | 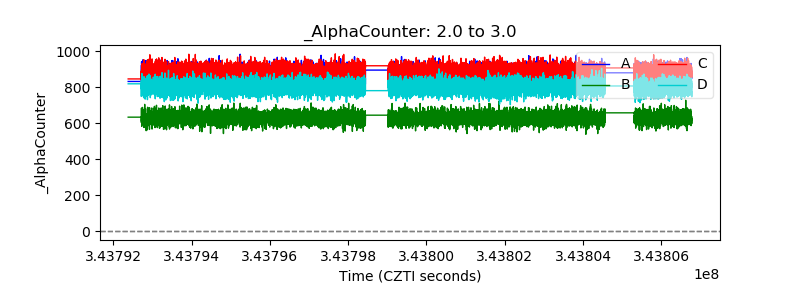 |
| _CPM_Rate | 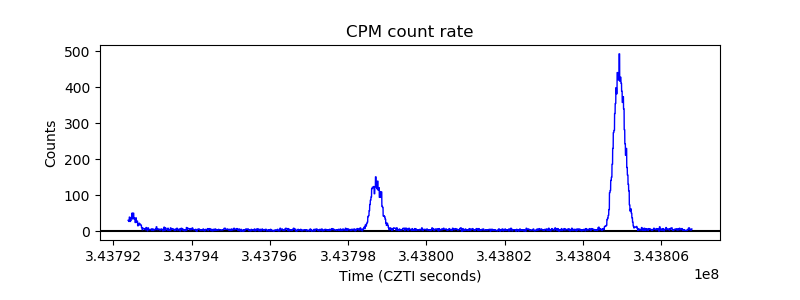 |
| CZT Counter | 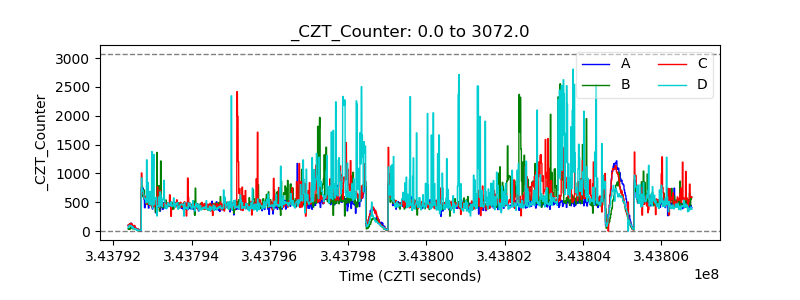 |
| +2.5 Volts monitor |  |
| +5 Volts monitor |  |
| _ROLL_ROT | 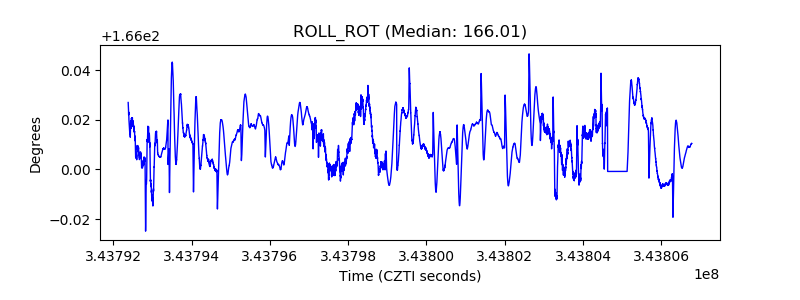 |
| _Roll_DEC | 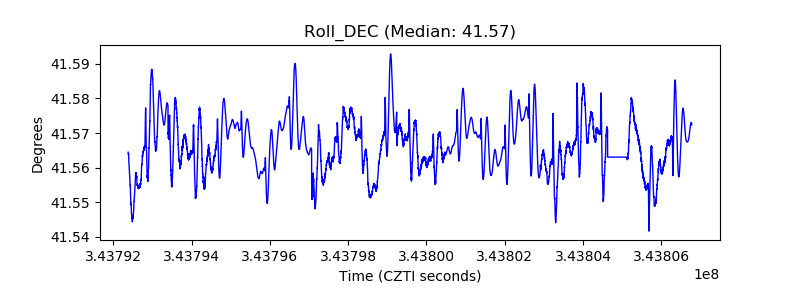 |
| _Roll_RA | 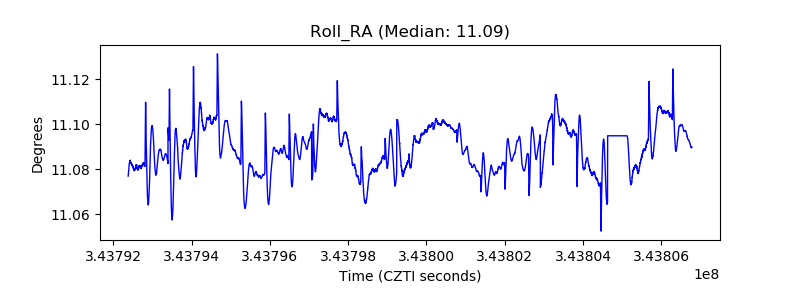 |
| Veto Counter | 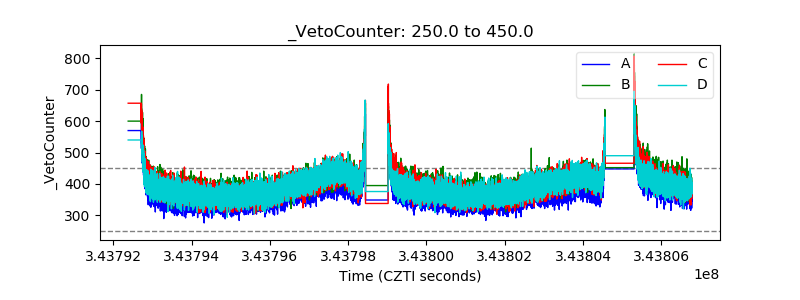 |