| Param | Original file | Final file |
|---|---|---|
| Filename | modeM0/AS1A10_002T05_9000004024_27873cztM0_level2.evt | modeM0/AS1A10_002T05_9000004024_27873cztM0_level2_quad_clean.evt |
| Size (bytes) | 516,614,400 | 73,935,360 |
| Size | 492.7 MB | 70.5 MB |
| Events in quadrant A | 3,408,145 | 453,134 |
| Events in quadrant B | 4,286,818 | 438,876 |
| Events in quadrant C | 3,744,744 | 428,022 |
| Events in quadrant D | 3,727,588 | 427,527 |
| Mode M0 | |||
|---|---|---|---|
| Quadrant | BADHDUFLAG | Total packets | Discarded packets |
| A | 0 | 14466 | 0 |
| B | 0 | 17038 | 0 |
| C | 0 | 15273 | 0 |
| D | 0 | 15802 | 0 |
| Mode M9 | |||
|---|---|---|---|
| Quadrant | BADHDUFLAG | Total packets | Discarded packets |
| A | 0 | 17 | 0 |
| B | 0 | 17 | 0 |
| C | 0 | 17 | 0 |
| D | 0 | 17 | 0 |
| Quadrant | Total seconds | Saturated seconds | Saturation percentage |
|---|---|---|---|
| A | 7054 | 56 | 0.793876% |
| B | 7055 | 157 | 2.225372% |
| C | 7055 | 128 | 1.814316% |
| D | 7055 | 78 | 1.105599% |
Noise dominated data is calculated using 1-second bins in cleaned event files. If a bin has >2000 counts, and if more than 50% of those come from <1% of pixels, then it is considered to be noise-dominated and hence unusable.
| Quadrant | # 1 sec bins | Bins with >0 counts | Bins with >2000 counts | High rate bins dominated by noise | Noise dominated (total time) | Noise dominated (detector-on time) | Marked lightcurve |
|---|---|---|---|---|---|---|---|
| A | 8689 | 7055 | 0 | 0 | 0.00% | 0.00% | 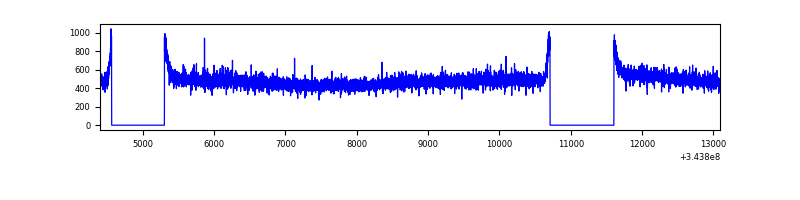 |
| B | 8690 | 7055 | 41 | 41 | 0.47% | 0.58% | 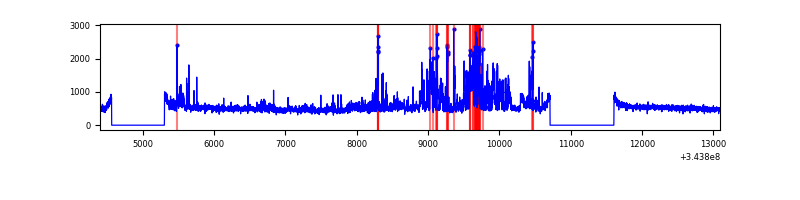 |
| C | 8690 | 7056 | 5 | 5 | 0.06% | 0.07% | 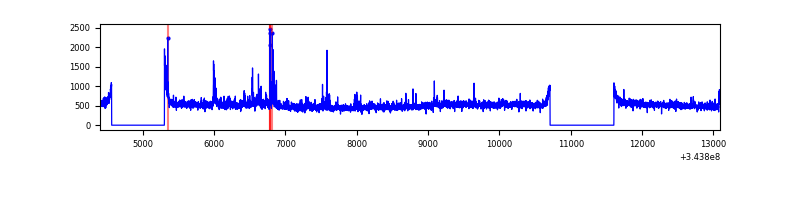 |
| D | 8690 | 7056 | 42 | 42 | 0.48% | 0.60% | 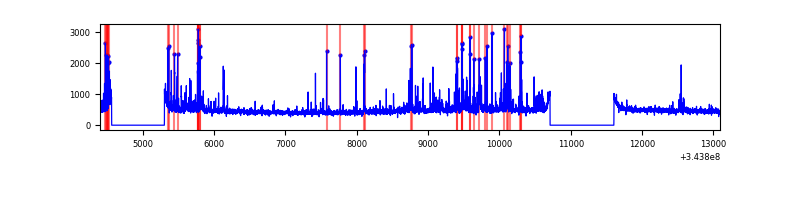 |
Top three noisy pixels from each quadrant. If the there are fewer than three noisy pixels in the level2.evt file, extra rows are filled as -1
| Pixel properties | Quadrant properties | ||||||
|---|---|---|---|---|---|---|---|
| Quadrant | DetID | PixID | Counts | Sigma | Mean | Median | Sigma |
| A | 13 | 254 | 11831 | 61.16 | 883 | 863 | 179.3 |
| A | 3 | 137 | 8551 | 42.87 | 883 | 863 | 179.3 |
| A | 0 | 226 | 7520 | 37.12 | 883 | 863 | 179.3 |
| B | 10 | 245 | 830900 | 4945.86 | 871 | 847 | 167.8 |
| B | 12 | 111 | 21074 | 120.52 | 871 | 847 | 167.8 |
| B | 0 | 190 | 19449 | 110.84 | 871 | 847 | 167.8 |
| C | 3 | 233 | 337978 | 1712.66 | 838 | 843 | 196.8 |
| C | 14 | 238 | 134781 | 680.41 | 838 | 843 | 196.8 |
| C | 13 | 61 | 5782 | 25.09 | 838 | 843 | 196.8 |
| D | 1 | 52 | 321154 | 1595.91 | 847 | 824 | 200.7 |
| D | 2 | 250 | 115777 | 572.71 | 847 | 824 | 200.7 |
| D | 12 | 233 | 33470 | 162.65 | 847 | 824 | 200.7 |
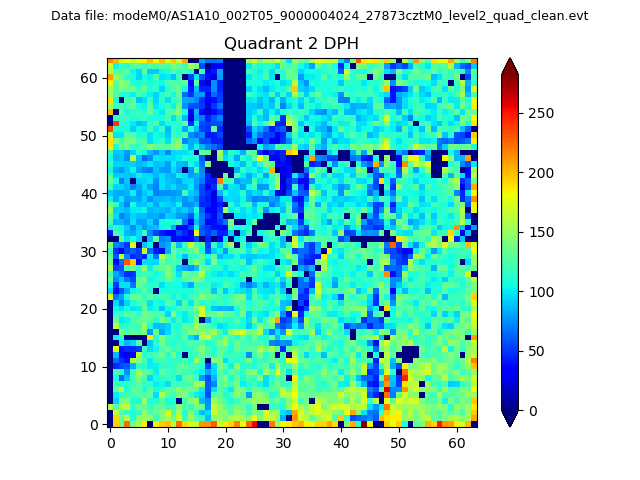
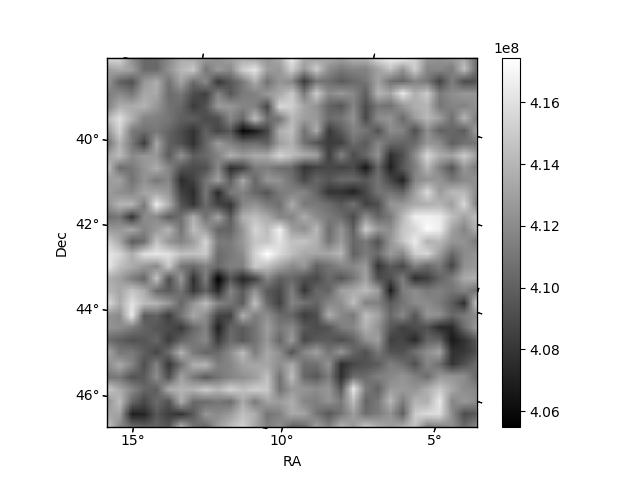
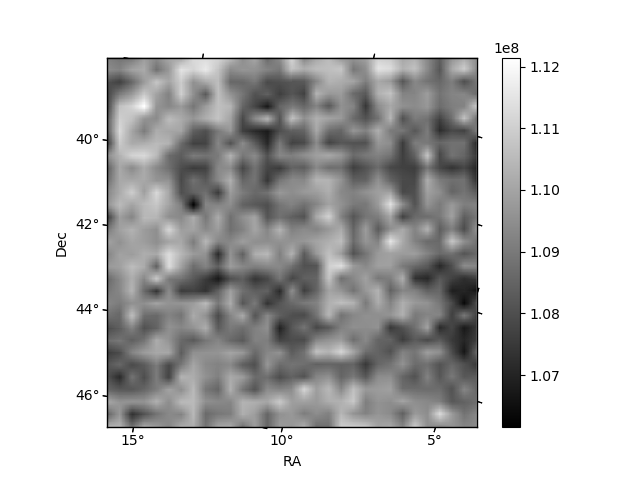
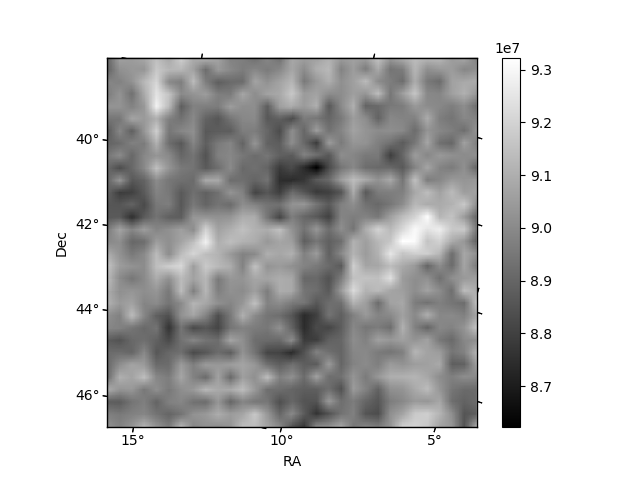
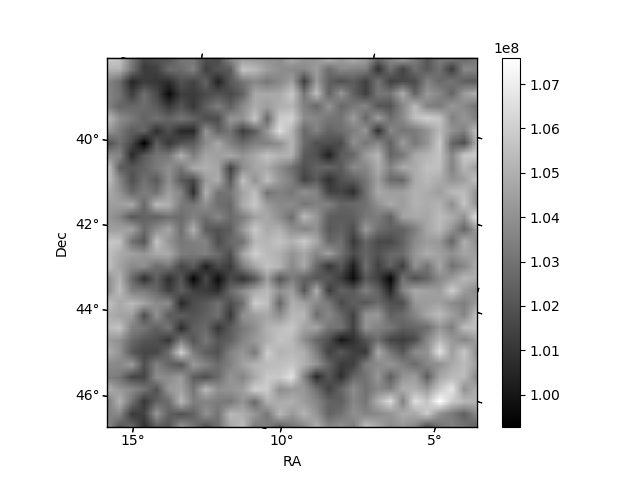
Histogram calculated using DETX and DETY for each event in the final _common_clean file
| Quadrant A | 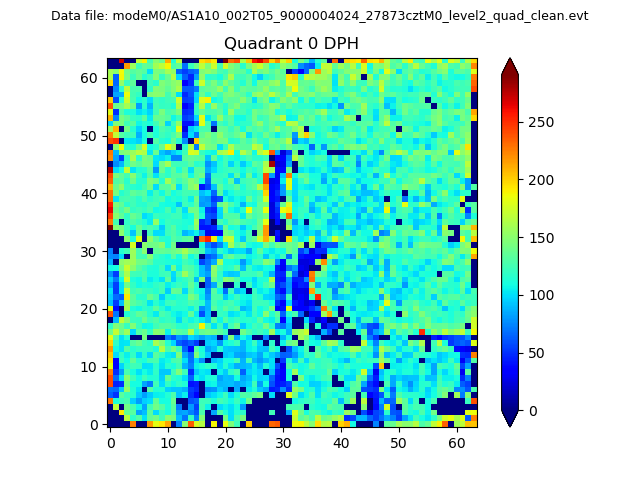 |
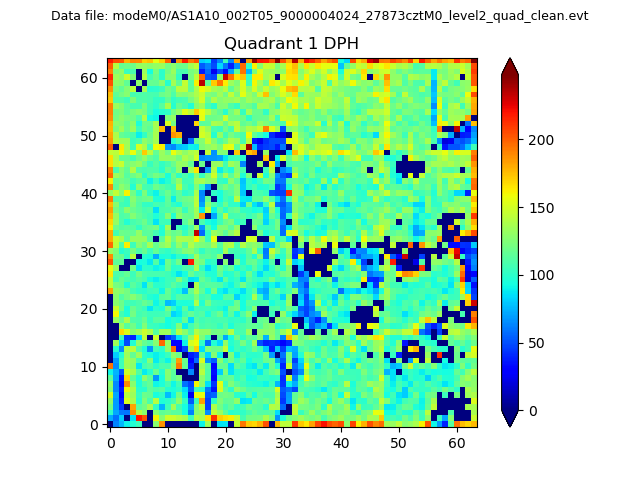 |
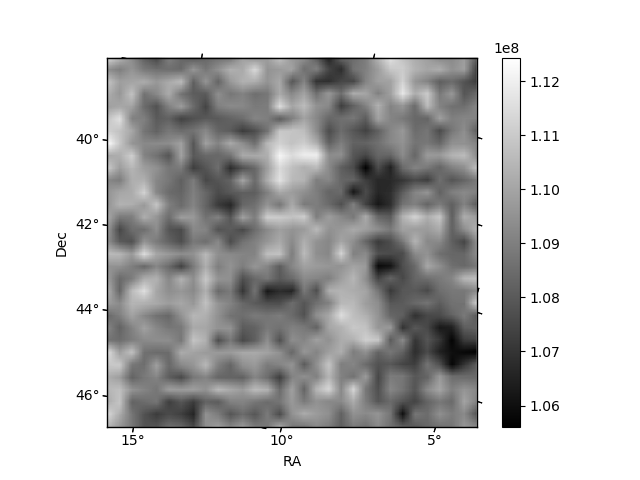
Quadrant B |
|---|---|---|---|
| Quadrant D | 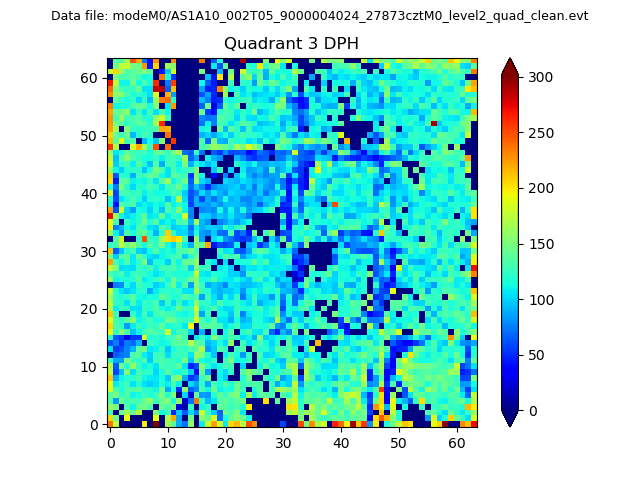 |
 |
Quadrant C |
| Plot type | Count rate plots | Images |
|---|---|---|
| Comparison with Poisson distribution Blue bars denote a histogram of data divided into 1 sec bins. Red curve is a Poisson curve with rate = median count rate of data. |
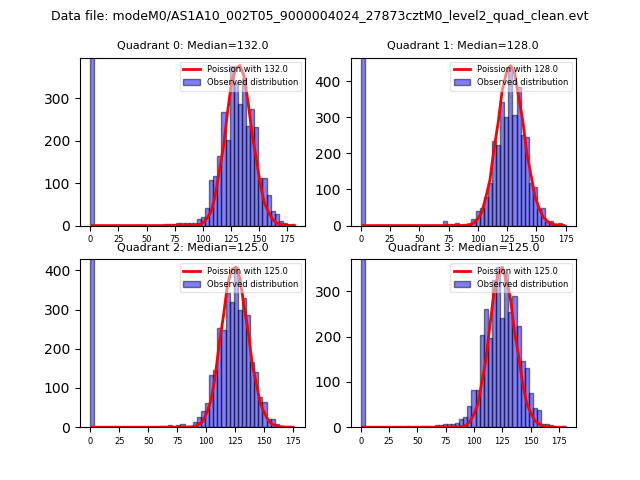 |
 |
| Quadrant-wise count rates Data is divided into 100 sec bins |
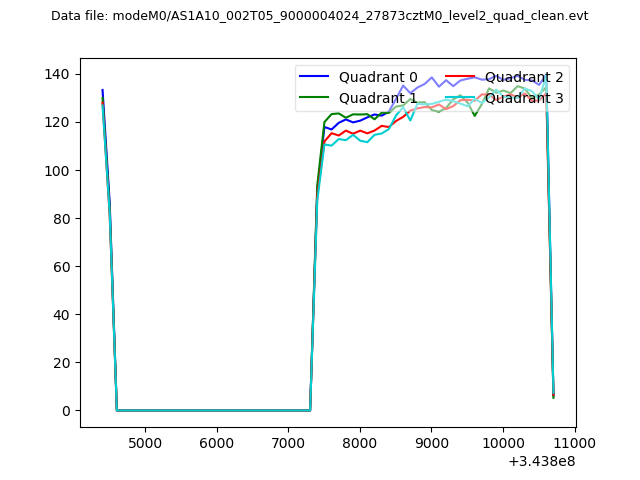 |
|
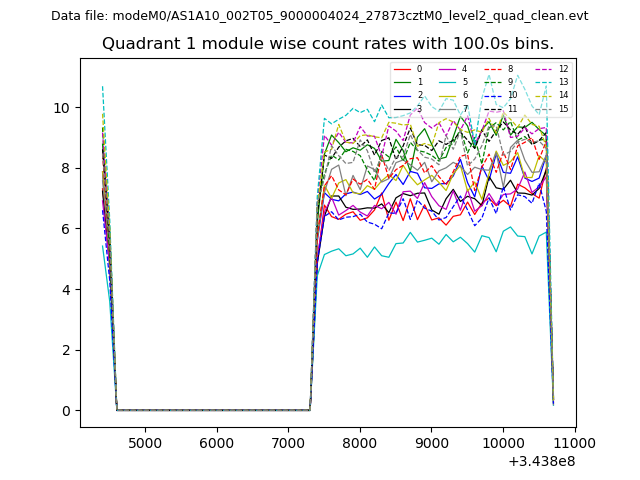
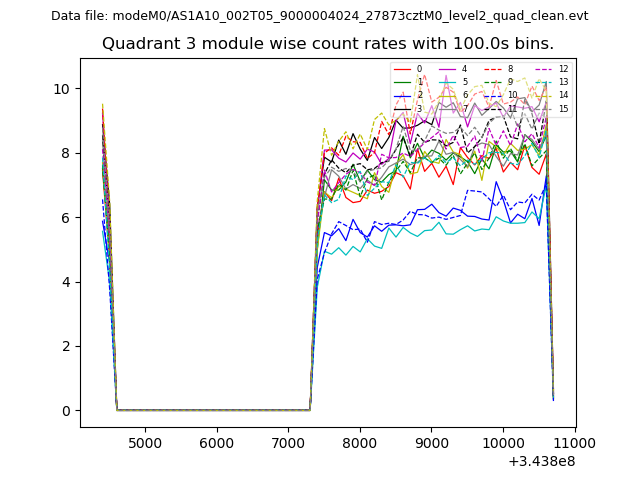
| Module-wise count rates for Quadrant A Data is divided into 100 sec bins |
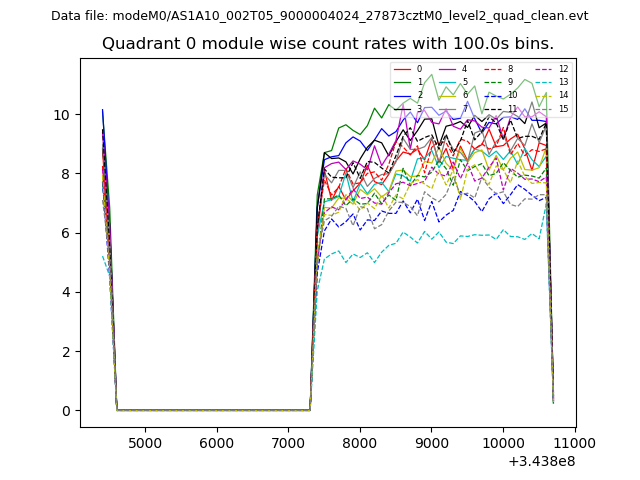 |
 |
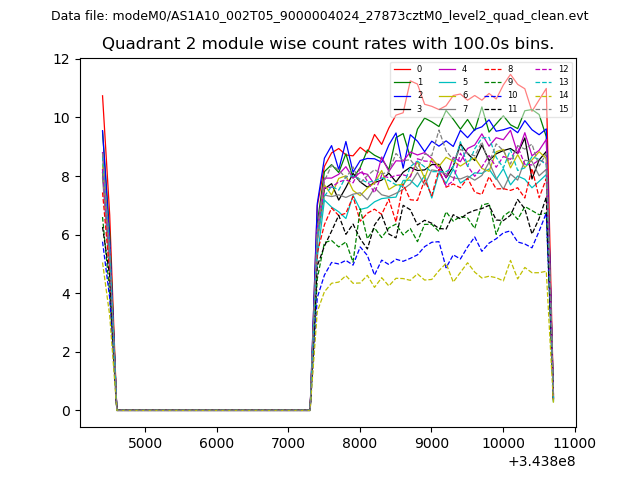
| Module-wise count rates for Quadrant B Data is divided into 100 sec bins |
 |
 |
| Module-wise count rates for Quadrant C Data is divided into 100 sec bins |
 |
 |
| Module-wise count rates for Quadrant D Data is divided into 100 sec bins |
 |
 |
| Parameter | Plot |
|---|---|
| CZT HV Monitor | 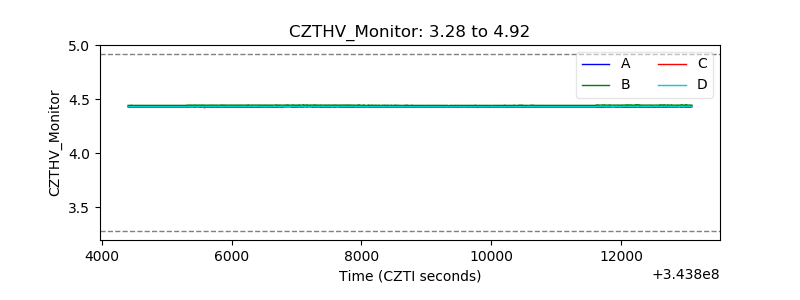 |
| D_VDD | 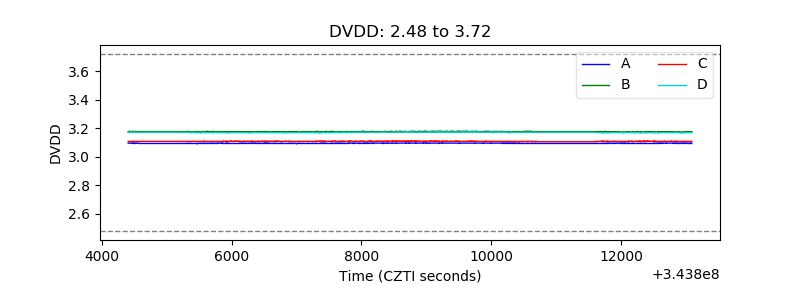 |
| Temperature 1 | 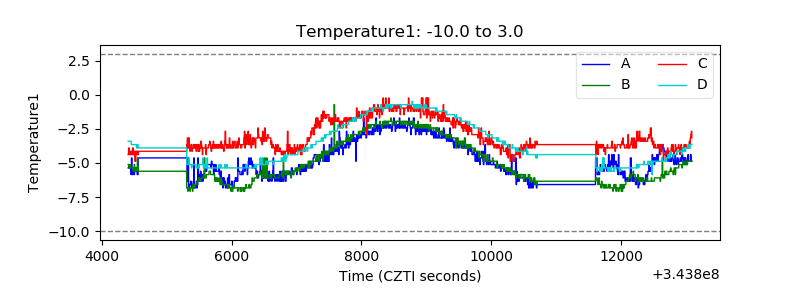 |
| Veto HV Monitor | 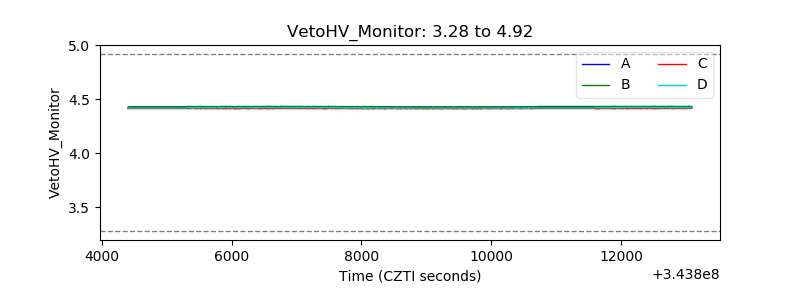 |
| Veto LLD | 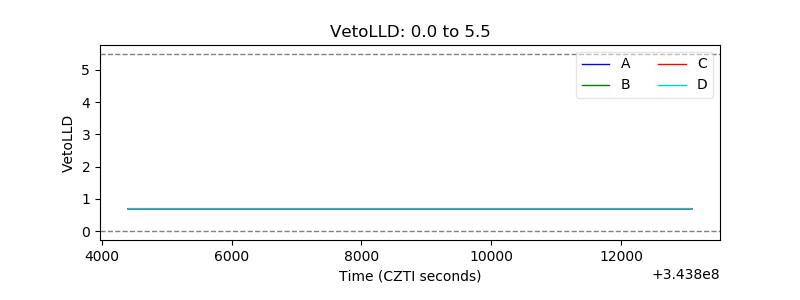 |
| Alpha Counter | 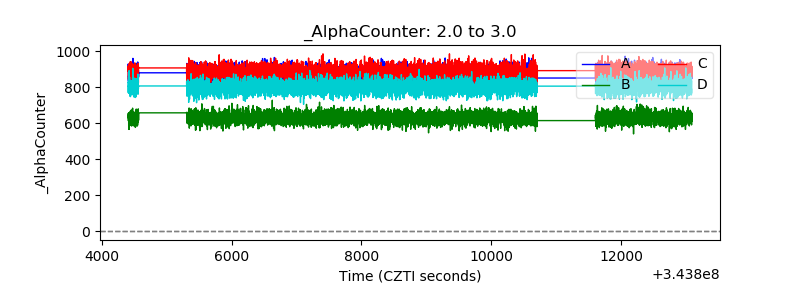 |
| _CPM_Rate | 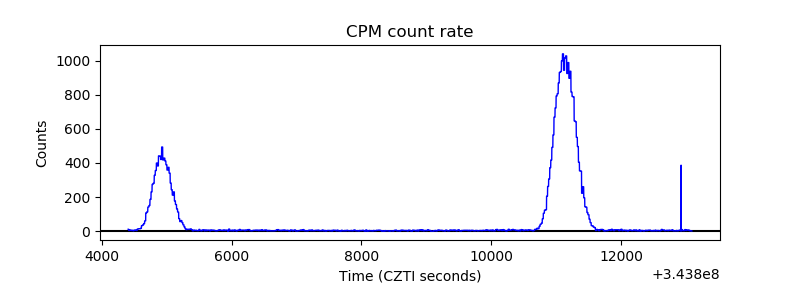 |
| CZT Counter | 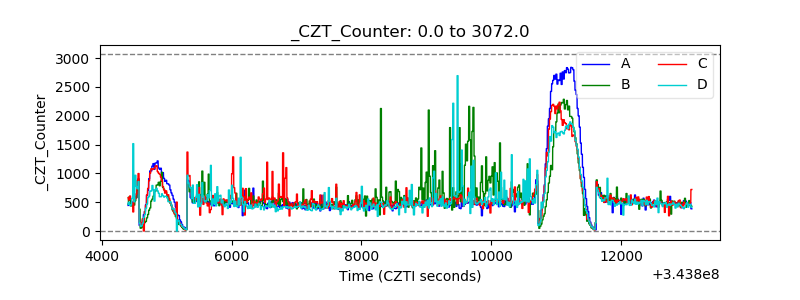 |
| +2.5 Volts monitor |  |
| +5 Volts monitor |  |
| _ROLL_ROT | 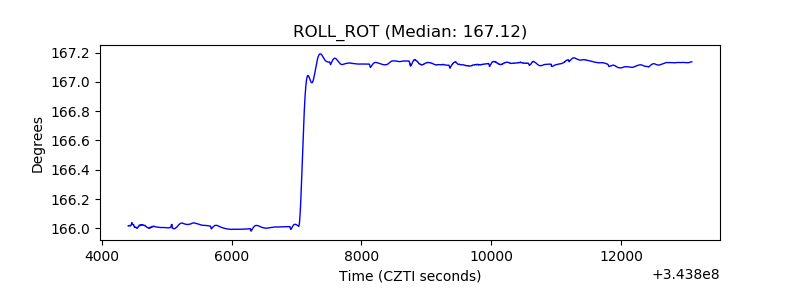 |
| _Roll_DEC | 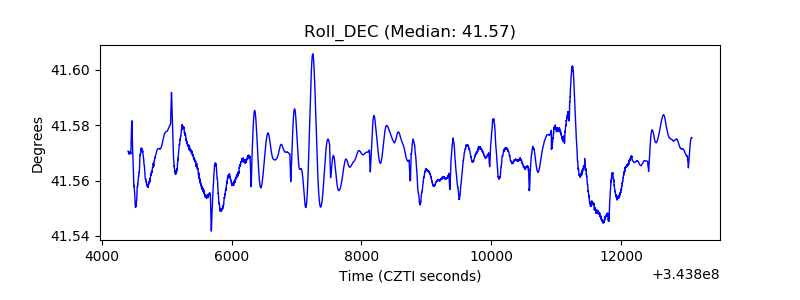 |
| _Roll_RA | 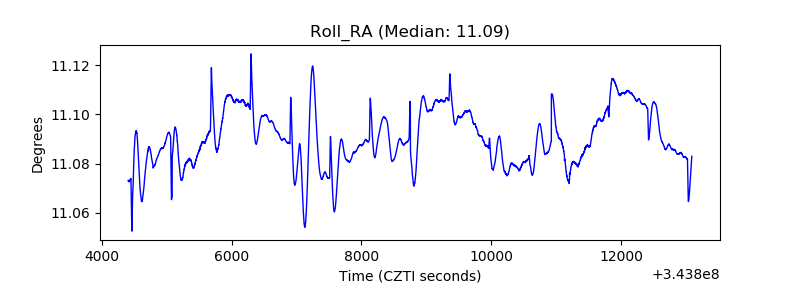 |
| Veto Counter | 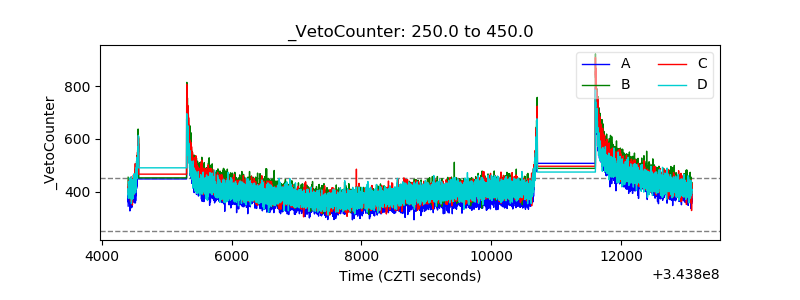 |