| Param | Original file | Final file |
|---|---|---|
| Filename | modeM0/AS1A10_002T05_9000004024_27874cztM0_level2.evt | modeM0/AS1A10_002T05_9000004024_27874cztM0_level2_quad_clean.evt |
| Size (bytes) | 548,510,400 | 81,587,520 |
| Size | 523.1 MB | 77.8 MB |
| Events in quadrant A | 3,409,531 | 523,165 |
| Events in quadrant B | 3,857,384 | 510,596 |
| Events in quadrant C | 5,169,672 | 473,642 |
| Events in quadrant D | 3,716,936 | 491,938 |
| Mode M0 | |||
|---|---|---|---|
| Quadrant | BADHDUFLAG | Total packets | Discarded packets |
| A | 0 | 14242 | 0 |
| B | 0 | 15676 | 0 |
| C | 0 | 19806 | 0 |
| D | 0 | 15369 | 0 |
| Mode M9 | |||
|---|---|---|---|
| Quadrant | BADHDUFLAG | Total packets | Discarded packets |
| A | 0 | 20 | 0 |
| B | 0 | 20 | 0 |
| C | 0 | 20 | 0 |
| D | 0 | 20 | 0 |
| Quadrant | Total seconds | Saturated seconds | Saturation percentage |
|---|---|---|---|
| A | 6763 | 88 | 1.301198% |
| B | 6763 | 119 | 1.759574% |
| C | 6763 | 550 | 8.132486% |
| D | 6763 | 111 | 1.641283% |
Noise dominated data is calculated using 1-second bins in cleaned event files. If a bin has >2000 counts, and if more than 50% of those come from <1% of pixels, then it is considered to be noise-dominated and hence unusable.
| Quadrant | # 1 sec bins | Bins with >0 counts | Bins with >2000 counts | High rate bins dominated by noise | Noise dominated (total time) | Noise dominated (detector-on time) | Marked lightcurve |
|---|---|---|---|---|---|---|---|
| A | 8703 | 6763 | 0 | 0 | 0.00% | 0.00% | 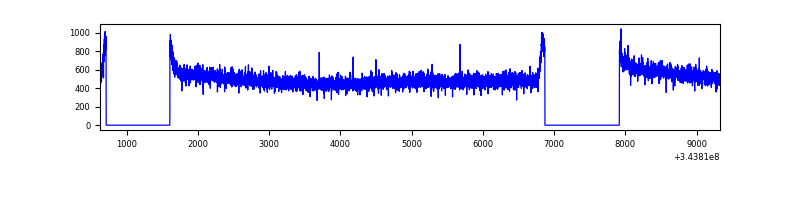 |
| B | 8703 | 6763 | 14 | 14 | 0.16% | 0.21% | 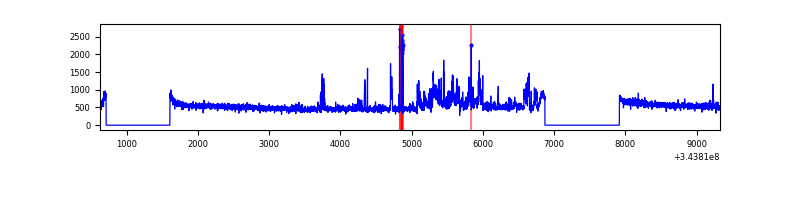 |
| C | 8703 | 6763 | 207 | 207 | 2.38% | 3.06% | 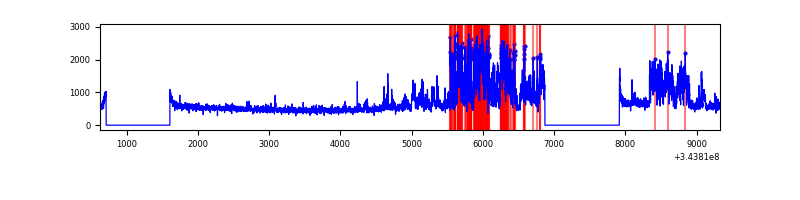 |
| D | 8703 | 6763 | 44 | 44 | 0.51% | 0.65% | 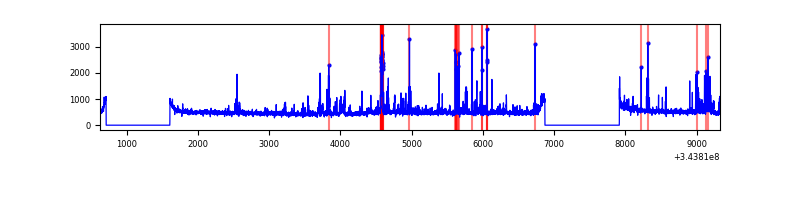 |
Top three noisy pixels from each quadrant. If the there are fewer than three noisy pixels in the level2.evt file, extra rows are filled as -1
| Pixel properties | Quadrant properties | ||||||
|---|---|---|---|---|---|---|---|
| Quadrant | DetID | PixID | Counts | Sigma | Mean | Median | Sigma |
| A | 13 | 254 | 12036 | 63.02 | 883 | 866 | 177.3 |
| A | 3 | 137 | 8355 | 42.25 | 883 | 866 | 177.3 |
| A | 0 | 226 | 7593 | 37.95 | 883 | 866 | 177.3 |
| B | 10 | 245 | 416332 | 2522.54 | 866 | 844 | 164.7 |
| B | 0 | 190 | 31536 | 186.34 | 866 | 844 | 164.7 |
| B | 12 | 111 | 20642 | 120.2 | 866 | 844 | 164.7 |
| C | 3 | 233 | 1861369 | 9691.84 | 814 | 820 | 192.0 |
| C | 14 | 238 | 131022 | 678.24 | 814 | 820 | 192.0 |
| C | 13 | 61 | 5577 | 24.78 | 814 | 820 | 192.0 |
| D | 1 | 52 | 306013 | 1543.58 | 841 | 818 | 197.7 |
| D | 2 | 250 | 126331 | 634.8 | 841 | 818 | 197.7 |
| D | 7 | 80 | 56013 | 279.16 | 841 | 818 | 197.7 |
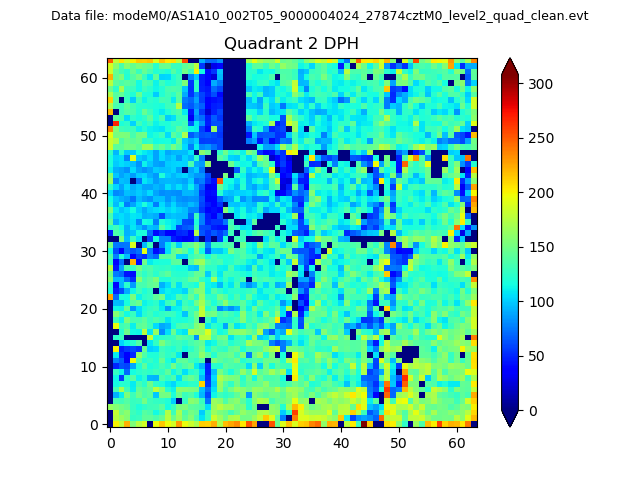
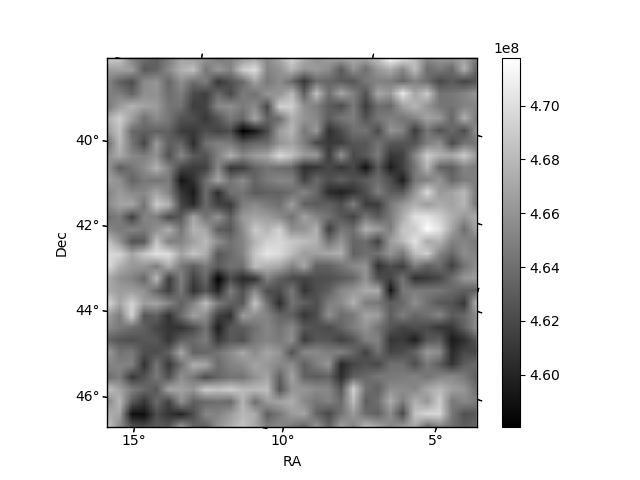
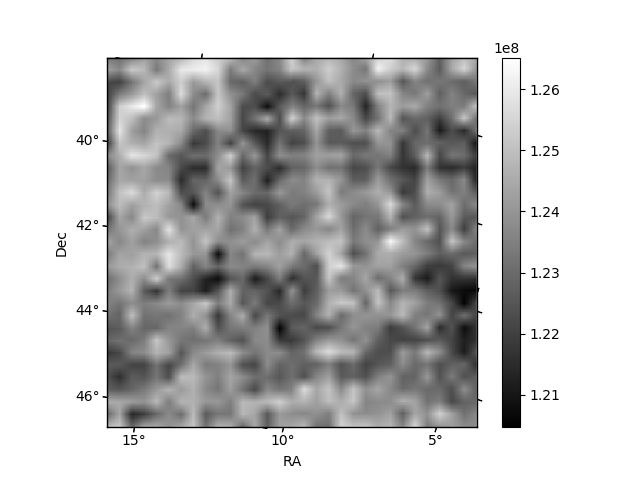
Histogram calculated using DETX and DETY for each event in the final _common_clean file
| Quadrant A | 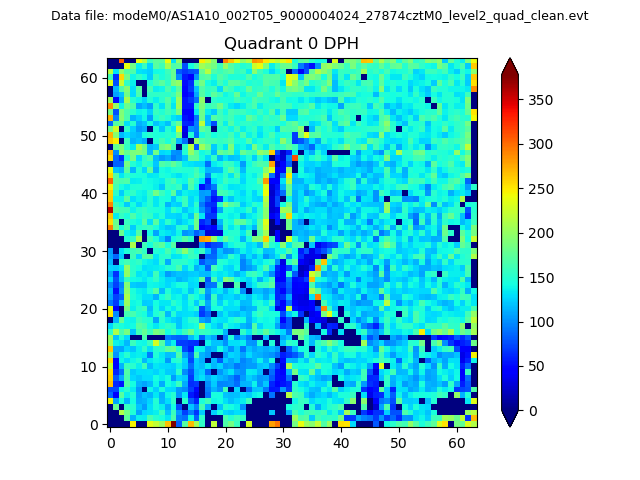 |
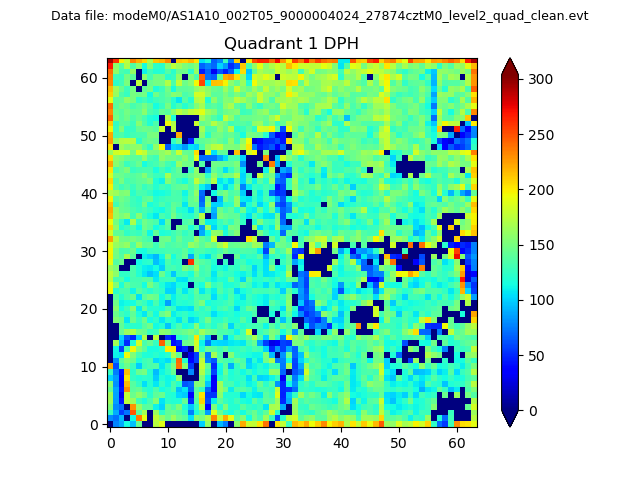 |
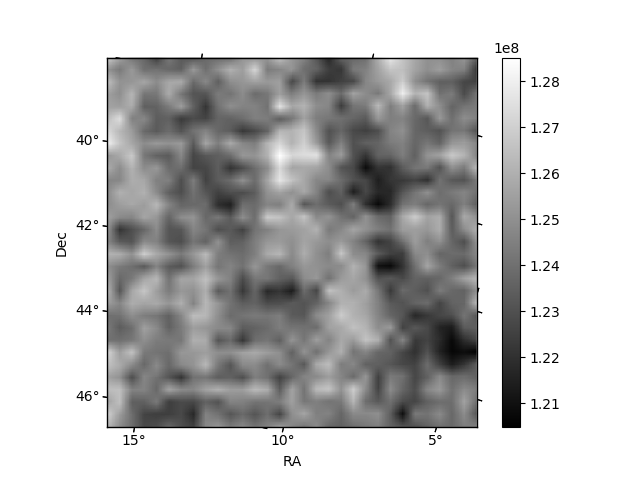
Quadrant B |
|---|---|---|---|
| Quadrant D | 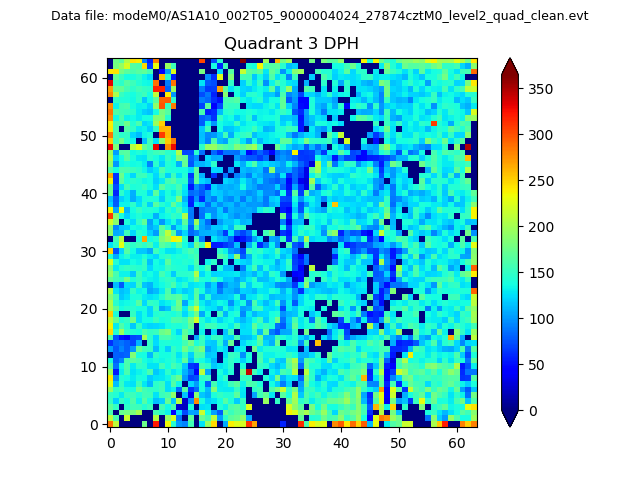 |
 |
Quadrant C |
| Plot type | Count rate plots | Images |
|---|---|---|
| Comparison with Poisson distribution Blue bars denote a histogram of data divided into 1 sec bins. Red curve is a Poisson curve with rate = median count rate of data. |
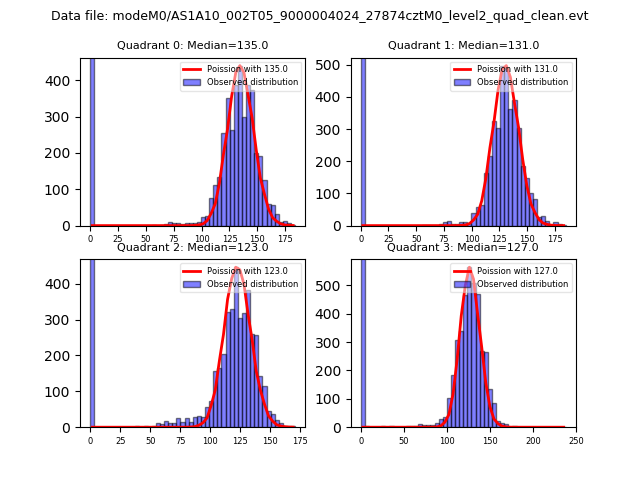 |
 |
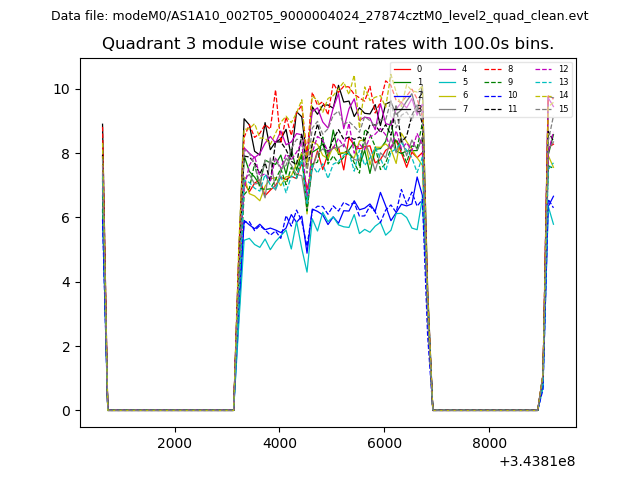
| Quadrant-wise count rates Data is divided into 100 sec bins |
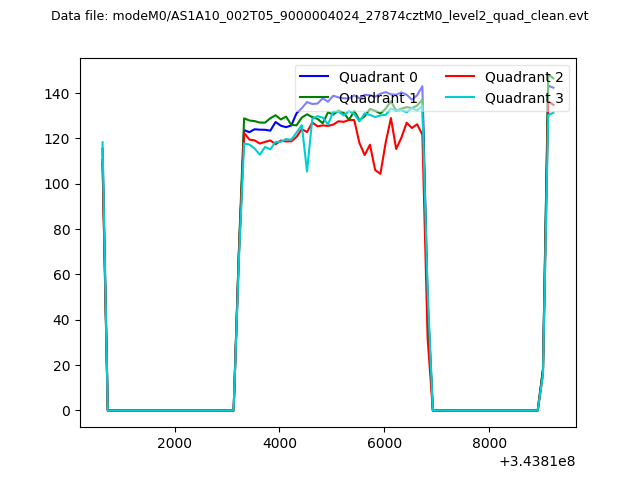 |
|
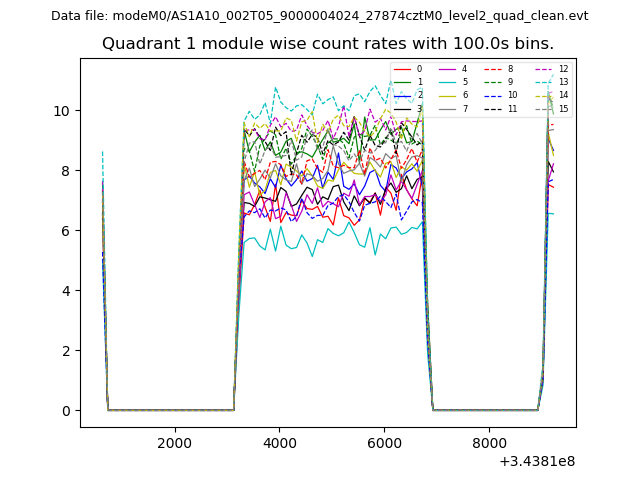
| Module-wise count rates for Quadrant A Data is divided into 100 sec bins |
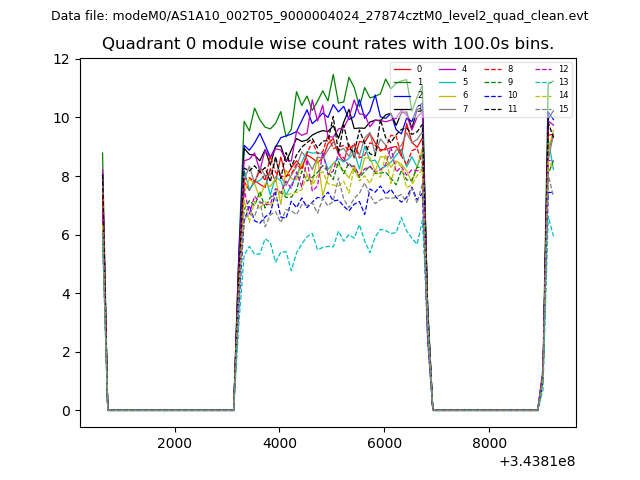 |
 |
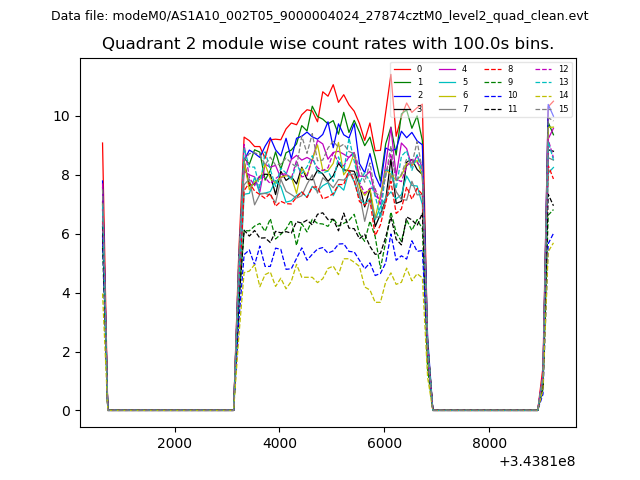
| Module-wise count rates for Quadrant B Data is divided into 100 sec bins |
 |
 |
| Module-wise count rates for Quadrant C Data is divided into 100 sec bins |
 |
 |
| Module-wise count rates for Quadrant D Data is divided into 100 sec bins |
 |
 |
| Parameter | Plot |
|---|---|
| CZT HV Monitor | 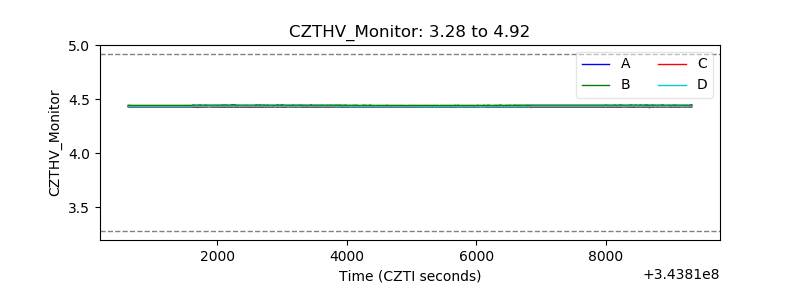 |
| D_VDD | 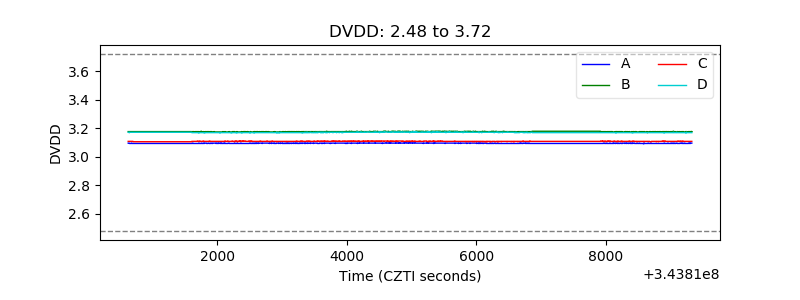 |
| Temperature 1 |  |
| Veto HV Monitor | 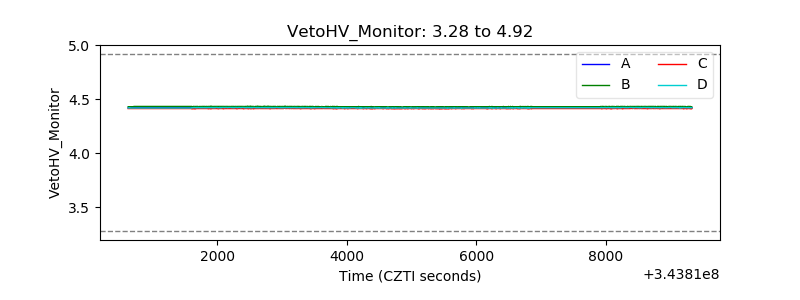 |
| Veto LLD | 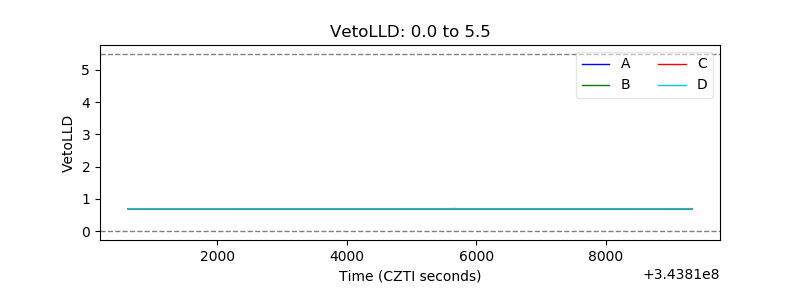 |
| Alpha Counter | 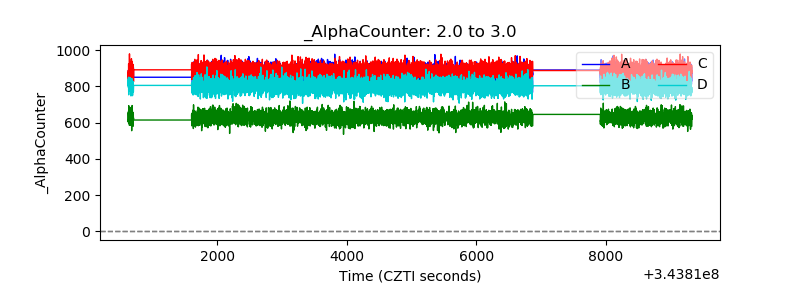 |
| _CPM_Rate | 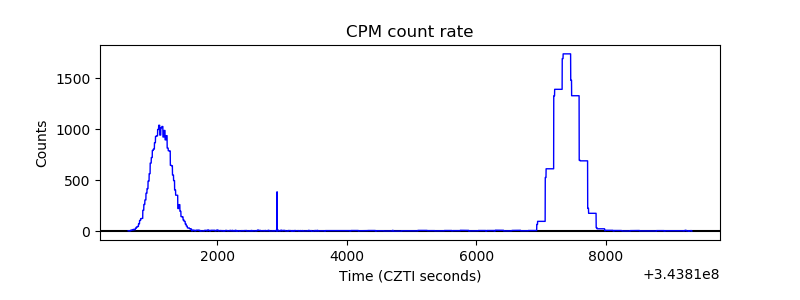 |
| CZT Counter | 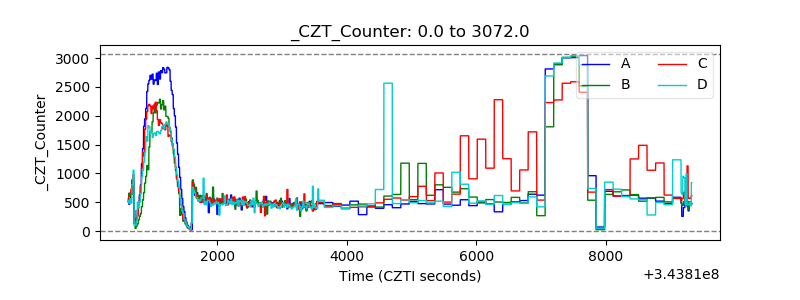 |
| +2.5 Volts monitor |  |
| +5 Volts monitor |  |
| _ROLL_ROT | 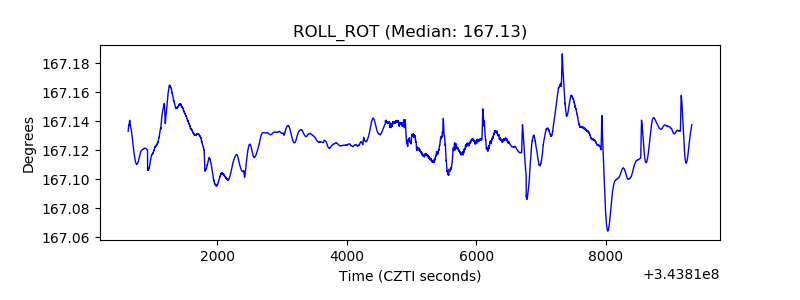 |
| _Roll_DEC | 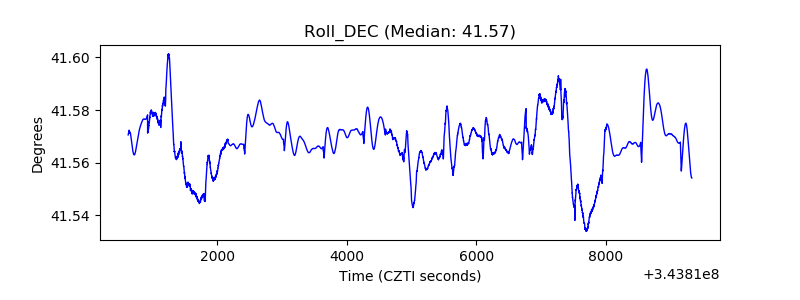 |
| _Roll_RA | 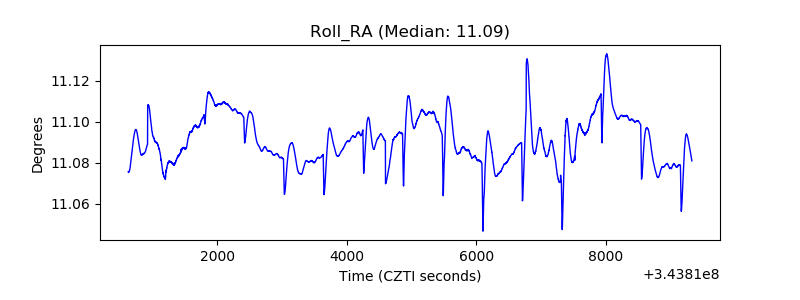 |
| Veto Counter | 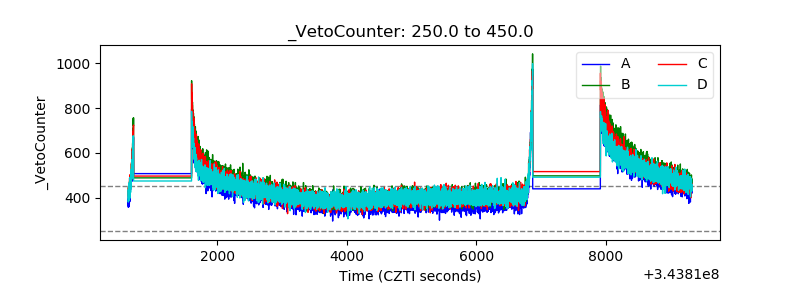 |