| Param | Original file | Final file |
|---|---|---|
| Filename | modeM0/AS1A10_002T05_9000004024_27876cztM0_level2.evt | modeM0/AS1A10_002T05_9000004024_27876cztM0_level2_quad_clean.evt |
| Size (bytes) | 509,400,000 | 92,272,320 |
| Size | 485.8 MB | 88.0 MB |
| Events in quadrant A | 3,191,790 | 619,944 |
| Events in quadrant B | 3,277,090 | 610,089 |
| Events in quadrant C | 4,265,248 | 570,545 |
| Events in quadrant D | 4,277,181 | 565,427 |
| Mode M0 | |||
|---|---|---|---|
| Quadrant | BADHDUFLAG | Total packets | Discarded packets |
| A | 0 | 13267 | 0 |
| B | 0 | 13525 | 0 |
| C | 0 | 16783 | 0 |
| D | 0 | 16675 | 0 |
| Mode M9 | |||
|---|---|---|---|
| Quadrant | BADHDUFLAG | Total packets | Discarded packets |
| A | 0 | 11 | 0 |
| B | 0 | 11 | 0 |
| C | 0 | 11 | 0 |
| D | 0 | 11 | 0 |
| Quadrant | Total seconds | Saturated seconds | Saturation percentage |
|---|---|---|---|
| A | 6132 | 69 | 1.125245% |
| B | 6133 | 80 | 1.304419% |
| C | 6133 | 223 | 3.636067% |
| D | 6132 | 183 | 2.984344% |
Noise dominated data is calculated using 1-second bins in cleaned event files. If a bin has >2000 counts, and if more than 50% of those come from <1% of pixels, then it is considered to be noise-dominated and hence unusable.
| Quadrant | # 1 sec bins | Bins with >0 counts | Bins with >2000 counts | High rate bins dominated by noise | Noise dominated (total time) | Noise dominated (detector-on time) | Marked lightcurve |
|---|---|---|---|---|---|---|---|
| A | 7277 | 6132 | 0 | 0 | 0.00% | 0.00% | 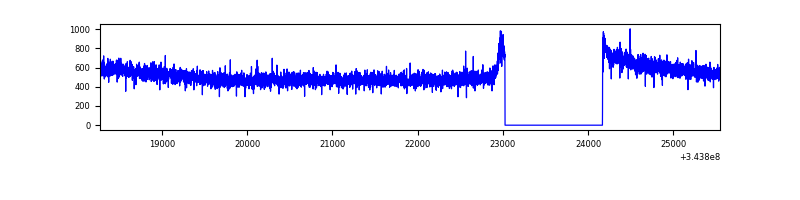 |
| B | 7278 | 6133 | 0 | 0 | 0.00% | 0.00% | 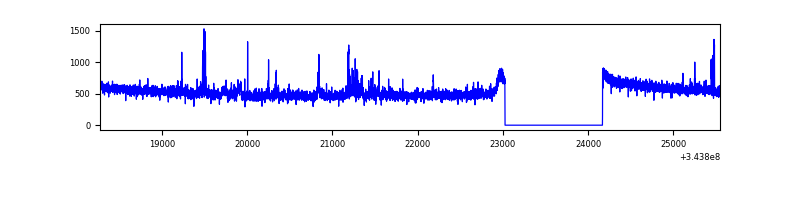 |
| C | 7278 | 6133 | 25 | 25 | 0.34% | 0.41% | 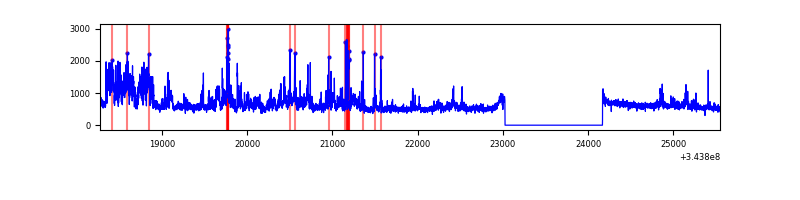 |
| D | 7277 | 6132 | 127 | 127 | 1.75% | 2.07% | 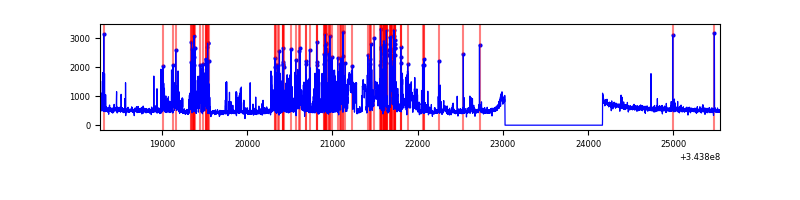 |
Top three noisy pixels from each quadrant. If the there are fewer than three noisy pixels in the level2.evt file, extra rows are filled as -1
| Pixel properties | Quadrant properties | ||||||
|---|---|---|---|---|---|---|---|
| Quadrant | DetID | PixID | Counts | Sigma | Mean | Median | Sigma |
| A | 13 | 254 | 11404 | 64.3 | 827 | 812 | 164.7 |
| A | 3 | 137 | 7582 | 41.1 | 827 | 812 | 164.7 |
| A | 0 | 226 | 7057 | 37.91 | 827 | 812 | 164.7 |
| B | 10 | 245 | 58116 | 374.35 | 808 | 789 | 153.1 |
| B | 0 | 190 | 43964 | 281.94 | 808 | 789 | 153.1 |
| B | 12 | 111 | 18096 | 113.02 | 808 | 789 | 153.1 |
| C | 3 | 233 | 1149528 | 6471.8 | 765 | 769 | 177.5 |
| C | 14 | 238 | 124288 | 695.87 | 765 | 769 | 177.5 |
| C | 15 | 208 | 8626 | 44.26 | 765 | 769 | 177.5 |
| D | 1 | 52 | 1107534 | 5971.68 | 785 | 767 | 185.3 |
| D | 2 | 250 | 139990 | 751.19 | 785 | 767 | 185.3 |
| D | 8 | 195 | 27150 | 142.35 | 785 | 767 | 185.3 |
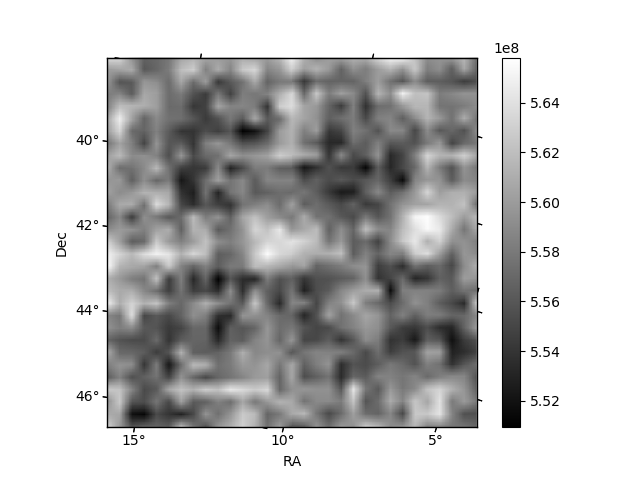
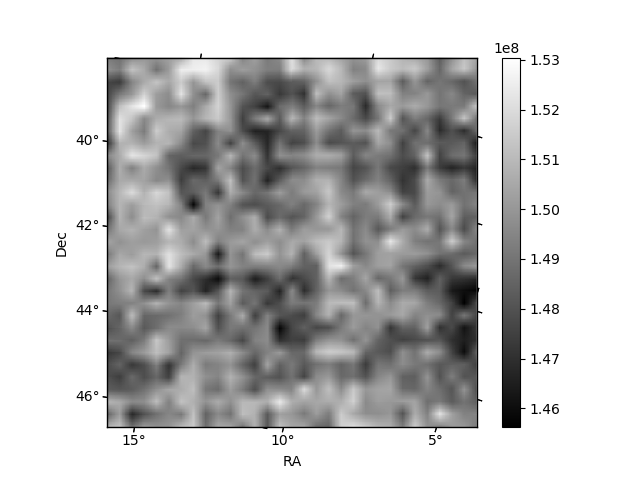
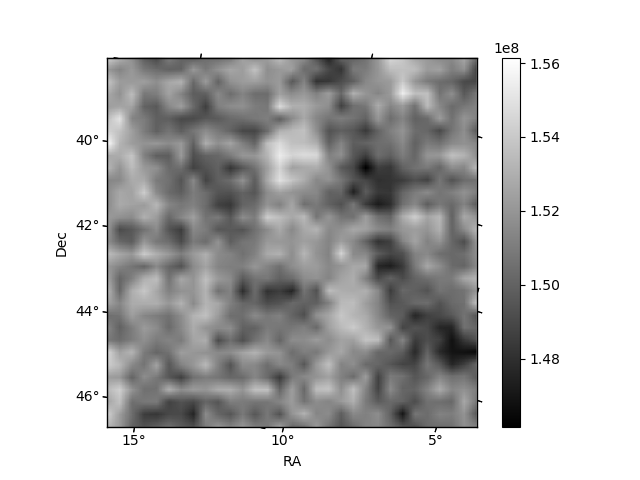
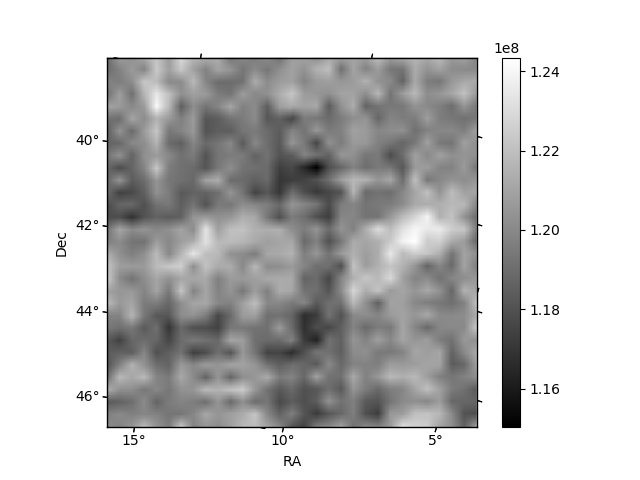
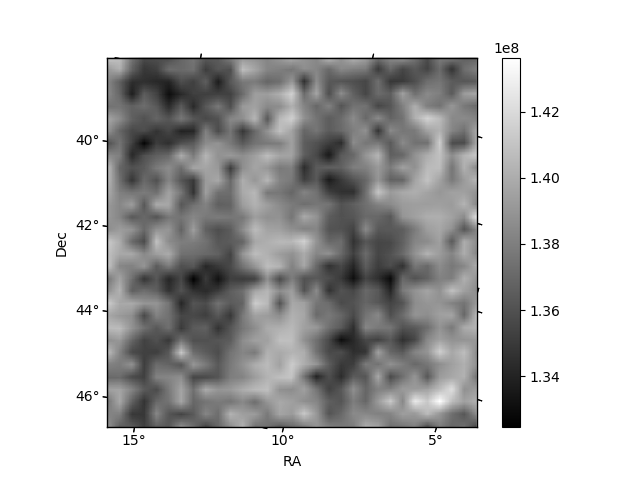
Histogram calculated using DETX and DETY for each event in the final _common_clean file
| Quadrant A | 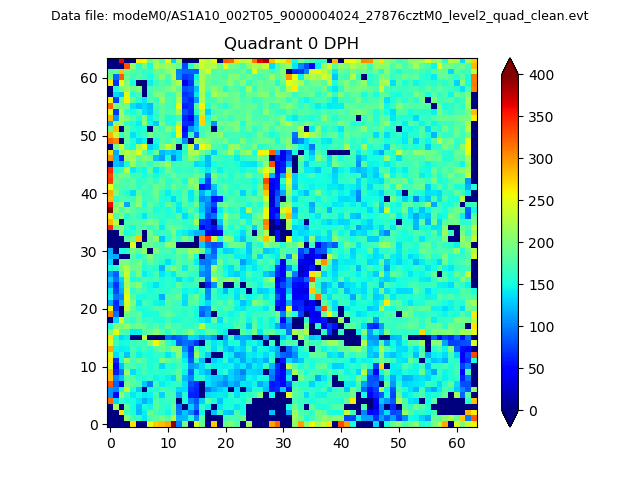 |
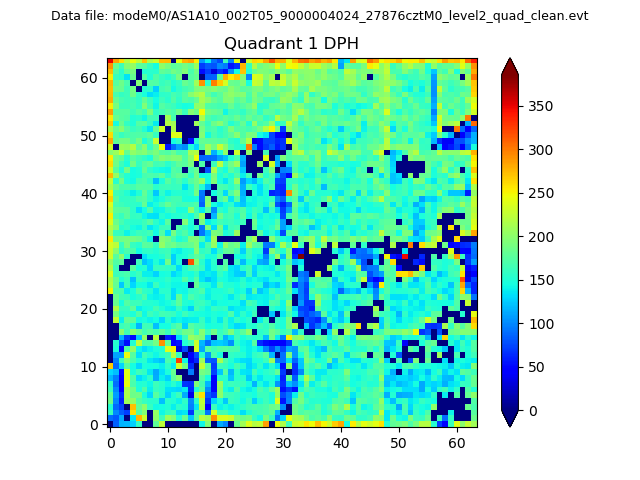 |
Quadrant B |
|---|---|---|---|
| Quadrant D |  |
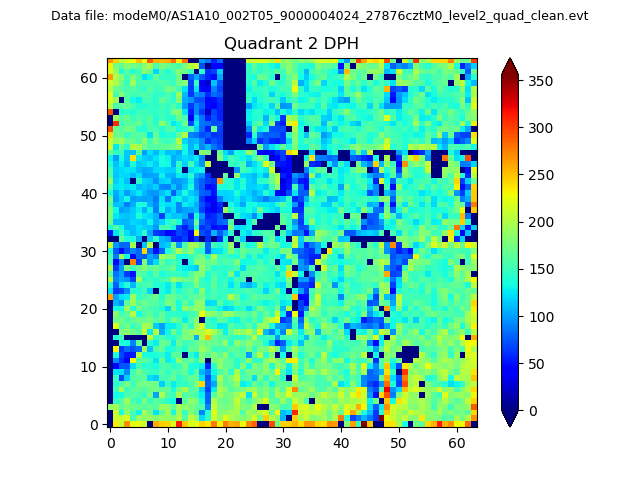 |
Quadrant C |
| Plot type | Count rate plots | Images |
|---|---|---|
| Comparison with Poisson distribution Blue bars denote a histogram of data divided into 1 sec bins. Red curve is a Poisson curve with rate = median count rate of data. |
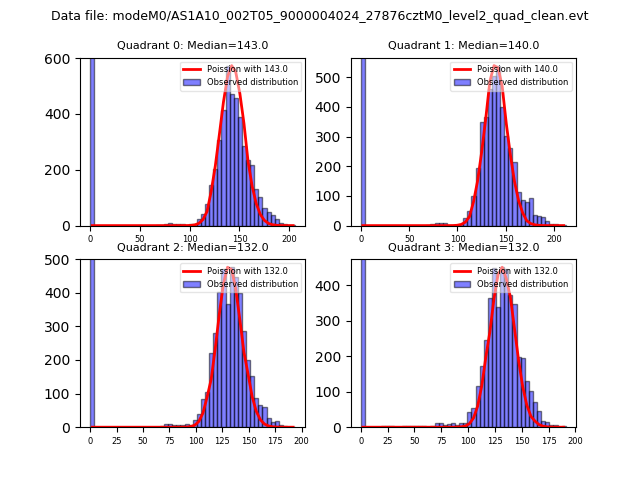 |
 |
| Quadrant-wise count rates Data is divided into 100 sec bins |
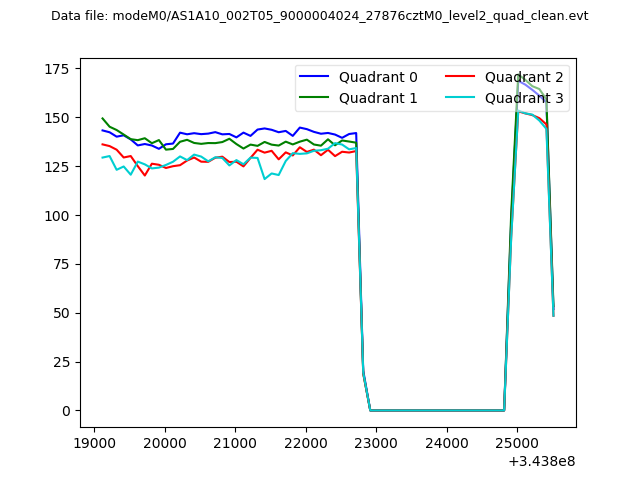 |
|
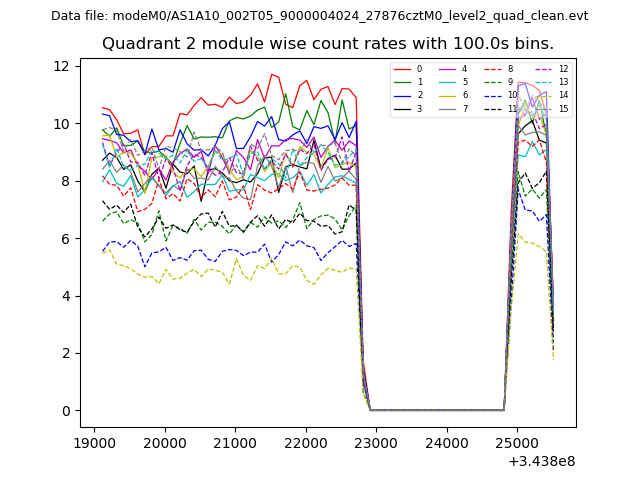
| Module-wise count rates for Quadrant A Data is divided into 100 sec bins |
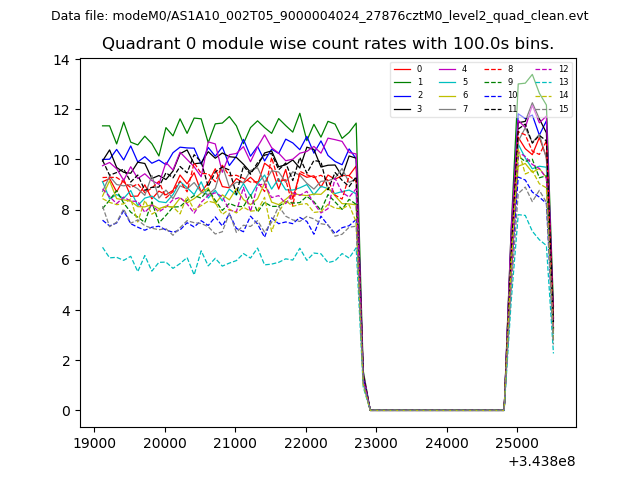 |
 |
| Module-wise count rates for Quadrant B Data is divided into 100 sec bins |
 |
 |
| Module-wise count rates for Quadrant C Data is divided into 100 sec bins |
 |
 |
| Module-wise count rates for Quadrant D Data is divided into 100 sec bins |
 |
 |
| Parameter | Plot |
|---|---|
| CZT HV Monitor |  |
| D_VDD | 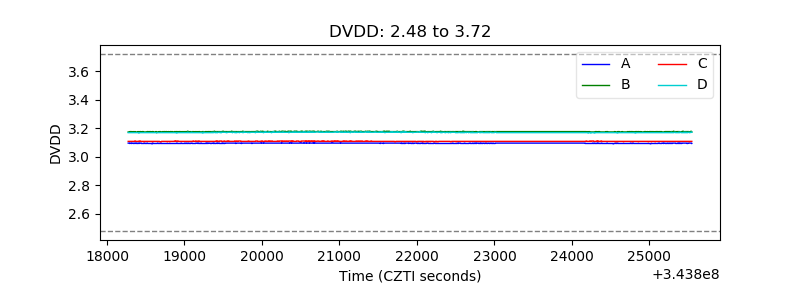 |
| Temperature 1 | 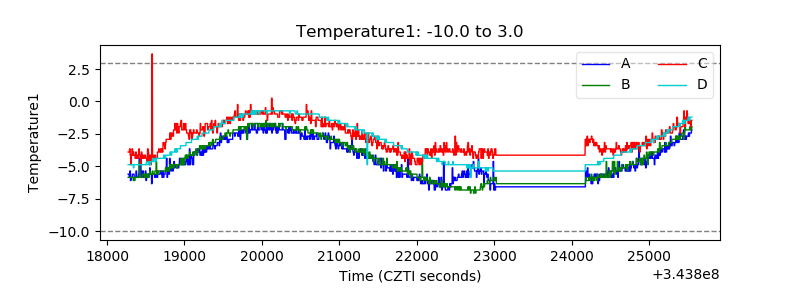 |
| Veto HV Monitor | 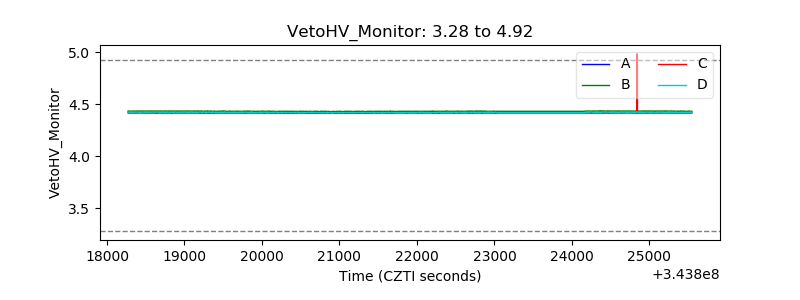 |
| Veto LLD | 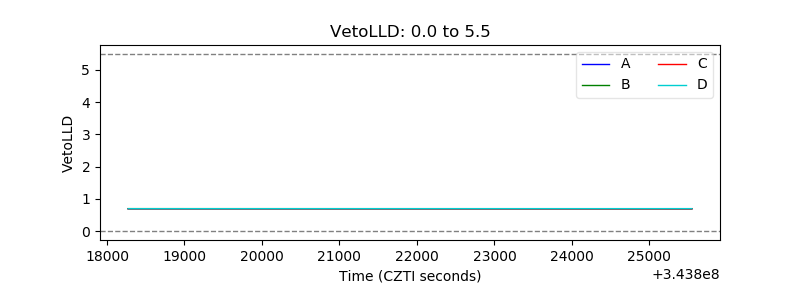 |
| Alpha Counter | 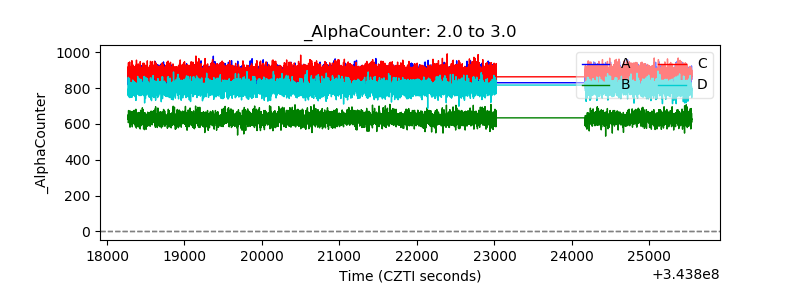 |
| _CPM_Rate | 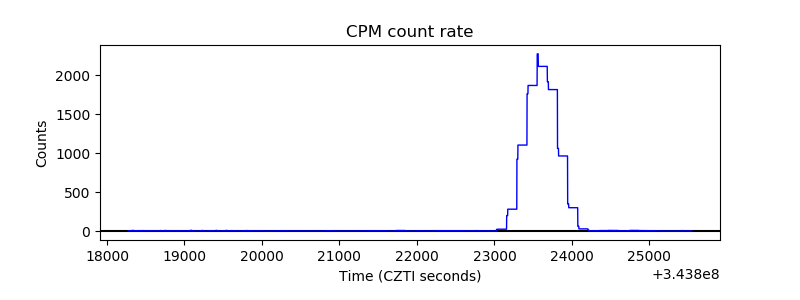 |
| CZT Counter | 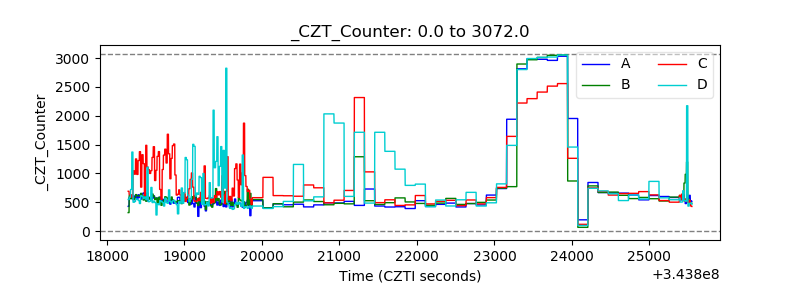 |
| +2.5 Volts monitor |  |
| +5 Volts monitor | 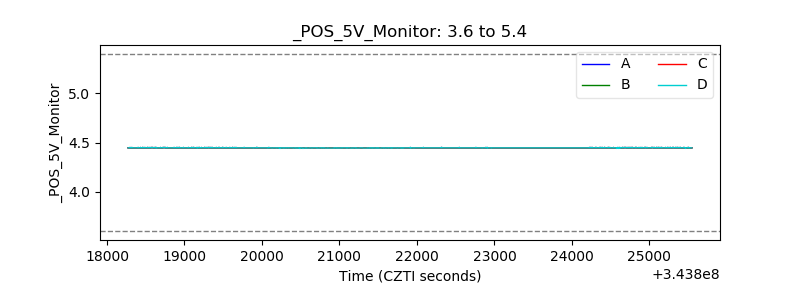 |
| _ROLL_ROT | 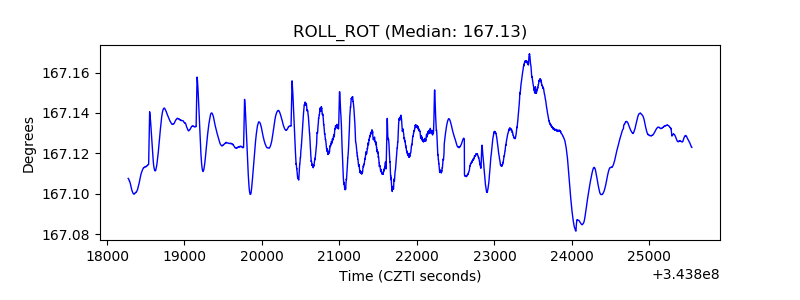 |
| _Roll_DEC | 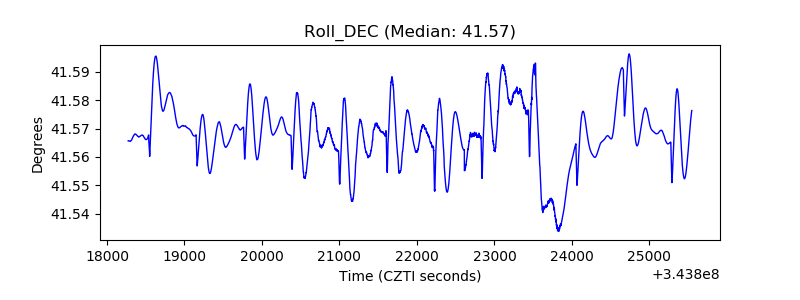 |
| _Roll_RA | 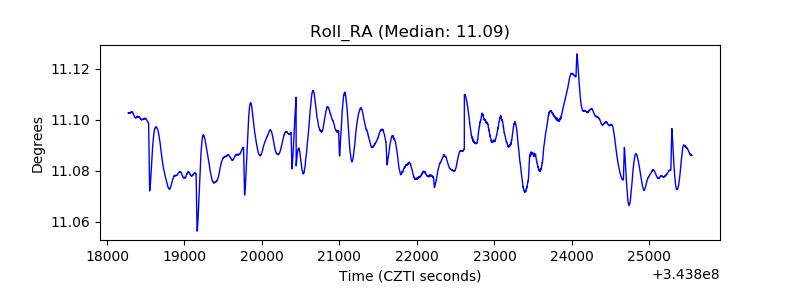 |
| Veto Counter | 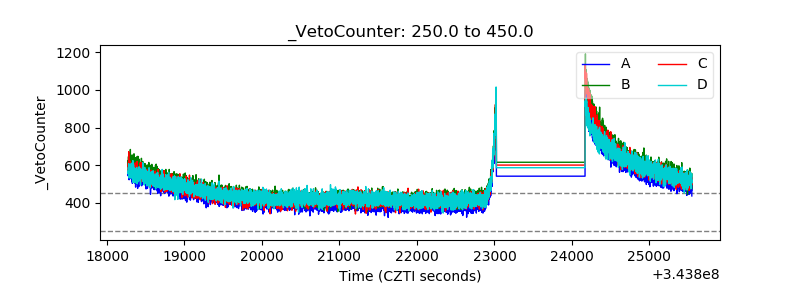 |